1
M
ASTER OF
S
CIENCE IN
FINANCE
MASTERS FINAL WORK
PROJECT
EQUITY RESEARCH
NETFLIX INC.
AUTHOR
DAVID HARSE DIPAC PARBHU
SUPERVISOR
PEDRO RINO VIEIRA
Acknowledgements
I would first like to thank my supervisor Prof. Pedro Rino Vieira. The door to Prof. Pedro Rino Vieira’s
office was always open whenever I ran into a trouble or had a question about my research or writing.
To thank also Prof. Clara Raposo, who always shown support during the master, especially when I
went for the exchange program in Milan, Italy. Without her, my experience abroad would not be
possible. Professor Clara is certainly one the best professors I’ve ever had during my student life.
I would also like to thank my family and friends for being supportive in this long and hard period of
time, without them this work would not be possible. Special thanks to my parents and my girlfriend
who gave me strengths and were always there for me to achieve this goal. To thank also my
grandparents, who always gave me confidence.
Index
Abstract Resumo Index of Figures Index of Tables Investment Snapshot ... 1 Netflix, Inc. ... 2Netflix Business Segments ... 4
Consolidated Financial Analysis ... 7
Industry Outlook ... 11
Traditional TV vs OTT TV – People’s behavior ... 11
Replace or Supplement? ... 12
What Is Traditional TV Doing To Fight For Its Future? ... 13
Why Do People Like Netflix? ... 15
Competitors ... 16
Future Moves ... 18
Key Valuation Drivers ... 19
Valuation Methodologies ... 20
Financial Forecast ... 22
Investment Risks ... 24
Risks To Price Target ... 25
Appendices a. Consolidated Income Statement ... 26
b. Consolidated Balance Sheet ... 27
c. Consolidated Cash Flow Statement ... 29
d. Return On Equity ... 30
e. Key Financial Ratios ... 31
f. Unlevered Free Cash Flow ... 32
g. Weighted Average Cost Of Capital ... 33
h. Revenues Forecast ... 38
i. Other Forecast Details ... 39
j. Global Internet Phenomena Report ... 40
References ... 44
Abstract
This study contains the valuation of Netflix, Inc. elaborated in accordance with the Lisbon School of
Economics & Management´s (ISEG) Finance Master´s Final Work Project. Our research is issued
considering the public available information on Netflix, Inc. on October 15
th, 2016. Thus, the report
does not consider any events or circumstances which have arisen after this date. The study was
elaborated recurring to the Discounted Cash Flow (DCF) Approach. The assumptions considered
to conduct this work were the result of a historical data analysis publicly disclosed by the company.
The final recommendation for Netflix, Inc. stands for ‘Buy’, with a price target of USD 125.57 for
2016YE, corresponding to an upside potential of +23.8% when compared to the closing price on
October 14
th2016 of USD 101.47.
Resumo
Este estudo contém a avaliação da Netflix, Inc., elaborado em conformidade com o Trabalho Final
do Programa de Mestrado em Finanças do Insituto Superior de Economia e Gestão (ISEG). Esta
pesquisa é emitida tendo em conta a informação pública disponível em 15 de Outubro de 2016.
Assim, o relatório não considera quaisquer eventos ou circunstâncias que surgiram após esta data.
O estudo foi elaborado através do método dos Fluxos de Caixa Descontados (DCF). Os
pressupostos considerados para realização deste trabalho foram o resultado de uma análise de
dados históricos divulgada publicamente pela empresa. A recomendação final para Netflix, Inc. é
de 'Comprar', com um preço-alvo de USD 125,57 para 2016YE, correspondendo a um ganho
potencial de +23.8% aquando comparado com o preço de fecho a 14 de Outubro de 2016 de USD
101,47.
Index of Figures
FIGURE 1|SIMULATIONS ON WACCAND TERMINAL GROWTH RATE &MONTE CARLO PRICE DISTRIBUTION | ____________ 1 FIGURE 2|USDEVICE PENETRATION IN TVHOUSEHOLDS | _________________________________________________ 1
FIGURE 3|OFFICIAL LOGO | ________________________________________________________________________ 2 FIGURE 4|NETFLIX’S OFFICES AROUND THE WORLD | _____________________________________________________ 2 FIGURE 5|TOTAL PAID SUBSCRIBERS PER YEAR | ________________________________________________________ 2 FIGURE 6|OWNERSHIP STRUCTURE | _________________________________________________________________ 2 FIGURE 7|DOMESTIC STREAMING REVENUES AND CONTRIBUTION MARGIN | ____________________________________ 4 FIGURE 8|INTERNATIONAL STREAMING REVENUES AND CONTRIBUTION MARGIN | ________________________________ 4 FIGURE 9|INTERNATIONAL EXPANSION TIMELINE FROM OCTOBER 2012ONWARDS | ______________________________ 4 FIGURE 10|MARKETING EXPENSES PER SEGMENT | ______________________________________________________ 5 FIGURE 11|DOMESTIC DVDREVENUES AND CONTRIBUTION MARGIN | ________________________________________ 5 FIGURE 12|SEGMENT WEIGHTS | ____________________________________________________________________ 5 FIGURE 13|CONTRIBUTION MARGIN PER SEGMENT | _____________________________________________________ 5 FIGURE 14|BCGMATRIX | _________________________________________________________________________ 6
FIGURE 15|INCOME STATEMENT BRIDGE IN 2015| _______________________________________________________ 7
FIGURE 16|ADDITIONS PER SEGMENT IN 2014AND 2015| _________________________________________________ 7 FIGURE 17|OPERATING COSTS EVOLUTION | ___________________________________________________________ 7 FIGURE 18|INTEREST COVER RATIO IN 2014AND 2015| __________________________________________________ 7 FIGURE 19|MRPUEVOLUTION | ____________________________________________________________________ 8 FIGURE 20|ADDITIONS PER SEGMENT IN Q1AND Q22016| _______________________________________________ 8 FIGURE 21|OPERATING COSTS IN Q1AND Q22016|_____________________________________________________ 8
FIGURE 22|REVENUES AND CONTRIBUTION MARGIN IN Q1AND Q22016| _____________________________________ 8 FIGURE 23|BALANCE SHEET COMPOSITION IN 2015| _____________________________________________________ 9 FIGURE 26|NET DEBT VS NET CASH FROM 2013TO 2015| ________________________________________________ 9 FIGURE 24|TOTAL CONTENT ASSETS VS STREAMING LIABILITIES | ___________________________________________ 9 FIGURE 25|STREAMING CONTENT LIABILITIES MATURITIES | ________________________________________________ 9 FIGURE 27|DEBT-TO-EQUITY RATIO EVOLUTION | _______________________________________________________ 9
FIGURE 28|SUMMARY OF THE CASH FLOWS IN THE LAST 3YEARS | _________________________________________ 10 FIGURE 29|WORKING CAPITAL DEVELOPMENT | ________________________________________________________ 10 FIGURE 30|CASH FLOW BRIDGE IN 2015| ____________________________________________________________ 10 FIGURE 31|CASH FLOWS IN Q1’16AND Q2’16| ________________________________________________________ 10 FIGURE 32|TVCONNECTIONS | ____________________________________________________________________ 11 FIGURE 33|OTTOPTIONS | _______________________________________________________________________ 11
FIGURE 34|OTTTVDRIVERS | ____________________________________________________________________ 11 FIGURE 35|OTTTVINCONVENIENT | ________________________________________________________________ 11 FIGURE 36|HOW DO PEOPLE WATCH VOD?| __________________________________________________________ 12 FIGURE 37|AVERAGE LIVE TVWATCHING PER YEAR VS NETFLIX’S STREAMING SUBSCRIBERS PER YEAR | ____________ 12 FIGURE 38|PERCENTAGE OF RESPONDENTS WHO CURRENTLY PAY PROVIDERS FOR PROGRAMMING | _______________ 12
FIGURE 39|PERCENTAGE OF CABLE /SATELLITE SUBSCRIBERS WHO PLAN TO CANCEL ITS SERVICE IN FAVOR OF AN
ONLINE SERVICE | __________________________________________________________________________ 12
FIGURE 40|TVEVERYWHERE PLAYERS | ______________________________________________________________ 13 FIGURE 41|CONSOLIDATION OF POWER | _____________________________________________________________ 13 FIGURE 42|LIVE AIRING | _________________________________________________________________________ 13 FIGURE 43|USTVVS DIGITAL AD SPENDING | _________________________________________________________ 14 FIGURE 44|FAVORABLE REASONS RELATED WITH ADS | __________________________________________________ 14 FIGURE 45|UNFAVORABLE REASONS RELATED WITH ADS | _______________________________________________ 14
FIGURE 46|NETFLIX SUCCESS FACTORS | ____________________________________________________________ 15 FIGURE 47|HULU LOGO | _________________________________________________________________________ 16 FIGURE 48|AMAZON PRIME LOGO | _________________________________________________________________ 16 FIGURE 49|MICHAEL E.PORTER’S FIVE FORCES | ______________________________________________________ 17 FIGURE 50|RATIO:CASH SPENT ON CONTENTS /AMORTIZATIONS OF CONTENTS | ______________________________ 19 FIGURE 51|REVENUES FORECAST BY SEGMENT | _______________________________________________________ 19
FIGURE 52|GROSS PROFIT MARGIN ESTIMATES | _______________________________________________________ 19 FIGURE 53|CASH SPENT IN CONTENTS VS TOTAL REVENUES | _____________________________________________ 19 FIGURE 54|OPERATIONAL EXPENSES FORECAST AS A%OF REVENUES | _____________________________________ 20 FIGURE 55|REVENUES GROWTH BY SEGMENT | ________________________________________________________ 22
FIGURE 56|EXPECTED MRPU| ____________________________________________________________________ 22 FIGURE 57|ESTIMATED CONTRIBUTION MARGIN | _______________________________________________________ 22 FIGURE 58|NETFLIX EXPECTED SEGMENT WEIGHT | _____________________________________________________ 22 FIGURE 59|EXPECTED PAID SUBSCRIBERS BY SEGMENT | ________________________________________________ 22 FIGURE 60|NETFLIX'S ROE| ______________________________________________________________________ 23 FIGURE 61|NETFLIX RISK MATRIX | _________________________________________________________________ 24 FIGURE 62|MONTE CARLO SIMULATION | _____________________________________________________________ 25
Index of Tables
TABLE 1|SWOTANALYSIS | _______________________________________________________________________ 3 TABLE 2|CERTAIN SHAREHOLDERS | _________________________________________________________________ 3 TABLE 3|KEY MANAGEMENT COMPENSATIONS | _________________________________________________________ 3 TABLE 4|OVERVIEW ON DOMESTIC STREAMING PAID MEMBERS AND MRPU| ___________________________________ 4 TABLE 5|TOP 3TITLES IN USBETWEEN 1STJANUARY –30THJUNE 2016| ______________________________________ 4
TABLE 6|OVERVIEW ON INTERNATIONAL STREAMING PAID MEMBERS AND MRPU| _______________________________ 4 TABLE 7|OVERVIEW ON DOMESTIC DVDPAID MEMBERSHIPS AND MRPU| ____________________________________ 5 TABLE 8|OTTTVOFFERINGS:PREVIOUS AND RELEASES | _______________________________________________ 13 TABLE 9|NETFLIX'S DEBT | ________________________________________________________________________ 21 TABLE 10|PRESENT VALUE OF OPERATING LEASES | ____________________________________________________ 21 TABLE 11|ANALYST'S ASSESSMENT | ________________________________________________________________ 25 TABLE 12|CHANGES IN WACCAND TERMINAL GROWTH RATE | ____________________________________________ 25 TABLE 13|NETFLIX'S CONSOLIDATED INCOME STATEMENT | _______________________________________________ 26 TABLE 14|CAGR2011-2015VS CAGR2016-2021-INCOME STATEMENT FIGURES | __________________________ 26 TABLE 15|NETFLIX'S INCOME STATEMENT SIZE | _______________________________________________________ 26 TABLE 16|NETFLIX'S CONSOLIDATED BALANCE SHEET | __________________________________________________ 27 TABLE 17|CAGR2011-2015VS CAGR2016-2021-BALANCE SHEET ASSETS FIGURES | _______________________ 27 TABLE 18|CAGR2011-2015VS CAGR2016-2021-BALANCE SHEET LIABILITIES FIGURES | _____________________ 27 TABLE 19|NETFLIX'S BALANCE SHEET SIZE | __________________________________________________________ 28 TABLE 20|NETFLIX'S CONSOLIDATED CASH FLOW STATEMENT | ____________________________________________ 29 TABLE 21|NETFLIX'S DUPONT IDENTITY | _____________________________________________________________ 30 TABLE 22|NETFLIX'S KEY FINANCIAL RATIOS | _________________________________________________________ 31 TABLE 23|NETFLIX'S DCF| _______________________________________________________________________ 32 TABLE 24|HISTORICAL PRICES OF MSCIAND NFLX| ___________________________________________________ 33 TABLE 25|WORLD INFLATION | _____________________________________________________________________ 34 TABLE 26|WORLD GROSS DOMESTIC PRODUCT | _______________________________________________________ 34 TABLE 27|BETA CALCULATION | ____________________________________________________________________ 35 TABLE 28|WEIGHTED AVERAGE COST OF CAPITAL | _____________________________________________________ 37 TABLE 29|NETFLIX'S PERPETUITY GROWTH MODEL | ____________________________________________________ 37 TABLE 30|CASH SPENT IN CONTENTS AS A%OF REVENUES | _____________________________________________ 37 TABLE 31|DOMESTIC STREAMING SEGMENT | __________________________________________________________ 38 TABLE 32|INTERNATIONAL STREAMING SEGMENT | ______________________________________________________ 38 TABLE 33|DOMESTIC DVDSEGMENT | _______________________________________________________________ 38 TABLE 34|FORECAST DETAILS | ____________________________________________________________________ 39 TABLE 35|TOP 10PEAK PERIOD APPLICATIONS IN NORTH AMERICA,FIXED ACCESS | ____________________________ 40 TABLE 36|TOP 10PEAK PERIOD APPLICATIONS IN NORTH AMERICA,MOBILE ACCESS | ___________________________ 40 TABLE 37|TOP 10PEAK PERIOD APPLICATIONS IN LATIN AMERICA,FIXED ACCESS | _____________________________ 40
TABLE 38|TOP 10PEAK PERIOD APPLICATIONS IN LATIN AMERICA,MOBILE ACCESS | ____________________________ 41
TABLE 39|TOP 10PEAK PERIOD APPLICATIONS IN AFRICA,FIXED ACCESS | ___________________________________ 41 TABLE 40|TOP 10PEAK PERIOD APPLICATIONS IN AFRICA,MOBILE ACCESS | __________________________________ 41 TABLE 41|TOP 10PEAK PERIOD APPLICATIONS IN ASIA-PACIFIC,FIXED ACCESS | _______________________________ 42 TABLE 42|TOP 10PEAK PERIOD APPLICATIONS IN ASIA-PACIFIC,MOBILE ACCESS | _____________________________ 42 TABLE 43|TOP 10PEAK PERIOD APPLICATIONS IN MIDDLE EAST,MOBILE ACCESS | _____________________________ 42 TABLE 44|DESCRIPTION OF THE APPLICATIONS ABOVE | _________________________________________________ 43
1
David Harse Dipac Parbhu is also known as Harsh Deepak
1
NETFLIX INC
NASDAQ: NFLXIndustry: Internet Services
BUY
INVESTMENT SNAPSHOTRECOMMENDATION
We issue a Buy recommendation for Netflix Inc. with a price target of USD 125.57 for 2016YE. Having a high-risk profile based on the fierce competition the company faces as well as the degree of dependence on its international activities, our price target registers an upside potential of +23.8% compared to the closing price on 14th October 2016 of USD 101.47.
► Massive international acceptance and domestic consolidation
In 2015, the company managed to attract 16.4 million paid subscribers, of which 10.7 million were external and 5.7 million internal, conducting thus to a record USD 6.8b in revenues (+23.2%). The international acceptance in the streaming services continued high during the first half of 2016 and the financials show us that the large investments done in acquisitions of contents, licensing and rights are starting to pay off.
► Satisfying long term perspectives
Our analysis on the industry demonstrate that the market is shifting to online sources over cable and satellite. Online TVs are conducting people to new viewing habits preferring to watch video on demand programming rather than scheduled and live TV. In addition, the number of connected video devices such as tablets, mobile devices and smart TVs will be higher than today and will make streaming services the primary source of TV.
► Highly accepted and awarded titles give confidence to subscribers Having subscribers happy and excited is the key for the success of the company because they feel engaged with the service. This is the case when companies like Netflix have awarded and exciting titles, such as, “House of Cards” and “The Orange is the New Black”. Besides that, Netflix has a huge number of contents on its library and it is an ad-free service.
RISK TO PRICE TARG ET
Weighted Average Cost of Capital
T e rm in a l Gr o wth Ra te $ 125.57 6.00% 6.50% 7.00% 7.30% 7.50% 8.00% 8.50% 1.50% $ 127.80 $ 115.17 $ 104.81 $ 99.39 $ 96.14 $ 88.78 $ 82.45 2.00% $ 143.30 $ 127.58 $ 114.96 $ 108.46 $ 104.60 $ 95.94 $ 88.58 2.50% $ 163.23 $ 143.08 $ 127.36 $ 119.42 $ 114.75 $ 104.40 $ 95.74 2.74% $ 175.04 $ 152.04 $ 134.39 $ 125.57 $ 120.41 $ 109.05 $ 99.64 3.00% $ 189.81 $ 163.01 $ 142.86 $ 132.93 $ 127.15 $ 114.54 $ 104.20 3.50% $ 227.02 $ 189.59 $ 162.80 $ 149.98 $ 142.65 $ 126.95 $ 114.34 4.00% $ 282.83 $ 226.80 $ 189.37 $ 172.21 $ 162.59 $ 142.45 $ 126.75
Risk Assessment HIGH
Time Horizon 3 MONTHS
Industry View FAVORABLE
Price Target USD 125.57
STATISTICS
Market Cap USD 43.55b Adjusted Beta 1.37 Float > 95% 52 Wk High USD 130.93 52 Wk Low USD 82.79 Dividend Yield NA FINANCIAL METRICS YE 2016 Revenues USD 8.6b Net Profit Margin 2.7% Equity Ratio 18.9% Debt-to-Equity Ratio 137.4% ROE 9.4% STOCK PERFORMANCE DCF Valuation WACC 7.30% Global Terminal Growth 2.74%
Enterprise Value 56,992
Debt 2016 3,371 Cash 2016 1,461
Equity Value 55,082
Shares Outstanding 2016 438.65
Target Share Price $ 125.57
Share Price at 14/10/2016 $ 101.47
Upside Potential +23.75%
Source: yahoofinance.com on 14th October 2016 | Right axis refers to volume in millions
Figure 1 | Simulations on WACC and Terminal Growth Rate & Monte Carlo Price Distribution
| Red – Sell, Orange – Reduce, Yellow – Hold, Blue – Buy and Dark Blue – Strong Buy | Source: H. Deepak analysis
Figure 2 | US Device Penetration in TV households | Source: Nielsen Total Audience Report Q1 2016
0 20 40 60 80 100 120 140 160 $0 $20 $40 $60 $80 $100 $120 $140 $160
Oct-14 Mar-15 Aug-15 Jan-16 Jun-16
0 20 40 60 80 100 FCFF 49% 49% 50% 49% 50% 50% 41% 42% 45% 46% 48% 50% 30% 35% 40% 45% 50% 55% 2014 Q4 2015 Q1 2015 Q2 2015 Q3 2015 Q4 2016 Q1 DVR SVOD Closing Price $ 101.47 Price Target $ 125.57
2
NETFLIX, INC.Founded in 1997, Netflix is an American global provider of streaming movies and TV series with over 93 million subscribers around the world. Known as a streaming video-on-demand provider (SVoD), the members of this service can watch the contents they want, anytime and anywhere as long as they have an internet-connected device.
It all started as a DVD-by-mail delivery service. In 2007, the company reported its billionth DVD sold and began to move from its original core business to streaming. In fact, back at the beginning of the decade, the market trends and technologies were changing and the management promptly decided to turn into a completely different new business line. Since then, the company managed to add a huge number of subscribers and steadily increase their revenues, offering an appealing programming mix of content. Not just as a provider of streaming service, Netflix also acts as a producer, having already won awards and gain members’ confidence. Headquartered in Los Gatos, California, the company has three segments: Domestic Streaming, International Streaming and Domestic DVD. For every business line, the revenues are derived from monthly subscription fees. The majority of them are generated in the United States.
The Netflix service is considered the biggest source of Internet traffic in North America, according to Sandvine’s Global Internet Phenomena report. With 3,700 employees, serve over 190 countries and produce hundreds of hours of original programming.
Ownership Structure
According to the company’s notice of Annual Meeting of stockholders held on June 2016, 80.7% of the company ownership were held by institutional and mutual funds, 4.9% held by directors and executive officers and the remaining 14.4% to non-institutional organizations as public and others (Figure 6). The highest share position among the institutional shareholders belongs to Capital Research Global Investors with 8.0% of shares and recognized as the world’s oldest and largest investment management organization.
Each holder of a share of common stock will be entitled to one vote for each share held on all matters voted upon at the Annual Meeting. These ordinary shares grant also the right to receive information, profit sharing and pre-emptive rights in capital increases, as well as the generally applicable obligations of capital contributions and loyalty.
Corporate Governance
Netflix’s is organized through an Anglo-Saxon model, which includes a board of directors, an audit committee, a compensation committee, a nominating & governance committee and a statutory auditor (EY). The company has a flat structure. Has 5 independent directors from a total of 17 members of the board of directors. According to the annual reports, Netflix continuously assesses good practices within the governance model, aiming also to be adaptable to the new challenging world.
Figure 5 | Total paid subscribers per year | Numbers in millions | Source: Netflix Form 10-K
Figure 6 | Ownership structure | Source: NASDAQ.com
Note: Netflix does not have offices in China, Crimea, North Korea and Syria.
Figure 4 | Netflix’s offices around the world | Source: Netflix.com
4.9%
80.7% 14.4%
Directors and Executive officers Institutional & Mutual Funds Public and Others
Figure 3 | Official logo | Source: Netflix Media Center
33 38 48 60 76 10 20 30 40 50 60 70 80 2011 2012 2013 2014 2015
3
Company’s Key Members
Reed Hastings serves Netflix Inc. as the Chairman, President and Chief
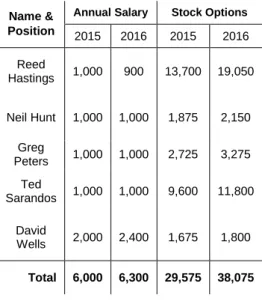
Executive Officer. He is one of the co-founders and is graduated in Artificial Intelligence from Stanford University. Reed is also a board member of Facebook and was on the board of Microsoft from 2007 to 2012. David Wells is the company’s Chief Financial Officer since 2010, holds an MBA and M.P.P. from The University of Chicago. Ted Sarandos has led content acquisition for Netflix since 2000 as a Chief Content Officer. He was considered one of the most influential people in 2013. Ted has also been a producer of several awarded winning documentaries and movies. Neil Hunt serves Netflix as the Chief Product Officer, leading the optimization of the Netflix experience. He holds a Doctorate in Computer Science from the University of Aberdeen. Kelly Bennett became Netflix Chief Marketing Officer in 2012 after nearly a decade at Warner Bros.
Bennett is a graduate of Simon Fraser University. Tawni Cranz became
Chief Talent Officer in October 2012 and manages the human resources.
Tawni holds an EMBA from Claremont University's Peter F. Drucker and
Masatoshi Ito Graduate School of Management. Jonathan Friedland leads the global team responsible for corporate communications, content publicity, social media and brand public relations as the Chief Communications Officer. He has a MSc in Economics from the London School of Economics. David Hyman is General Counsel for Netflix, responsible for all legal and public policy matters for the company. David earned his JD and bachelor’s degrees from the University of Virginia. Greg
Peters is International Development Officer for Netflix, responsible for the
global partnerships with provider and distributors. Greg holds a degree in physics and astronomy from Yale University (Table 2).
Netflix, Inc. Competitive Position Table 1 | SWOT analysis |
Source: H. Deepak Analysis
Table 2 | Certain shareholders | Source: Netflix's notice of annual meeting of stockholders - June 2016 Name Description % Capital Research Global Investors Investment Group 8.08% Morgan Stanley Investment Bank 5.34% BlackRock, Inc. Asset Management 5.71% The Vanguard Group, Inc. Investment Group 5.57% Reed Hastings Chairman / CEO 2.94% Jay C. Hoag Nominating & Governance Committee 1.29%
Neil Hunt CPO < 1%
Ted Sarandos CCO < 1% Richard N. Barton Executive Chairman of the Board < 1% Leslie Kilgore Served the Company as CMO < 1% A. George (Skip) Battle Compensation Committee & Investor < 1% Greg Peters - < 1% Timothy M. Haley Compensation Committee < 1%
David Wells CFO < 1%
Ann Mather Audit
Committee < 1% Bradford L. Smith President / CLO, Microsoft Corp < 1% Anne M. Sweeney Served the Company as a director < 1% All directors and
executive officers as a group
4.90%
Table 3 | Key management compensations | Numbers in 000’ of dollars | Source: Netflix's notice of annual meeting of stockholders - June 2016
Strengths Weaknesses
► Leader in the industry;
► Internationally recognized and strong brand
management;
► High quality and diverse contents;
► Employees with specialized know-how.
► Driven by seasonality in some situations;
► Does not hedge against fluctuations in currency rates;
► Strong dependence in suppliers;
► Switching costs are low.
Opportunities Threats
► Improve securitization in the system and streaming service;
► Provide more compelling mix of contents in markets where the company just entered;
► Expand to China;
► Partnerships.
► Subject to rapid technology change;
► Cyber-attacks, viruses and hackers;
► Fraudulent usage of the payment methods;
► Refusal of licenses by studio content providers and other right holders.
Name & Position
Annual Salary Stock Options
2015 2016 2015 2016 Reed Hastings 1,000 900 13,700 19,050 Neil Hunt 1,000 1,000 1,875 2,150 Greg Peters 1,000 1,000 2,725 3,275 Ted Sarandos 1,000 1,000 9,600 11,800 David Wells 2,000 2,400 1,675 1,800 Total 6,000 6,300 29,575 38,075
4
NETFLIX BUSINESS SEG MENTSDomestic Streaming
Revenues in the Domestic Streaming segment hit USD 4.2b in 2015, representing a growth of 21.8% year on year (Figure 7). This growth was due to an increase of 5.7 million (+15.1%) paid subscribers and, at the same time, an increase of 5.8% in the MRPU. For the first 2 quarters of 2016, revenues continued to register an upward trend. Historically, the Q1 is strong in terms of additions and that was the case, as it added 2.3 million paid subscribers against 290 thousand in Q2’16 (Table 4).
The efforts made by Netflix in attracting the domestic market resulted in an increase of 12.4% in costs. Including more exclusive and original programming, cost of revenues increased 13.0% and marketing 8.2%. Despite these factors, the segment improved its contribution margin to 32.9% (+5.6 pp).
Table 4 | Overview on Domestic Streaming paid members and MRPU | Source: Netflix Form 10-K, Q2 2016 earnings and H. Deepak analysis
Table 5 | Top 3 titles in US between 1st January – 30th June 2016 | Demand ExpressionsTM: Total audience demand, across all platforms, within a market | Source: parrotanalytics.com
Titles Channel Median Demand
ExpressionsTM IMDb Rating 1 Fuller House Netflix 6,545,791 7.1 / 10 2 Orange Is The New Black Netflix 6,292,863 8.3 / 10
3 11.22.63 Hulu 5,564,009 8.3 / 10
International Streaming
For 2015, International Streaming segment showed an impressive growth of 63.5% in paid subscribers, leading to a USD 2.0b (+49.3%) in revenues outside US (Figure 8). Netflix managed to add 10.7 million people with its strong market penetration around the world during 2015. Its MRPU decreased to USD 5.93 cents (-8.7%), due to the impact of exchange rate fluctuations. In Q1’16, the segment registered the highest addition in a quarter since 2010, the beginning of the expansion (Table 6).
Financially speaking, the segment reported losses. The fact of having to adapt contents to its international market, country by country, by investing in contents locally accepted, makes its content costs base very high, which, when coupled with marketing expenses surpass the segment revenues. As a result, for 2015, the contribution margin deteriorated 4.9 pp. For the first half of 2016, the situation is a bit different. The company managed to improve its contribution margin up to -9.1% in Q2’16 (+1.1 pp.), giving us signs that from 2017 onwards, it starts delivering profits.
Table 6 | Overview on International Streaming paid members and MRPU | Source: Netflix Form 10-K, Q4 earnings and H. Deepak analysis
Year Ended 3 Months Ended
In millions except for MRPU 2014 2015 Q1'16 Q2'16
Paid Memberships 16.778 27.438 31.993 33.892
Additions +7.056 +10.660 +4.555 +1.899
MRPU $ 6.50 $ 5.93 $ 6.79 $ 7.46
Figure 7 | Domestic Streaming revenues and contribution margin | Numbers in 000’ except for contribution margin | Source:Netflix Form 10-K, Q2 2016 earnings and H. Deepak Analysis
Figure 8 | International Streaming revenues and contribution margin | Numbers in 000’ except for contribution margin | Source: Netflix Form 10-K, Q2 2016 earnings and H. Deepak Analysis
Figure 9 | International expansion timeline from October 2012 onwards |
Source: Netflix Form 10-K $3,431 $4,180 $1,161 $1,208 27.3% 32.9% 35.5% 34.3% 0% 5% 10% 15% 20% 25% 30% 35% 40% 500 1,000 1,500 2,000 2,500 3,000 3,500 4,000 4,500 2014 2015 Q1'16 Q2'16 Year Ended 3 Months Ended Revenues Contribution Margin
$1,308 $1,953 $652 $758 -12.2% -17.1% -16.0% -9.1% -18% -16% -14% -12% -10% -8% -6% -4% -2% 0% 500 1,000 1,500 2,000 2,500 2014 2015 Q1'16 Q2'16 Year Ended 3 Months Ended Revenues Contribution Margin Year Ended 3 Months Ended
In millions except for MRPU 2014 2015 Q1'16 Q2'16
Paid Memberships 37.698 43.401 45.714 46.004 Additions +5.986 +5.703 +2.313 +0.290 MRPU $ 7.59 $ 8.03 $ 8.47 $ 8.75 October 2012 Finland, Denmark, Sweden, Norway September 2013 Netherlands September 2014 Germany, Austria, Switzerland, France, Belgium, Luxembourg March 2015 Australia, New Zealand September 2015 Japan October 2015 Spain, Portugal, Italy
5
Domestic DVD
Unlike streaming segments, Domestic DVD segment revenues present a downward trend, reaching to a USD 645.7m in 2015, a decrease of 16.0% compared with 2014 (Figure 11). The negative trend is explained by the decline in paid memberships to 4.8 million people, which corresponds to a loss of 881 thousand people. Historically, the Q1 for the DVD segment represents a slow in losses and that was verified with a loss of 140 thousand compared to 212 thousand in Q2’16 (Table 7).
The strong acceptance of the streaming services had an important impact for the company lower its investments in the DVD segment. Nevertheless, the segment continues to deliver profits and we highlight the fact that this is the business line with the highest contribution margin. Since 2014, the company benefits from the absence of marketing expenses, which boosts its contribution margins up to, approximately, 50.0%.
Table 7 | Overview on Domestic DVD paid memberships and MRPU | Source: Netflix Q2 earnings and H. Deepak Analysis
Netflix segments weight
In 2015, Netflix revenues came from 61.7% of Domestic Streaming, 28.8% of International Streaming and 9.5% of Domestic DVD (Figure 12). Even though Domestic DVD is an obsolete segment, we highlight the fact that it still delivers profits, in which, the company uses to invest in the streaming part of the business. Considering all the operational expenses, Domestic Streaming segment is the most efficient one, with 32.9% of contribution margin in the overall business. International Streaming segment, which is still giving losses, is expected to turn into a profit-making segment after large investments done in contents and marketing in the last 2 years. To note that international marketing expenses surpassed domestic ones in 2014. In 2015, it ended USD 188.8m ahead of domestic (Figure 10 & 13).
Figure 10 | Marketing expenses per segment |
Numbers in millions | Source: Netflix Form 10-K and H. Deepak analysis
Figure 11 | Domestic DVD revenues and contribution margin | Numbers in 000’ except for contribution margin | Source: Netflix Form 10-K, Q2 earnings and H. Deepak analysis
Figure 12 | Segment weights |
Source: Netflix Form 10-K and H. Deepak Analysis
Figure 13 | Contribution margin per segment | Source: Netflix Form 10-K and H. Deepak analysis
$257 $265 $293 $318 $201 $204 $314 $506 7 0 -2012 2013 2014 2015 Domestic DVD International Streaming Domestic Streaming $765 $646 $145 $139 48.1% 49.8% 49.5% 51.1% 47% 47% 48% 48% 49% 49% 50% 50% 51% 51% 52% 100 200 300 400 500 600 700 800 900 2014 2015 Q1'16 Q2'16 Year Ended 3 Months Ended Revenues Contribution Margin Year Ended 3 Months Ended
In millions except for MRPU 2014 2015 Q1'16 Q2'16
Paid Memberships 5.668 4.787 4.647 4.435 Additions -1.097 -0.881 -0.140 -0.212 MRPU $ 11.25 $ 11.24 $ 10.38 $ 10.43 -150% -100% -50% 0% 50% 100% 2012 2013 2014 2015 Domestic Streaming International Streaming Domestic DVD 0% 10% 20% 30% 40% 50% 60% 70% 80% 90% 100% 2012 2013 2014 2015
6
Boston Consulting Group Matrix
From a BCG perspective, the displayed figure (Figure 14) shows the position of the 3 segments Netflix operates relative to market growth and market share. Given the Form 10-K, the firm has its segments on Cash Cow, Star and Dog.
The ‘Cash Cow’ at Netflix is the Domestic Streaming segment. The growth perspectives of this segment for the medium / long term are moderate to low. The company will need to continuously attract people with new and interesting content. Currently, Netflix is the leader in US, having a market share of around 80%, according to Parrot Analytics. Its 47.9 million paid subscribers help the company generate high amounts of cash, allowing the company to reinvest the money in their International segment. It is the flagship of the company.
We classified the International Streaming segment as ‘Star’, as this segment presents a high growth rate. However, there is some uncertainty relatively of how much market share the segment earned around the world during 2015 and 2016. Its heavy investments need to be justified with high revenues. Its content offerings need to be in line with the peoples’ preferences. It is important to note that the company is in a learning process when offers its packages, as it needs to adapt them country by country. We could classify the segment as a ‘Question Mark’, but we believe Netflix will manage to attract many people by extending and improving its library of contents. We believe Netflix will be the world leader in SVoD services.
Domestic DVD segment is evaluated as ‘Dog’. This segment is the foundation of the firm and it is still generating revenues even if it has been broken down some years ago due to the technology changes in the industry. There are no growth perspectives and the market share for DVDs is completely consumed by streaming services and piracy. Cleary the segment has achieved its break even in the past, as it is experiencing declines in subscriptions year over year.
Figure 14 | BCG Matrix | Source: H. Deepak Analysis
International Streaming Domestic Streaming Domestic DVD
7
CONSOLIDATED FINANCI AL ANALYSISIncome Statement
In 2015, Netflix managed to increase its revenues to USD 6.8b (+23.2%). The improvements were essentially driven by the growth in international activities, in which the company added more than 10 million paid subscribers in the overall base. Revenues could have been higher if the
MRPU was not affected by exchange rate fluctuations. Despite that, their
Domestic Streaming segment also performed well, reporting a growth of 21.8% in revenues and adding 5.7 million paid subscribers (Figure 16). To note that this number represents a slowdown in additions (2014: 6.0 million), however, this was partially offset by an increase in MRPU of 5.8%. Cost of revenues rose 22.3% to USD 4.6b. The costs were mainly driven by the licensing and acquisition of new streaming contents as a result of the company's expansion to Australia, New Zealand, Japan, Spain, Portugal and Italy. Other costs’ details, comprising cost of revenues, such as, streaming delivery expenses (cloud computing costs), equipment costs and customer service and payment processing fees also increased.
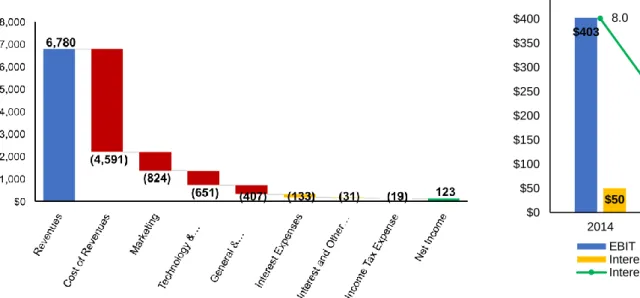
Marketing expenses, seen as a key operating source to attract people, grew by 35.7%, mainly due to advertisements done on the territories launched. General & administrative costs raised 51.0% as a consequence of the implementation of new offices as well as the hiring of new employees. And technology & development, 37.8% (Figure 17). In general, operating costs grew by 39.5% and deteriorated EBIT to USD 305.8m (vs USD 402.6m), a decrease of 2.8 pp. in margin.
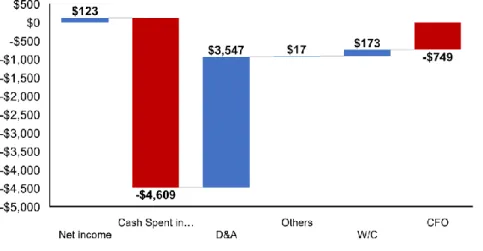
Interests expenses more than doubled deteriorating its interest cover ratio (Figure 18). This is explained by the fact that Netflix issued two long-term senior notes in February 2015 of USD 700.0m and USD 800.0m maturing on 2022 and 2025, respectively. The firm is now committed to pay interests semi-annually on April and October at fixed rates of 5.5% and 5.9%. In the overall, the investments done throughout the year affected the profitability of the company. Due to the expansion, Netflix increased its operating costs and acquired new contents, which triggered to a lower, but still positive, Net Income of USD 122.6m (vs USD 266.8m) (Figures 15).
Figure 16 | Additions per segment in 2014 and 2015 | Numbers in 000’ | Source: Netflix Form 10-K
Figure 17 | Operating costs evolution | Numbers in millions | Source: Netflix Form 10-K
5.986 5.703 7.056 10.660 -1.097 -0.881 -5.000 0.000 5.000 10.000 15.000 20.000 2014 2015 Domestic Streaming International Streaming Domestic DVD
Figure 15 | Income Statement bridge in 2015 |
Numbers in millions | Source: Netflix Form 10-K and H. Deepak Analysis
$403 $306 $50 $133 8.0 2.3 1 2 3 4 5 6 7 8 9 $0 $50 $100 $150 $200 $250 $300 $350 $400 $450 2014 2015 EBIT Interests Expenses Interest Cover Ratio
Figure 18 | Interest cover ratio in 2014 and 2015 | Numbers in millions except for interest cover ratio | Source: Netflix Form 10-K and H. Deepak analysis
-$607 -$472 -$270 -$824 -$651 -$407 -$900 -$800 -$700 -$600 -$500 -$400 -$300 -$200 -$100 $0
Marketing Technology & Development
General & Administrative
2014 2015
8
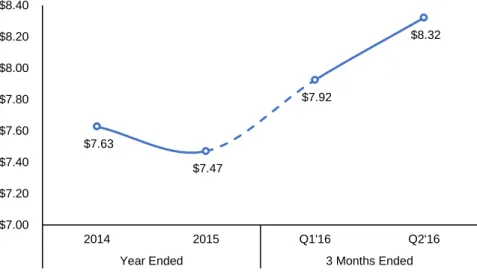
For what the first half of 2016 accounts look like, the company is showing signs of a good performance. Additions during Q1’16 and Q2’16 amounted to 6.7 and 2.0 million people, respectively. A large part of additions was made by its International Streaming segment with 6.5 million new paid subscribers (74.1% of total additions in the first half of 2016) (Figure 20). To note that, the company is reporting higher levels of revenues every quarter. In Q2’16, revenues amounted to USD 2.1b (Figure 22). For this to occur, not only helped additions, but also the positive performance seen in MRPU. Comparing with YE2015, MRPU raised by 11.4% (USD +0.85 cents) at the end of the first half 2016 (Figure 19).
Given the Q2’16 financials, Netflix is showing us signs that its international expansion is starting to pay off. Even with higher amounts expensed in operations (Figure 21), the company is recovering its margin (Figure 22). We highlight the fact that from Q1’16 to Q2’16, the operating margin increased 0.8 pp to 3.3%.
There is still a lot of work to do. The high investments in contents and in licensing must be justified by higher revenues and that will be the key for the success of the company.
Figure 20 | Additions per segment in Q1 and Q2 2016 | Numbers in 000’ | Source: Netflix Q2 earnings
Figure 21 | Operating costs in Q1 and Q2 2016 | Numbers in millions | Source: Netflix Q2 earnings
Figure 22 | Revenues and contribution margin in Q1 and Q2 2016 | Numbers in millions | Source: Netflix Q2 earnings and H. Deepak analysis $7.63 $7.47 $7.92 $8.32 $7.00 $7.20 $7.40 $7.60 $7.80 $8.00 $8.20 $8.40 2014 2015 Q1'16 Q2'16
Year Ended 3 Months Ended
2.313 0.29 4.555 1.899 -1.097 -0.881 -2.000 0.000 2.000 4.000 6.000 8.000 Q1'16 Q2'16 3 M o n th s E n d e d Domestic Streaming International Streaming Domestic DVD (208) (204) (127) (216) (207) (138) (250) (200) (150) (100) (50)
-Marketing Technology & Development
General & Administrative
Q1'16 Q2'16 Figure 19 | MRPU evolution |
Source: Netflix Form 10-K and H. Deepak analysis
$1,958 $2,105 2.5% 3.3% 0.0% 0.5% 1.0% 1.5% 2.0% 2.5% 3.0% 3.5% 4.0% $1,850 $1,900 $1,950 $2,000 $2,050 $2,100 $2,150 Q1'16 Q2'16 3 Months Ended
9
Balance Sheet
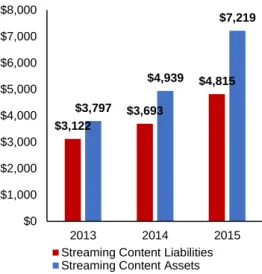
On the Assets side, the main components are contents and cash & cash equivalents, representing 70.8% and 17.7% of total B/S, respectively. To note that of 70.8%, 42.3% corresponds to non-current contents and 28.5% to current contents. As reported in the statuary accounts, they grew 46.1% from USD 4.9b in 2014 to USD 7.2b in 2015, leading to a B/S size increase of 44.9% from USD 7.0b to USD 10.2b in 2015. As aforementioned, this increase is associated with the investments in acquisitions and licensing of streaming content for the countries Netflix expanded during the year. On the Equity & Liabilities side, the main components are the obligations of contents and its long-term debt, representing 47.2% and 23.2% of total B/S, respectively. Every time a title becomes available for streaming, a content liability is recorded on the B/S. Under these circumstances, the recent purchases of contents triggered to an increase of obligations to content and right holders. In 2015, these content liabilities increased by 30.4% from USD 3.7b to USD 4.8b (Figure 24). Equity ratio stood at 21.8%, a decrease of 4.6 pp. due to the lower results for the year. To note that, in the last 5 years, the company managed to keep its Equity weigh nearly 1/5 of the total B/S.
Net Debt
Historically, Netflix has either held more cash & cash equivalents than debt or the reverse situation. In 2014, had a net cash position of USD 227.8m while in 2015 it had a net debt position of USD 562.0m (Figure 24).
► Over the last 4 years, cash & cash equivalents registered an increase of 6.2x from USD 290.3m in 2012 to USD 1.8b in 2015. This substantial increase is a proof of how much cash Netflix can generate. As its International Streaming segment is still giving losses, money came directly from its domestic segments, in which, Domestic Streaming segment contributes the most.
► Netflix’s debt more than doubled in 2015, surpassing the level of
Equity. Its debt-to-equity ratio raised to 106.7% from 47.7% (Figure 28). Following the policy of using debt instead of equity to finance its growth, the company issued two long-term senior notes amounting to USD 700.0m and USD 800.0m. The issuance of these debts led the company to be in a net debt position of USD 562.0m in 2015.
Figure 27 | Debt-to-Equity ratio evolution | Left axis in millions | Source: Netflix Form 10-K and H. Deepak analysis
Figure 23 | Balance sheet composition in 2015 | Source: Netflix Form 10-K and H. Deepak analysis
Figure 25 | Total Content Assets vs Streaming Liabilities | Numbers in millions | Source: Netflix Form 10-K and H. Deepak analysis
(605) (1,114) (1,809) 500 886 2,371 -$ 2,500 -$ 2,000 -$ 1,500 -$ 1,000 -$ 500 $ 0 $ 500 $ 1,000 $ 1,500 $ 2,000 $ 2,500 $ 3,000 2013 2014 2015
Cash & Cash Equivalents Long-term Debt Net Debt vs Net Cash Figure 24 | Net debt vs net cash from 2013 to 2015 |
Numbers in millions | Source: Netflix Form 10-K and H. Deepak analysis
$3,122 $3,693 $4,815 $3,797 $4,939 $7,219 $0 $1,000 $2,000 $3,000 $4,000 $5,000 $6,000 $7,000 $8,000 2013 2014 2015
Streaming Content Liabilities Streaming Content Assets
$4,703 $5,249 $892 $58 $0 $1,000 $2,000 $3,000 $4,000 $5,000 $6,000 62.2% 53.7% 37.5% 47.7% 106.7% 0% 20% 40% 60% 80% 100% 120% 500 1,000 1,500 2,000 2,500 2011 2012 2013 2014 2015 Total Equity
Long-term Debt over Equity Figure 26 | Streaming content liabilities maturities | Numbers in millions | Source: Netflix Form 10-K and H. Deepak analysis
10
Cash Flow Statement
The lower Net Income in 2015 coupled with a higher amount of cash spent in contents led to a negative Cash Flow from Operations. The substantial increase in cash spent in contents from USD 3.2b in 2014 to USD 4.6b in 2015 (+44.9%) was a direct consequence of the company’s expansion. Focused in offering the best packages for each country the company entered during the year, Netflix had to acquire contents and licensing’s locally accepted even though it had the possibility to operate with its awarded original contents.
Despite the higher level of cash spent on contents, the company improved its working capital in 2015. To note that, the company does not have receivables neither inventories due to its business model. As they are an all cash company, Netflix collects its monthly subscription fees by charging the subscribers every month on the sign-up date. As per the inventory, Netflix has a “library of contents”, in which contains DVD and streaming contents. The company classifies DVD contents as non-current content assets. The reason DVD is labeled as non-current is based on the estimated time the asset will be used. For streaming contents, the portion available for streaming within one year is recognized as current content assets and the remaining portion as non-current content assets.
Working capital has been steadily improving since 2012 (Figure 29). However, its Cash Flow from Operations was negative reflecting the heavy acquisitions made in streaming contents, which amounted to USD 4.6b and corresponds to nearly 70% of revenues. International expansion is bringing risks to the company as it is consuming a big part of its cash (Figure 30).
To worsen the situation, the company’s Cash Flow from Investments suffered a decrease of USD 136.3m due to lower sales of short-term investments. These factors together lead the company to issue more debt. Cash Flow from Financing tripled due to the issuance of USD 1.5b in senior notes. At the end, Net Change in Cash stood at USD 695.7m, an increase of USD 186.6m in comparison with 2014 (Figure 28).
For what the first half of 2016 cash flow figures look like, the company is showing that the investments done in the countries expanded in 2015 are starting to pay off and generate cash. Cash spent in contents continued to increase quarter by quarter as the company adapts its packages country by country. Despite the higher content expenses, the company ended Q2’16 with a positive Net Change in Cash of USD 1.3b (Figure 31).
43 (9) 19 18 84 52 2 56 49 46 59 72 (9) (52) (18) 101 137 173 -$100 -$50 $0 $50 $100 $150 $200 $250 2013 2014 2015
Other Non-Current Assets & Liabilities Deferred Revenue
Accrued Expenses Accounts Payable Other Current Assets Working Capital
Figure 30 | Cash flow bridge in 2015 |
Numbers in millions | Source: Netflix Form 10-K and H. Deepak analysis
Figure 29 | Working capital development | Numbers in millions | Source: H. Deepak analysis
Figure 31 | Cash flows in Q1’16 and Q2’16 | Numbers in millions | Source: Netflix Form 10-K, Q2 earnings and H. Deepak analysis
98 17 (749) (256) (43) (179) 476 542 1,640 315 509.1 695.7 -$1,500 -$1,000 -$500 $0 $500 $1,000 $1,500 $2,000 2013 2014 2015
Cash Flow from Financing Activities Cash Flow from Investing Activities Cash Flow from Operating Activities Net Change in Cash & Cash Equivalents
Figure 28 | Summary of the cash flows in the last 3 years | Numbers in millions | Source: Netflix Form 10-K and H. Deepak analysis
1,182 1,327 4 (3) 15 18 1,207 1,339 -$200 $0 $200 $400 $600 $800 $1,000 $1,200 $1,400 $1,600 Q1'16 Q2'16 3 Months Ended
Cash Flow from Financing Activities Cash Flow from Investing Activities Cash Flow from Operating Activities Net Change in Cash & Cash Equivalents
11
INDUSTRY OUTLOOKNot long ago, “watching TV” meant sitting in front of the screen in our living room, waiting for the favorite program to come up at a scheduled time. Today, traditional TV providers such as, cable, satellite and telecommunications are threatened by the rise of online TV, creating extensive options for consumers and changing our viewing habits. The appearance of online TVs is conducting people to watch video-on-demand - VoD - programming rather than scheduled and live TV. This type of programming is mostly offered through the internet instead of through traditional set-top boxes. Often referred as Over-the-Top Television –
OTT TV, people get access to these types of programming via subscription
with online VoD providers. Once the subscription is done, we download the content we want and start watching it.
Many industries have gone through a digital transformation process. Music, travel and retail are some of the industries that were reshaped by the internet. Some other industries are preparing for what is coming, just like the TV industry. OTT TV is the digital turning point for the TV industry.
TRADITIONAL TV VS OTT TV – PEOPLE’S BEHAVIOR
The impact of OTT TVs is not limited to the way we watch TV, but yet related to whether or not it changes our viewing habits. 2015 was the first year many traditional TV providers faced a decline in its subscriber’s base.
OTT TV is making people to cut the cord and realize the advantages it
delivers. It is a sign that VoD is transforming the way we watch TV. So, what truly make people prefer OTT TV over traditional TV? The Nielsen’s Global Video-on-Demand Survey pooled over 30,000 online respondents across 61 countries answers this question (Figure 34 & 35):
1. As expected, convenience is appointed by the respondents to be the most important factor to watch VoD. Among those who watch VoD, 77% say that they do because they can watch the content at a time that is convenient for them.
2. The connectivity and mobility that allows multiple people watch different programs on different devices at the same time is another reason pointed out by 66% of the respondents.
3. The possibility of watching several episodes in a row, known as binge-watching, is considered by 66% of the respondents a fundamental feature and a tremendous motivator to have VoD. People recognize this added value in comparison with traditional TV and some of them even use this way as a primary method to watch TV.
4. Finally, when it comes to pricing, people are sensitive and so they are when they compare the reduced price VoD offers over traditional TV providers. 60% say that watching programs through OTT TV services is less expensive than watching through cable or satellite.
Not just talking about the benefits of VoD, 72% say that they would like to have more program choices available and 67% indicated that watching
VoD programs on an online or mobile device is not as good as watching it
on a bigger screen. We believe, as well, that the internet coverage is somewhat affecting people to access VoD. In rural areas, the internet speed is not as fast as urban areas and given the high internet speed requirement by VoD services to download contents, we consider the low internet coverage in rural areas an issue to consumers watch VoD.
Figure 32 | TV connections | Source: H. Deepak Analysis
Figure 33 | OTT options |
Source: H. Deepak Analysis
Figure 34 | OTT TV drivers |
Source: Nielsen Global Video on Demand Report, March 2016
“OTT TV also provides contents passed on the traditional TV. To battle against the rise of such online providers, traditional TV operators
created the TVE service – TV Everywhere –
accessible online.”
Please see below for more details.
TV Traditional TV Cable Satellite Telecom Over-the-Top TV Internet OTT TV Video-on-Demand Live / Scheduled Content 72% 67% More choices available Better to watch on a bigger screen
Figure 35 | OTT TV inconvenient |
Source: Nielsen Global Video on Demand Report, March 2016 77% 66% 66% 60% Convenience Connectivity and Mobility Binge-Watching Reduced Price
12
REPLACE OR SUPPLEMEN T?It is important to note that many traditional TV companies include these
VoD programming in its packages through partnerships. VoD could also
be downloaded or streamed over traditional TV. Given this, the question that arises is to understand whether people replace or supplement VoD services to its cable/satellite TV packages. Let’s see.
Following Nielsen’s Global Video-on-Demand Survey, while 26% of viewers say they pay to watch VoD programs via subscription to an online service provider, 72% say they pay to watch it via a traditional TV connection (Figure 36). At a first glance, we note that it is acting more as a supplement than a replacer.
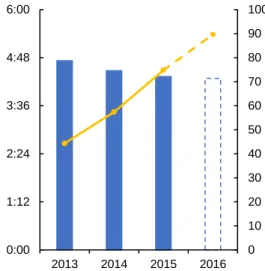
However, in US, traditional TV watching time per day has been decreasing since 2013 (Figure 37). At the same time, we saw an extraordinary increase in some OTT TVs subscribers’ base, in particular, Netflix. Does this mean OTT TV is moving to the center stage and winning audiences against traditional TVs? A realistic way to assess this issue is to analyze the time spent per day watching TV across the population by group ages. Let’s call: Generation Z to people from 15 to 20 years old, Millennials from 21 to 34, Generation X between 35 and 49, Baby Boomers in a range of 50-64 and Silent Generation from 65 onwards.
Nielsen’s Global Video-on-Demand report revealed that older viewers watch more traditional TV. Generation Z and Millennials watch less linear TV (Figure 38). This means that long-term prospects for VoD players are in a good way. Roughly 40% of Generation Z and 38% of Millennials who are consumers of cable or satellite services say they plan to cut the cord in favor of an online service provider – a rate that is approximately 3 times higher than Baby Boomers and 4 times higher than Silent Generation (Figure 39). If at the beginning, we said that VoD services were supplementing traditional TV, here, we consider it will be a replacer
considering the long-term prospects it will have. Backed by its young generation, these people will become fathers and mothers one day, and as it is usually said “children learn from family”, certainly their kids will learn watching TV through OTT TVs and will never know what really “watching TV” through traditional TV connection was. In fact, in 2015, Millennials became the largest group age in US, surpassing Baby Boomers. This is a clear signal that younger viewers are changing the rules. Could we assume that the end of the traditional TV might be nigh?
Figure 39 | Percentage of cable / satellite subscribers who plan to cancel its service in favor of an online service | Source: Nielsen Global Video on Demand Report, March 2016
Figure 36 | How do people watch VoD? | Source: Nielsen Global Video on Demand Report, March 2016 70% 73% 77% 64% 63% 31% 31% 24% 15% 6% 5% 5% 4% 4% 2% Generation Z Millennials Generation X Baby Boomers Silent Generation
Cable and/or Satellite Online Service Other
Figure 38 | Percentage of respondents who currently pay providers for programming | Source: Nielsen Global Video on Demand Report, March 2016
70% 73% 77% 64% 63% 40% 38% 30% 15% 9% Generation Z Millennials Generation X Baby Boomers Silent Generation
Cable and/or Satellite
Plan to cancel cable/satellite in favor of a online service
Figure 37 | Average live TV watching per year vs Netflix’s streaming subscribers per year | Left axis in time & right axis in millions | Source: Nielsen Audience reports and Netflix’s Form 10-K
26% 72% 0% 10% 20% 30% 40% 50% 60% 70% 80% Via Subscription to an Online service Via Traditional TV service 0 10 20 30 40 50 60 70 80 90 100 0:00 1:12 2:24 3:36 4:48 6:00 2013 2014 2015 2016
13
W HAT IS TRADITIONAL TV DOING TO FIGHT FO R ITSFUTURE?
TV Everywhere
To fight against the rising of OTT TVs, traditional TV companies started to play on the same ground as them. Many linear TV companies created an online platform, known as TV Everywhere - TVE. This service is complementary to the regular TV and allows viewers to stream TV content (generally live TV, catch up TV and some VoD) over the internet (same process as OTT TVs). The expectations generated around TVE were very high, but the truth is TVE has not reached yet enough potential to battle face-to-face against OTT TVs. Therefore, traditional TV providers are working in the improvement and personalization of TVE platforms, at the same time, willing to raise further awareness and usage.
Partnerships, Merges & Acquisitions
We aforementioned that many regular TV providers include VoD services in their package options through partnerships. In fact, even if traditional providers control two important utilities for most of the households, television and internet, they assume that is almost impossible to fight and win against them. TVE is the perfect example of it. It was not sufficient to captive people.
To bypass and gain some leverage, traditional TV providers started to make deals with OTT competitors. “If you can’t beat them, join them”. Partnerships, merges and acquisitions are expected in the next few years leading to a massive consolidation in the TV industry (Figure 41). Not standing aside, some traditional TV operators are starting to reevaluate its business models, setting-up teams to create VoD platforms. Over the next years, we can expect, as well, a huge number of entrants on the TV industry, offering an incredible number of VoD options and increasing competition.
Table 8 | OTT TV offerings: Previous and releases |
Source: Google.com
2014 2015 2016
Live Content
One clear advantage for traditional TV providers is that there are no substitutes for live content, such as, news and sports. The only reason people stick with traditional TV it’s because it airs live. In our view, we think that this important feature will be the key to boost partnerships and merges with the exchange of live content with VoD options.
Can we expect OTT players to air live? We don’t know yet, but some of them are interested.
Figure 42 | Live airing | Source: Netflix Media Center Figure 40 | TVEverywhere players | Source: Google.com
Figure 41 | Consolidation of power | Source: Google.com
14
Advertisement
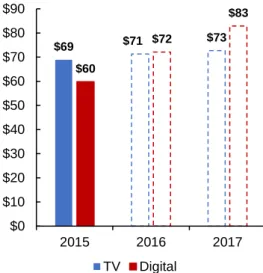
Putting traditional TV operators and OTT TVs together will appeal not only audiences worldwide, but also advertisers. Advertisement companies follow audiences. So, what will happen to ads with the appearance of OTT TVs? 2016 could be the first-year US digital ad spend surpasses TV ad spend, according to eMarketer.com estimates, indicating what was previously said - advertisers are moving together with viewers to VoD platforms.
It is a fact that many viewers do not like to waste their time watching ads, giving reasons to ad companies to be afraid. Nielsen’s Video-on-Demand report shows that 62% of the respondents who watch VoD say that online ads are distracting and 65% say they wish they could block or avoid all the ads. The numbers disclose that ad companies must do something to survive in its future, but what? Are they stuck? Will we see the end of ad in line with the possible end of traditional TVs?
The good news for advertisers is that many consumers value ads, but most of them consider it irrelevant. While 51% strongly agree that ads in
VoD content give them good ideas for new products, 59% say they do not
mind watch ads if they can view VoD for free. Given the numbers, there are two facts ad companies should focus around:
1. First, create more relevant ads that speak directly to consumers because 66% say that most ads in VoD content are for products they do not want.
2. And second, discover new ways to advertise, because what is happening, basically, is people paying to avoid ads.
$69 $71 $73 $60 $72 $83 $0 $10 $20 $30 $40 $50 $60 $70 $80 $90 2015 2016 2017 TV Digital
Figure 43 | US TV vs Digital Ad Spending | Numbers in billions | Source: eMarketer.com
62%
65% Online ads are
distracting
Block or avoid ads
Figure 45 | Unfavorable reasons related with ads | Source: Nielsen Global Video on Demand Report, March 2016
51%
59%
Ads give them good ideas for new products
I don't mind watch ads if I can view it for free
Figure 44 | Favorable reasons related with ads |
15
W HY DO PEOPLE LIKE NETFL IX?Netflix is an example of an OTT TV. The company launched its VoD service in 2007 in US and since then has been broken all the limits. What do they do to be so successful?
The key to its success is the service offered to subscribers:
1. First of all, and for us the most important factor, is related with the content it offers. Quantity and quality of contents are two features Netflix does not give away to captive people. It makes difference when viewers decide in which
VoD platform to subscribe. In US, Netflix has around 9,000 titles and in countries within their operations, they exceed
2,000 titles for each country. Moreover, some of the TV series Netflix offers are exclusively available on its platform, making it more appealing for consumers. Despite having exclusive contents, Netflix is also known as a content producer. With originals like “The House of Cards” and “Orange is The New Black” produced, the company has already wonEmmy Awards and a good reputation among the consumers. In addition, having the library of contents always up-to-date makes the service more attractive.
2. Secondly, Netflix’s platform is dynamic, easy and well designed, allowing viewers to ease its navigation. The platform also guides viewers to certain contents with its recommendation tool, refreshing them with new entries and signaling trending contents.
3. Thirdly, the internet neutrality rules in US and in Europe prohibit Internet Service Providers – ISP, to demand for compensations regarding the amount of traffic web publishers generate through its ISP’s network, allowing Netflix and other internet TV companies to offer a competitive price to its subscribers compared, per example, with a traditional TV provider offering a similar VoD service. This free ride on the internet makes Netflix’s service one of the cheapest in the market of OTT TVs.
4. OTT TV enables the collection of detailed viewer data, given the possibility of precisely track what has been viewed by consumers. These detailed information Netflix and other companies collect, allows them to better estimate the audience size when, per example, a new content is to be produced. On the other side, showing this data to content holders gives them a competitive advantage in relation to traditional TV operators, since they are not able to collect such detailed data themselves. In this regard, OTT TVs have got the gold in his hands to convince content owners to license.
5. And finally, Netflix is ad-free. We aforementioned that 65% of the people who watch VoD wish they could block or avoid ads. That’s right, being an ad-free service, makes these people feel in heaven.
Of course, at the end, all these features together enhance fidelity and confidence among the subscribers. The achievements Netflix has been reaching along the way are not just linked to the features pointed out above. Like all the other successful companies, Netflix had its luck. Initially, several content owners underestimated the potential of VoD services, licensing contents at a “low-cost” price. As a consequence, the company could provide appealing contents with a modest monthly subscription price and quickly captive an extraordinary number of subscribers.
Figure 46 | Netflix success factors |
Source: PwC Outlook Special on Over-the-Top Television and H. Deepak analysis
Content • High quality • Recent & Exclusive • Original series awarded Functionality
• Easy & Dynamic • Recommendation
tool
• Tracking across devies
Price
• Low pricing policy • Price below
similar SVoD services
Service
• Ad-free service • Ideal for people
looking to avoid ads
Big Data
• More and more detailed viewer data
• Better content acquistion and timing decisions