ACPD
15, 1523–1571, 2015The climatology of dust aerosol over the
arabian peninsula
A. Shalaby et al.
Title Page
Abstract Introduction
Conclusions References
Tables Figures
◭ ◮
◭ ◮
Back Close
Full Screen / Esc
Printer-friendly Version Interactive Discussion
Discussion
P
a
per
|
Discussion
P
a
per
|
Discussion
P
a
per
|
Discussion
P
a
per
|
Atmos. Chem. Phys. Discuss., 15, 1523–1571, 2015 www.atmos-chem-phys-discuss.net/15/1523/2015/ doi:10.5194/acpd-15-1523-2015
© Author(s) 2015. CC Attribution 3.0 License.
This discussion paper is/has been under review for the journal Atmospheric Chemistry and Physics (ACP). Please refer to the corresponding final paper in ACP if available.
The climatology of dust aerosol over the
arabian peninsula
A. Shalaby1, B. Rappenglueck2, and E. A. B. Eltahir3
1
The International Centre for Theoretical Physics, Trieste, Italy
2
Department of Earth and Atmospheric Sciences, University of Houston, Texas 77004, USA
3
Massachusetts Institute of Technology, Cambridge, Massachusetts, USA
Received: 25 September 2014 – Accepted: 19 December 2014 – Published: 19 January 2015
Correspondence to: A. Shalaby ([email protected])
ACPD
15, 1523–1571, 2015The climatology of dust aerosol over the
arabian peninsula
A. Shalaby et al.
Title Page
Abstract Introduction
Conclusions References
Tables Figures
◭ ◮
◭ ◮
Back Close
Full Screen / Esc
Printer-friendly Version Interactive Discussion
Discussion
P
a
per
|
Discussion
P
a
per
|
Discussion
P
a
per
|
Discussion
P
a
per
Abstract
Dust storms are considered to be a natural hazard over the Arabian Peninsula, since they occur all year round with maximum intensity and frequency in Spring and Summer. The Regional Climate Model version 4 (RegCM4) has been used to study the climatol-ogy of atmospheric dust over the Arabian Peninsula from 1999 to 2012. This relatively
5
long simulation period samples the meteorological conditions that determine the cli-matology of mineral dust aerosols over the Arabian Peninsula. The modeled Aerosol Optical Depth (AOD) has been compared against ground-based observations of three Aerosol Robotic Network (AERONET) stations that are distributed over the Arabian Peninsula and daily space based observations from the Multi-angle Imaging
Spec-10
troRadiometer (MISR), the Moderate resolution Imaging SpectroRadimeter (MODIS) and Ozone Monitoring Instrument (OMI). The large scale atmospheric circulation and the land surface response that lead to dust uplifting have been analyzed. While the modeled AOD shows that the dust season extends from March to August with two pro-nounced maxima, one over the northern Arabian Peninsula in March with AOD equal to
15
0.4 and one over the southern Arabian Peninsula in July with AOD equal to 0.7, the ob-servations show that the dust season extends from April to August with two pronounced maxima, one over the northern Arabian Peninsula in April with AOD equal to 0.5 and one over the southern Arabian Peninsula in July with AOD equal to 0.5. In spring a high pressure dominates the Arabian Peninsula and is responsible for advecting dust from
20
southern and western part of the Arabian Peninsula to northern and eastern part of the Peninsula. Also, fast developed cyclones in northern Arabian Peninsula are responsi-ble for producing strong dust storms over Iraq and Kuwait. However, in summer the main driver of the surface dust emission is the strong northerly wind (“Shamal”) that transport dust from the northern Arabian Peninsula toward south parallel to the
Ara-25
ACPD
15, 1523–1571, 2015The climatology of dust aerosol over the
arabian peninsula
A. Shalaby et al.
Title Page
Abstract Introduction
Conclusions References
Tables Figures
◭ ◮
◭ ◮
Back Close
Full Screen / Esc
Printer-friendly Version Interactive Discussion
Discussion
P
a
per
|
Discussion
P
a
per
|
Discussion
P
a
per
|
Discussion
P
a
per
|
modeled TOARF and BOARF are−3.3 and−12 W m−2, respectively. However, the
an-nual observed TOARF and BOARF are significantly different at−10 and −52 W m−2,
respectively. The analysis of observed and modeled TOARF agrees with previous stud-ies in highlighting the need for more accurate specification of surface albedo over the region. Due to the high surface albedo of the central Arabian Peninsula, mineral dust
5
aerosols tend to warm the atmosphere in summer (June–August).
1 Introduction
Atmospheric mineral dust is a natural aerosol and is ubiquitous in the Earth’s atmo-sphere, despite that it is emitted from hyper-arid, arid and semi-arid regions on the globe. About 2000 Mt is emitted annually to the atmosphere, 1500 Mt is deposited to
10
the land and 500 Mt is deposited onto the ocean surface (Shao et al., 2011). It affects radiation by absorption and scattering that in turn affects surface and atmospheric tem-perature, also it acts as ice cloud condensation nuclei (ICCN) that impacts the micro-physics of the clouds and its radiative properties (IPCC, 2013). The transported dust also carries nutrients and bacteria, which may affect the marine life and land surface
15
life. For instance, 20 Mt of nutrients rich Saharan dust is transported to the Amazon basin in South America each year (Koren et al., 2006). Atmospheric mineral dust, es-pecially fine dust (smaller than 2.5 µm) may cause cardiopulmonary disease and lung cancer (Giannadaki et al., 2014). It also affects many of human activities like aviation, real estate construction, agriculture, and water resource management (Stefanski and
20
Sivakumar, 2009).
Dust particles are emitted from major deserts on the globe (e.g., Sahara, the Ara-bian Peninsula, Taklamakan and Gobi deserts in China, Australia deserts and Atacama desert in Chile). The mineral dust emission processes (i.e., saltation and sandblasting) are determined by meteorological conditions (e.g., atmospheric instability, soil
mois-25
ACPD
15, 1523–1571, 2015The climatology of dust aerosol over the
arabian peninsula
A. Shalaby et al.
Title Page
Abstract Introduction
Conclusions References
Tables Figures
◭ ◮
◭ ◮
Back Close
Full Screen / Esc
Printer-friendly Version Interactive Discussion
Discussion
P
a
per
|
Discussion
P
a
per
|
Discussion
P
a
per
|
Discussion
P
a
per
Gobbi et al., 2004). Depending on dust particle size and atmospheric conditions dust particles may remain airborne between 1.5 to 7.4 days and will then deposit to the surface by gravitational settling or rain washout (Shao et al., 2011).
This paper focuses on atmospheric mineral dust over the Arabian Peninsula, a re-gion, which has been less studied over the last decades compared to Saharan regions.
5
In an early study Wilkerson (1991) described the onset and evolution of dust storms over Iraq and Kuwait analyzing satellite images and visbility records. Wilkerson’s study categorized the types of dust storms as pre-frontal, post-frontal and Shamal types, the latter being a regional northwesterly wind that typically occurs in summer (“Shamal” denotes “northerly wind” in Arabic). Mashat et al. (2008) used meteorological
obser-10
vations from Saudi Arabia to analyze the meteorological conditions which favored dust storms and their spatial and seasonal distribution. They found that dust storms most frequently occur in the eastern part of the Arabian Peninsula in spring and extend towards the southern part of the Arabian Peninsula in summer. Alharbi (2009) and Al-harbi et al. (2013) explored dust storms generation over the Arabian Peninsula, dust
15
source regions and atmospheric conditions that promote dust storms, which include large-scale atmospheric instability, high surface winds, and dry, rich dust sources. The quantification and characterization of mineral dust aerosol (e.g., dust concentrations profile and mineral dust optical properties) became possible after the installation of TheAErosolROboticNETwork (AERONET) in Bahrain and Saudi Arabia around 1998.
20
Smirnov et al. (2002) used a one year data record (July 1998–July 1999) of the Bahrain site in the Arabian Gulf to deduce the climatology of aerosol optical properties (i.e., the Aerosol Optical Depth (AOD) and the Ångström parameter). In 2004 an intensive mea-surement campaign was held in the United Arab Emirates (UAE), which led to the installation of various AERONET stations. Among them only the Mezaira site is fully
25
behav-ACPD
15, 1523–1571, 2015The climatology of dust aerosol over the
arabian peninsula
A. Shalaby et al.
Title Page
Abstract Introduction
Conclusions References
Tables Figures
◭ ◮
◭ ◮
Back Close
Full Screen / Esc
Printer-friendly Version Interactive Discussion
Discussion
P
a
per
|
Discussion
P
a
per
|
Discussion
P
a
per
|
Discussion
P
a
per
|
ior of mineral dust aerosol optical properties in these regions. This study showed that the Arabian Peninsula dust is more absorbing in the shortwave range than the Saharan dust does. García et al. (2012) analyzed most of the AERONET stations on the globe including the Arabian Peninsula and found that atmospheric aerosols over high surface albedo regions, as deserts, lead to a warming of the Earth’s atmosphere.
5
Using a regional climate model offers the advantage to investigate meso-scale phe-nomena such as surface dust emission processes, transportation, deposition and its radiative impact on the regional climate at a higher spatial resolution (e.g., ≤50 km)
than global models with coarse spatial resolution (e.g.,≥100 km). The Regional Cli-mate Model Version 3 (RegCM3) (Pal et al., 2007) and RegCM4 (Giorgi et al., 2012)
10
have been used to investigate mineral dust aerosols and its radiative impact on regions in North and West Africa (Zakey et al., 2006; Solmon, 2008; Konarè et al., 2008; Na-pat et al., 2012; Steiner et al., 2014), but studies on the Middle East area are rare. Marcella and Eltahir (2010, 2011) used RegCM3 for the first time over the Northern Arabian Peninsula, to explore the impact of dust on climate and found that the
im-15
plementation of subgrid wind variability and dust aerosol lateral boundary conditions could enhance the dust simulation. Nazrul Islam and Almazroui (2012) used RegCM4, showed that the direct radiative effect of mineral dust results in a decrease of surface temperature and increase in precipitation over the Arabian Peninsula in the wet season (November–April).
20
The first objective of this study is to define and identify the dust season by means of available observations (e.g. through AERONET and satellite data bases) and regional climate modeling. As the uncertainties of aerosol radiative forcing are large (IPCC, 2013), more investigation on the sources of such uncertainties, especially on regional scales, is needed. Thus, the second objective of this study is to estimate the Bottom Of
25
ACPD
15, 1523–1571, 2015The climatology of dust aerosol over the
arabian peninsula
A. Shalaby et al.
Title Page
Abstract Introduction
Conclusions References
Tables Figures
◭ ◮
◭ ◮
Back Close
Full Screen / Esc
Printer-friendly Version Interactive Discussion
Discussion
P
a
per
|
Discussion
P
a
per
|
Discussion
P
a
per
|
Discussion
P
a
per
2 Methods
2.1 Observational datasets
The observation of atmospheric dust from space has become very vital to the under-standing of this phenomenon. Space-borne observations provide global information of the spatial distribution (horizontal and vertical) and the temporal evolution of the
5
Aerosol Optical Depth (AOD). However, comparison of modeled dust (AOD) with satel-lite measurements may be problematic, since satelsatel-lite observations apply assumptions about the nature of the aerosol, which is different from approaches in numerical mod-els (Woodward, 2001). On the other hand, ground-based observation is needed to provide more details of atmospheric dust characteristics such as high frequency
mea-10
surements of near ground concentration (e.g., PM10) and AOD. Also ground-based measurements include physical and chemical analysis of aerosols, such as its geo-metrical shape, size distribution and chemical composition. The ground-based mea-surements are also used to validate the space-borne observations. For instance, the AOD from AERONET stations has been used to validate satellite AOD products
(Mar-15
tonchik et al., 2004; Abdou et al., 2005). In the following subsections we will briefly discuss the characteristics of AERONET and satellite datasets.
2.1.1 AERONET
The AErosol ROboticNETwork (AERONET) provides valuable measurements of at-mospheric aerosol optical properties. AERONET stations comprise an automatic sun
20
photometer. It has its own algorithm to evaluate data quality and instrument functional-ity. AERONET measures AOD for different wavelengths, from near IR (1064 nm) to near UV (340 nm). AERONET sunphotometer provides information about aerosol size distri-bution, aerosol radiative forcing, and aerosol shape (spherical/non-spherical). Detailed description of the instrument and its function can be found in Holben et al. (1998).
ACPD
15, 1523–1571, 2015The climatology of dust aerosol over the
arabian peninsula
A. Shalaby et al.
Title Page
Abstract Introduction
Conclusions References
Tables Figures
◭ ◮
◭ ◮
Back Close
Full Screen / Esc
Printer-friendly Version Interactive Discussion
Discussion
P
a
per
|
Discussion
P
a
per
|
Discussion
P
a
per
|
Discussion
P
a
per
|
The measurements pass multilevel quality assurance (QA): level 1 without cloud screening, level 1.5 has cloud screened but may be without final calibration. Level 2 has cloud screened and quality assured calibrations. The AOD accuracy of calibrated AERONET station is wavelength dependent and varies from root mean square error of±0.012 (UV band) to root mean square error of±0.006 (IR band) at overhead sun 5
(airmass=1) (Schmid et al., 1999).
The AERONET stations are widely used over the globe. However there are only few AERONET stations in the Arabian Peninsula with relatively long measurement records. Among them is the Solar-Village station in Saudi Arabia, the Kuwait University station in Kuwait and the Mezaira site in the United Arab Emirates (UAE). For detailed information
10
about the site and their locations see Table 1 and Fig. 1.
Each station has its unique features; the Kuwait station is downwind of major dust sources in Southern Iraq. Solar-Village is located in the center of Saudi Arabia and it is at a relatively high altitude (764 m a.s.l.) compared to other sites, which could reflect the transportation of dust to high altitudes. Mezaira in United Arab Emirate (UAE) is inland
15
site and could be considered a receptor site for dust coming from southern Arabian Peninsula.
2.1.2 MISR
Most satellite instruments looks down to the earth (0 degrees Nadir angle), or toward the edge of the planet and receive the reflected sunlight. The Earth’s surface, clouds
20
and aerosols reflect sunlight in different direction, which requires an instrument that accounts for such different reflected angle. The Multiangle Imaging Spectroradiometer (MISR) is a unique instrument flown in the space since late 1998. It has nine cameras corresponding to nine view angles, the middle one pointing toward the nadir, four of them in a forward direction with (26.1, 45.6, 60.0 and 70.0◦
, respectively) relative to the
25
nadir camera and the other four in the rearward direction with (−26.1, −45.6, −60.0
and −70.0◦ respectively). Each direction measures four individual wavelength (443,
ACPD
15, 1523–1571, 2015The climatology of dust aerosol over the
arabian peninsula
A. Shalaby et al.
Title Page
Abstract Introduction
Conclusions References
Tables Figures
◭ ◮
◭ ◮
Back Close
Full Screen / Esc
Printer-friendly Version Interactive Discussion
Discussion
P
a
per
|
Discussion
P
a
per
|
Discussion
P
a
per
|
Discussion
P
a
per
has been used in many fields including studies on, clouds (Marchand et al., 2010), aerosols (Martonchik et al., 2004; Abdou et al., 2005; Marey et al., 2011) and Earth surface (Pinty et al., 2011). For our purpose, we will focus on the aerosol facilities of MISR. The MISR global aerosol retrieval is used to obtain AOD values to characterize the types of aerosol based on their physical and optical properties, and aerosol particle
5
shape (spherical or non-spherical). The aerosol retrieval algorithm strategy has many steps. First, it utilizes a lookup table that contains a suite of a natural aerosol types and calculated aerosol optical properties by a radiative transfer model. Second, the retrieval of the aerosol over dark surfaces like the ocean depends on red and near infrared (IR) channels (Martonchik et al.,1998). The most difficult retrieval is above bright surface
10
like deserts. This latter retrieval needs special treatment and is therefore associated with large uncertainties (Diner, 1998; Martonchik, 1998; Abdou et al., 2005).
In this work we concentrate only on the MISR AOD dataset and its comparison with the model output. The MISR data used in our study spans 6 years from 2006 to 2012. The data resolution is 0.5◦
×0.5◦. Data has been retrieved from the Giovanni website 15
(http://Giovanni.gsfc.nasa.gov/giovanni).
2.1.3 MODIS (Deepblue)
The Moderate Resolution Imaging Spectroradiometer (MODIS) instrument is aboard the NASA EOS (Earth Observing System) Terra and Aqua satellites and began trans-mitting date in 2000. The instruments have high spatial resolution (10 km
resolu-20
tion) and almost global coverage. Like MISR, MODIS aerosol retrievals are based on a lookup table procedure in which the satellite measured radiances are matched to pre-calculated values in the lookup table. The values of the aerosol properties used to create the calculated radiances are retrieved (Remer et al., 2005; Abdou et al., 2005). The MODIS data set spans from January 2008 to December 2011. Data has been
25
ACPD
15, 1523–1571, 2015The climatology of dust aerosol over the
arabian peninsula
A. Shalaby et al.
Title Page
Abstract Introduction
Conclusions References
Tables Figures
◭ ◮
◭ ◮
Back Close
Full Screen / Esc
Printer-friendly Version Interactive Discussion
Discussion
P
a
per
|
Discussion
P
a
per
|
Discussion
P
a
per
|
Discussion
P
a
per
|
2.1.4 OMI
The Ozone Monitoring Instrument (OMI) has been orbiting the Earth on one of the EOS mission “Aura spacecraft” since July 2004. OMI is a high spatial resolution (13 km×
24 km) ground pixel size ultraviolet/visible (UV/VIS) backscatter spectrometer (Levelt et al., 2006). The OMI aerosol retrieval algorithm is the same as for the Total Ozone
5
Mapping spectrometer (TOMS) near-UV method of aerosol absorption sensing from space (Torres et al., 2005). The accuracy of the OMI retrieval of aerosol optical depth is around 30 % relative to AERONET measurements (Torres et al., 2005).
The extinction AOD at 500 nm (near-UV) has been selected from the OMI product from Giovanni site portal (http://Giovanni.gsfc.nasa.gov/giovanni). From that data we
10
selected 2◦×2◦ box around the three AERONET stations (see Fig. 1) for comparison
purposes with the observations. The time span of this data is from January 2008 to December 2011.
2.2 Model description and experimental design
2.2.1 General model description 15
The International Centre for Theoretical Physics (ICTP) Regional Climate Model (RegCM) was built upon the National Center for Atmospheric Research (NCAR) Mesoscale Model version 4 (MM4) (Giorgi and Bates, 1989; Giorgi et al., 1993a, b).
The Regional Climate Model version 4 (RegCM4) is the second major development of the RegCM core after RegCM3 (Pal et al., 2007). The coding structure is completely
20
changed. It has become totally FORTRAN 90 compliant and modular structured and its parallelization and memory management has become more efficient. The RegCM4 has more physics options, which include the Community Land surface Model (CLM3.5) land surface parameterization, the Tiedtke convection scheme, the University of Washington (UW) planetary boundary layer (PBL) scheme, and the Rapid Radiative Transfer Model
25
ACPD
15, 1523–1571, 2015The climatology of dust aerosol over the
arabian peninsula
A. Shalaby et al.
Title Page
Abstract Introduction
Conclusions References
Tables Figures
◭ ◮
◭ ◮
Back Close
Full Screen / Esc
Printer-friendly Version Interactive Discussion
Discussion
P
a
per
|
Discussion
P
a
per
|
Discussion
P
a
per
|
Discussion
P
a
per
RegCM4 is an online climate-chemistry model and has an online gas-phase chem-istry scheme (CBMZ) (Shalaby et al., 2012). It has various aerosol components such as, four size bin dust, two size bin sea salt, sulphate, black carbon and organic carbon. Sulphate, black carbon and organic carbon (Solmon et al., 2006), as well as dust and sea-salt are radiatively active (Zakey et al., 2006, 2008).
5
2.2.2 Dust parameterization
Sand particles are affected by many forces that determine their fate. Dust particles have three dynamic modes: (a) saltation: small particles move by jumping like leap-frog, Once lifted by wind it will drift downwind and return to hit the ground again and transfer energy and momentum to other soil aggregates (soil particles). (b) Creeping: large
10
dust particles cannot be lifted into the air, but will just move and slide on the ground. (c) Suspension: if the upward draft is strong enough to compensate the gravitational force of the dust particles, dust will remain airborne and be transported by the wind over longer distances until its gravitational force overcome the uplifting force. It is believed that saltation is the main mechanism for surface dust emission (Shao et al., 1993;
15
Marticorena and Bergametti, 1995).
Following Marticorena and Bergametti (1995) and Alfaro and Gomes (2001), a com-plex dust emission scheme has been implemented in RegCM3 (Zakey et al., 2006). This emission scheme is based on parameterization of soil aggregate saltation and sandblasting processes. According to this scheme, a critical parameter for the dust
20
saltation process is the threshold friction velocityu∗t, which is a function of particle size
Dp (Eq. 1), such that,u∗
tsrepresents an ideal minimum threshold friction velocity, feffis
a correction factor accounting for the effect of surface roughness andfwis a factor that accounts for the effect of soil moisture content on the threshold friction velocity. The particle size is determined by the land surface soil texture. Calculating the threshold
25
friction velocity is required to calculate the horizontal dust flux (dHF) (Eq. 2), such that,
ACPD
15, 1523–1571, 2015The climatology of dust aerosol over the
arabian peninsula
A. Shalaby et al.
Title Page
Abstract Introduction
Conclusions References
Tables Figures
◭ ◮
◭ ◮
Back Close
Full Screen / Esc
Printer-friendly Version Interactive Discussion
Discussion
P
a
per
|
Discussion
P
a
per
|
Discussion
P
a
per
|
Discussion
P
a
per
|
friction velocity defined in (Eq. 1) to the friction velocityu∗ calculated within each grid cell from the model prognostic surface wind and the surface roughness. Finally, the vertical dust emission flux dFkinis assumed to be directly proportional to the horizontal flux dHF(Eq. 3), such that,βis an empirical factor and its value is 16 300 cm s−2(Zakey et al., 2006).
5
u∗
t Dp
=u∗
ts Dp
fefffw (1)
dHF Dp
=Eρa g u
∗3 1
+R Dp
(1−R2 Dp)dSrel Dp (2)
dFkin Rp
=βdHF Dp
(3)
Where,g is the gravity acceleration constant andρa is air density. RegCM3 (a previ-ous version) has been used frequently to simulate atmospheric dust and its radiative
10
impact. Most of these simulations have been performed for areas in the Sahara (Zakey et al., 2006; Konarè et al., 2008; Solmon et al., 2008, 2012; Napat et al., 2012; Steiner et al., 2014), apart from one over East Asia (Zhang et al., 2009). Over the Middle East and Arabian Peninsula there have been a few studies such as (Marcella and Eltahir, 2010, 2011, 2012; Nazrul Islam and Almazroui, 2012).
15
2.2.3 Experimental design
The model simulations are conducted for 14 years (1999–2012), but the analysis is done for the 2000–2012 time period with the first year used for model spin-up. The Eu-ropean Centre for Medium Range Weather Forecasts Reanalysis project (ERA-Interim) reanalysis data (https://apps.ecmwf.int/datasets/data/interim_full_daily) has been used
20
to provide the model with 6 h meteorological boundary conditions (Dee et al., 2011). Monthly climatology of dust aerosol is provided by the Model for Ozone and Related chemical Tracer (MOZART) model at 2.8◦×2.8◦(T42) resolution (Emmons et al., 2010). Figure 1 shows the model domain at 50 km grid resolution. The model vertical resolu-tion is 18 sigma levels. The model physics is configured as follows; the boundary layer
ACPD
15, 1523–1571, 2015The climatology of dust aerosol over the
arabian peninsula
A. Shalaby et al.
Title Page
Abstract Introduction
Conclusions References
Tables Figures
◭ ◮
◭ ◮
Back Close
Full Screen / Esc
Printer-friendly Version Interactive Discussion
Discussion
P
a
per
|
Discussion
P
a
per
|
Discussion
P
a
per
|
Discussion
P
a
per
scheme is UW-PBL, this is a 1.5 order local, down-gradient diffusion parameterization in which the velocity scale is based on the turbulent kinetic energy (TKE). The TKE in turn is calculated prognostically from the balance of buoyant production/destruction, shear production, dissipation vertical transport, and horizontal diffusion and advection (Giorgi et al., 2012; O’Brien et al., 2012).
5
The Bio-sphere-Atmosphere Transfer scheme (BATS) (Dickinson et al., 1993) is used to parameterize the land-surface atmosphere interaction. The full scheme includes a 1-layer vegetation module, a 1-1-layer snow module, a force restore model for soil tempera-ture, a 3-layer soil scheme and a simple surface runoffparameterization. This scheme is simpler than the other CLM3.5 schemes in the model, which have many physical
pa-10
rameterizations of soil processes (Tawfik and Steiner, 2011). It does not require time for the soil to equilibrate with the atmosphere (Giorgi et al., 2012). The convection scheme provided by Grell (Grell, 1993) is used along with the Community Climate Model version 3 (CCM3) radiation scheme (Kiehl et al., 1996).
Figure 1a and b shows the BATS land texture and topography of the region. BATS
15
land texture constitute of 17 categories (see Table 2 in Zakey et al., 2006). The first 16 categories represent the soil texture based on the classical sand-silt-clay percentage approach (Hillel, 2003). The stars indicate the location of the AERONET stations that will be used for model validation. The area around the AERONET stations will be used to calculate the area average of the modeled AOD for comparison against
observa-20
tions. S1 represents the Mesopotamian source region that includes Iraq and Arabian Peninsula, S2 represents the Red Sea source region that includes Al nofod desert, S3 represents the El Rob El khali desert, S4 represents the Somalia desert source region and S5 represents the southwest Asia source region that includes dry beds in the Afghanistan-Pakistan-Iran border.
ACPD
15, 1523–1571, 2015The climatology of dust aerosol over the
arabian peninsula
A. Shalaby et al.
Title Page
Abstract Introduction
Conclusions References
Tables Figures
◭ ◮
◭ ◮
Back Close
Full Screen / Esc
Printer-friendly Version Interactive Discussion
Discussion
P
a
per
|
Discussion
P
a
per
|
Discussion
P
a
per
|
Discussion
P
a
per
|
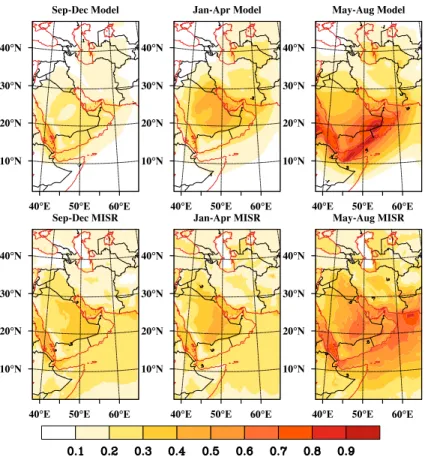
3 AOD climatology
3.1 The annual cycle
Figure 2 shows the comparison between modeled AOD and observed MISR’s AOD, for seasonal average.
The AOD is quite variable in space and time, yet shows a clear seasonal cycle.
5
In September–December, the model and MISR have the lowest AOD (0.1–0.3). The AOD maximum (0.3) extends from northern Iraq to the southern part of the Arabian Peninsula up to the Arabian Sea. This maximum is in the vicinity of the Arabian Gulf and Najd plateau. The model and MISR show higher AOD over the Red Sea near the Bab-el-Mandab strait and parallel to the Yemen mountain ranges compared to the
10
inland neighborhood. MISR’s AOD is higher than the modeled AOD over the Arabian Sea due to the contribution of sea-salt aerosols.
In January–April, there is quite strong dust activity over the region of interest. The AOD increases over all source regions (S1, S2, S3, S4 and S5; for locations see Fig. 1a with variable magnitudes. The AOD ranges from 0.3 to 0.5, the band of the highest
15
AOD lies between the Arabian Gulf and Najd plateau. The band has a tongue shape extended inside Iraq (S1) and has a flattened base near the El Rob El khali desert (S3). The Somalia (S4) and Iran-Pakistan-Afghanistan (S5) dust sources do not contribute too much to the AOD over the entire region.
The model’s AOD spatial distribution is quite similar to MISR, yet overestimates AOD
20
around the S1, S2 and S5 dust sources in January–April, In April, the model and MISR results become close to each other. During February–April, the model shows system-atic decrease of AOD offthe southern coast of the Arabian Peninsula; however, MISR shows higher AOD over the Indian Ocean/Arabian Sea, which may be attributed to sea salt aerosol.
25
ACPD
15, 1523–1571, 2015The climatology of dust aerosol over the
arabian peninsula
A. Shalaby et al.
Title Page
Abstract Introduction
Conclusions References
Tables Figures
◭ ◮
◭ ◮
Back Close
Full Screen / Esc
Printer-friendly Version Interactive Discussion
Discussion
P
a
per
|
Discussion
P
a
per
|
Discussion
P
a
per
|
Discussion
P
a
per
southward south in July–August. The AOD over the Red Sea and the Gulf of Aden increases steadily and reaches its maximum in July.
The model shows a comparable spatial distribution, yet overestimates AOD values. The modeled AOD maximum is centered over El Rob El khali desert (S3) in the south-eastern Arabian Peninsula. The AOD spatial distribution is controlled mainly by the
5
topography of the region. The eastern Arabian Gulf high land that extends from the Anatolia plateau in Turkey to southern Iran parallel to the Arabian Gulf (Fig. 1b) and the Najed Plateau in the central Arabian Peninsula (Fig. 1b) act as a funnel that controls the wind flow system in that complex region. The MISR AOD shows such a banana-like shape for the spatial distribution of maximum AOD; model’s AOD shows this shape
10
to a certain extent. In June, July and August, the model underestimates the AOD in the northern part of the Peninsula especially in Iraq, Jordan and Kuwait. However, the model overestimates AOD in the southeastern part of the Arabian Peninsula over Yemen, Oman and UAE.
The analysis of the annual cycle of the zonally averaged AOD reveals interesting
15
features of the temporal AOD development across the domain. Figure 3a represents the zonally averaged AOD (36–50◦E) and the area of interest spans from 10–30◦N. The model shows a first maximum in March and April centered at 25◦
N, the model’s AOD decreases in April and start to increase again in May. The second maximum is in mid-summer (July) and centered between 10 and 20◦N. This second maximum reveals
20
two peaks: one represents the southern Arabian Peninsula dust sources (15–20◦
N) and the other one the Somalia dust sources (10–15◦N); the minimum in between is the Bab-Elmandab strait and Gulf of Aden.
The MISR annual cycle of the zonally averaged AOD shows a bit different distribution (Fig. 3b). The first maximum is in between April and May and is centered at 28◦N.
25
ACPD
15, 1523–1571, 2015The climatology of dust aerosol over the
arabian peninsula
A. Shalaby et al.
Title Page
Abstract Introduction
Conclusions References
Tables Figures
◭ ◮
◭ ◮
Back Close
Full Screen / Esc
Printer-friendly Version Interactive Discussion
Discussion
P
a
per
|
Discussion
P
a
per
|
Discussion
P
a
per
|
Discussion
P
a
per
|
3.2 Comparisons with AERONET and satellite observations
The modeled AOD has been compared with different instruments, namely, MISR, MODIS (Deep-blue), OMI and AERONET. The three AERONET stations (details shown in Supplement Table S1) show differences in the AOD’s seasonal cycle, magnitude and monthly variability. The modeled AOD is from dust aerosol alone, however the
mea-5
sured AOD is a result of all kind of aerosol present in the region (e.g., black carbon, sulfate and sea-salt). This should be considered as a source of discrepancy. Never-theless, in spring and summer dust aerosol is the major aerosol component over the Arabian Peninsula (Kim et al., 2011).
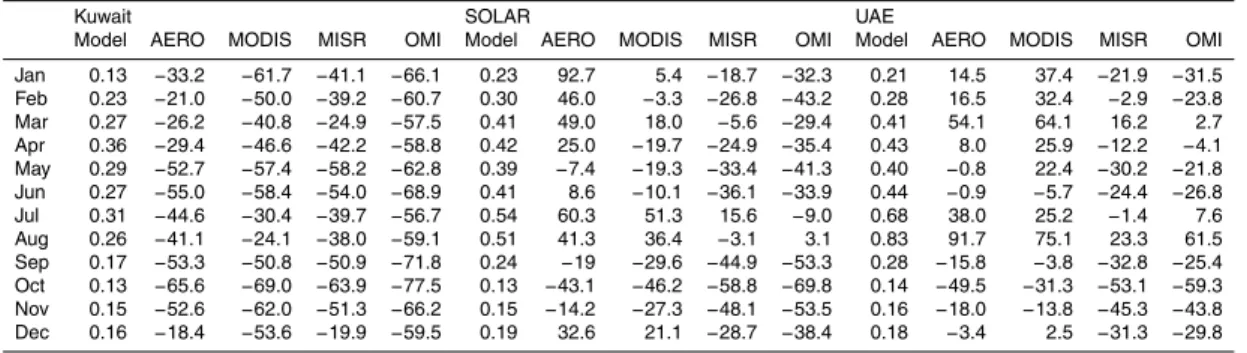
In the following discussion the dust season for a given site is defined as those months
10
that have at least 20 % higher AOD values compared to the annual mean AOD at that site. The first row in Table 1 shows the annual mean of the medians for each dataset for each station, the following rows represent the calculated monthly deviation from this annual median. The deviation from the annual mean is calculated by the following equation
15
deviation=100×τmonth
−τannual
τannual (4)
whereτmonth is the AOD monthly average andτannualis the AOD annual mean.
The modeled AOD showed different behavior with respect to each observational dataset as well as station’s location. Table 2 shows the modeled monthly median for each site (shown in the first column for each site) and the corresponding relative error
20
(Errorrel) calculated using the following equation.
Errorrel=100×τm −τo
τm (5)
withτm being the modeled AOD andτo being the observed AOD. The negative (posi-tive) relative error means how much the model is underestimated (overestimated) with respect to a given observation.
ACPD
15, 1523–1571, 2015The climatology of dust aerosol over the
arabian peninsula
A. Shalaby et al.
Title Page
Abstract Introduction
Conclusions References
Tables Figures
◭ ◮
◭ ◮
Back Close
Full Screen / Esc
Printer-friendly Version Interactive Discussion
Discussion
P
a
per
|
Discussion
P
a
per
|
Discussion
P
a
per
|
Discussion
P
a
per
3.2.1 Kuwait University, Kuwait
The Kuwait University site is near major dust sources (S1 and S2 in Fig. 1a) and would be representative to the northern Arabian Peninsula dust aerosol climatology. Figure 4 shows a 5 year statistics of AOD for AERONET station, a 7 years statistics of AOD for the satellite observations and a 13 year statistics of AOD for RegCM4.
5
Table 1 shows that the AERONET annual averaged median is∼0.4. Therefore the dust season months, which exceed 20 % of the annual averaged median are April– July (Table 1). May shows the maximum AOD, which is 50 % higher than the annual average. The May–July months show a maximum variability (the difference between 25 percentile and 75 percentile is the greatest). December and January show a minimum
10
AOD of 0.2 (Fig. 4).
The observational dataset shows some disagreement about the length and intensity of the dust season according to the proposed criterion. AERONET and MISR show four months as dust season, while MODIS and OMI only show three month as dust season. In addition AERONET and MISR AOD values are often higher than the MODIS and
15
OMI AOD values.
3.2.2 Solar-Village, Saudi Arabia
The Solar-Village site would be a representative of central Arabian Peninsula dust aerosol climatology. The altitude of this site (764 m a.s.l) and its location in the vicinity of complex terrain may contribute to the apparent differences in AOD climatology with
re-20
gard to the other sites. Figure 5 shows a 13 year statistics of AERONET AOD, a 7 year statistics of AOD for the satellite observations and a 13 year statistics of RegCM4 AOD. The satellite group shows maximum AOD in March–June, except for OMI, whose maximum AOD occur in February–August. In addition, OMI has higher AOD values than the other satellite platforms. AERONET shows maximum median in April–August
25
ACPD
15, 1523–1571, 2015The climatology of dust aerosol over the
arabian peninsula
A. Shalaby et al.
Title Page
Abstract Introduction
Conclusions References
Tables Figures
◭ ◮
◭ ◮
Back Close
Full Screen / Esc
Printer-friendly Version Interactive Discussion
Discussion
P
a
per
|
Discussion
P
a
per
|
Discussion
P
a
per
|
Discussion
P
a
per
|
The AERONET AOD statistics show that the AOD annual average median is 0.27 (Table 1). Since dust concentration decreases with height, therefore The AERONET AOD of Solar-Village is much less than the Kuwait University site and this may be due to the high altitude of Solar-Village and its far distance to major dust sources. Nevertheless, this station could capture a severe dust episode as reported by Alharbi
5
et al. (2013) and Kalenderski et al. (2013).
The dust season in this region spans five months (April–August) according to the AERONET data; however, MODIS, MISR and OMI show April–June months as the dust season (Table 3). MODIS, MISR and OMI show higher AOD than AERONET for Solar-Village at the time of the dust season (Fig. 5).
10
Solar-Village shows a different climatology in terms of the dust season onset and its intensity. The model shows a larger temporal extension of the dust season and an early onset; it starts in March and lasts until August.
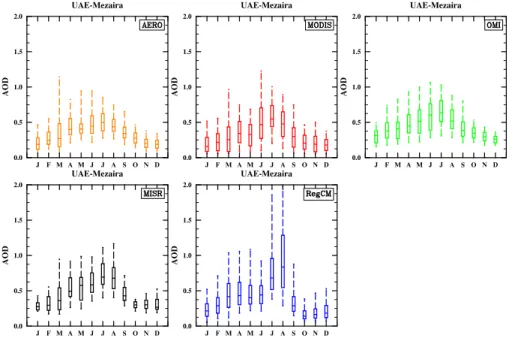
3.2.3 Mezaira, United Arab Emirate (UAE)
The Mezaira site is near the El rob El khali desert, which is a major dust source in
15
the Arabian Peninsula (S3 in Fig. 1a). The site is representative for southern Arabian Peninsula dust aerosol climatology.
Figure 6 shows a 7 year statistics of AERONET AOD, 7 year statistics of AOD for the satellite observations and a13 year statistics of AOD for RegCM4.
The annual average median is ∼0.4 (Table 1). The extension of the dust season 20
varies among the datasets, AERONET shows 5 months dust season (April–August), MISR and OMI show 4 months dust season (May–August), MODIS shows 3 months dust season (June–August) and finally RegCM4 shows a 2 months dust season (July– August). They all agree about the end of the dust season in August but they disagree on the dust season onset (Table 1).
25
ACPD
15, 1523–1571, 2015The climatology of dust aerosol over the
arabian peninsula
A. Shalaby et al.
Title Page
Abstract Introduction
Conclusions References
Tables Figures
◭ ◮
◭ ◮
Back Close
Full Screen / Esc
Printer-friendly Version Interactive Discussion
Discussion
P
a
per
|
Discussion
P
a
per
|
Discussion
P
a
per
|
Discussion
P
a
per
analysis in Table 1 also reflects this phenomenon in all datasets. Table 1 shows how the dust season is shifted towards summer months along the traverse from the northern (Kuwait site) to the southern part of the Arabian Peninsula (UAE site). This feature will be explained by the analysis of the atmospheric dynamics in the following section.
The validation of the modeled AOD against the observations shows how the model
5
behaves differently from region to region and could shed some light on the sources of uncertainty of the model. Table 2 (first column for each site) lists the modeled AOD monthly medians for the three sites and it is used to calculate the relative error with respect to each observational datasets according to Eq. (5).
RegCM4 underestimates AOD over the northern part of the Arabian Peninsula with
10
respect to all observational datasets (Table 2). For the dust season months (April–July) the model relative error ranges between 29 and 68 %. This model feature is also no-ticed in Marcella and Eltahir (2010). Toward the central Arabian Peninsula, the model performance becomes better, and the relative error is between 7 and 60 %. The model underestimates in the late spring season, but tends to overestimate in the summer
15
season (Table 2). Toward the southern Arabian Peninsula, the model error ranges re-duced compared to the other stations, for instance, the model errors in June are 1 and 5 % with respect to AERONET and MODIS respectively. On the other hand, the model shows significant over estimation in August, which is as high as 90 and 75 % with respect to AERONET and MODIS, respectively (Table 2).
20
4 Spatial and temporal dust evolution
The large-scale circulation ultimately controls the seasonal evolution of atmospheric mineral dust. However, the topography and dust source distributions provide the sur-face boundary conditions that determine the intensity of sursur-face dust emission and eventually the intensity of the dust storm.
25
ACPD
15, 1523–1571, 2015The climatology of dust aerosol over the
arabian peninsula
A. Shalaby et al.
Title Page
Abstract Introduction
Conclusions References
Tables Figures
◭ ◮
◭ ◮
Back Close
Full Screen / Esc
Printer-friendly Version Interactive Discussion
Discussion
P
a
per
|
Discussion
P
a
per
|
Discussion
P
a
per
|
Discussion
P
a
per
|
dust sources in northern Arabia. There are two types of frontal type dust, pre-frontal type and post-frontal type (Wilkerson, 1991). The frontal system is associated with in-stability of the air column, which results in dust uplifting. The summertime dust storm is a result of strong north to northwest wind associated with the Indian monsoon de-pression.
5
4.1 Spring time (cold season)
4.1.1 Large-scale circulation
In winter and early spring (January–April) the Arabian Peninsula is affected by an exten-sion of Siberian High pressure and the Red Sea trough in northern part and southern part of the Arabian Peninsula respectively. The anti-cyclonic wind field is dominated
10
over the Arabian Peninsula. Figure 7a and b shows the climatology of the mean sea level pressure (MSLP), while Fig. 7d and e shows the climatology of temperature and wind field at 850 hPa geopotential surface. While the extension of Siberian high pres-sure with cold air mass affects the northern part of the Arabian Peninsula (Fig. 7a and b), the southerly winds which are associated with the Red Sea trough over the
south-15
ern Arabian Peninsula advect warm air toward north (Fig. 7d and e), which leads to instabilities in the atmosphere.
The position and strength of the Sub-Tropical Jet (STJ) at 200 hPa determine the atmospheric stability at the surface. Figure 7g and h shows the climatology of the STJ. In winter the STJ core is located over the Arabian Peninsula. The spring STJ core is
20
weaker than the winter STJ. It migrates toward north in April–May and displays a strong meridional component (Fig. 7g and h). Alhabri et al. (2013) described the role of the STJ in the onset and development of dust storms. Briefly, the STJ generates regions of upward motion and downward motion (i.e. secondary circulation). The north side of the STJ core is a divergence zone that is associated with upward motion, while
25
ACPD
15, 1523–1571, 2015The climatology of dust aerosol over the
arabian peninsula
A. Shalaby et al.
Title Page
Abstract Introduction
Conclusions References
Tables Figures
◭ ◮
◭ ◮
Back Close
Full Screen / Esc
Printer-friendly Version Interactive Discussion
Discussion
P
a
per
|
Discussion
P
a
per
|
Discussion
P
a
per
|
Discussion
P
a
per
(−) values designate upward motion and (+) values designate downward motion). In
December–April the STJ core is located south of 30◦N (Fig. 7g and h), and Fig. 8 shows the secondary circulation region of upward motion and downward motion from surface (1000 hPa) to the upper air (100 hPa) south of 30◦N. In late winter (February) and spring time (March–April) the upward motion progressively strengthens from 20◦N
5
to 30◦N and from surface to upper air levels.
In most part of the Arabian Peninsula, the prevailing wind directions are southerlies and southwesterlies. The observations over the northern and southern parts of the Arabian Peninsula show that during the dust season, the prevailing wind directions are southerlies and southwesterlies (Mashat et al., 2008). Figure 9 shows the climatology
10
of the zonally averaged wind’s meridional component. The southerly meridional com-ponent shows the ascending motion and the sliding of warm air over the cold air from the north.
Figure 10 shows the climatology of the zonally averaged vertical profile of fine dust concentration. The maximum concentration is located between 15 and 30◦
N. The dust
15
concentrations progressively increase towards north from December to February and start to retreat in April. In winter and spring, dust layers do not extend to high levels in the atmosphere, actually they are confined to levels below 800 hPa.
4.1.2 Land surface response
The friction velocity is the sole dynamical variable in the dust parameterization (the
20
other variables are land surface characteristics). The land surface response of the large scale circulation is reflected by the friction velocity. Also, according to Eqs. (2) and (3), the dust emission is proportional to the friction velocity. In Supplement Fig. S1 the friction velocity over land surfaces is shown and in the following discussion, we will focus in particular on the dust source regions (Fig. 1a).
25
com-ACPD
15, 1523–1571, 2015The climatology of dust aerosol over the
arabian peninsula
A. Shalaby et al.
Title Page
Abstract Introduction
Conclusions References
Tables Figures
◭ ◮
◭ ◮
Back Close
Full Screen / Esc
Printer-friendly Version Interactive Discussion
Discussion
P
a
per
|
Discussion
P
a
per
|
Discussion
P
a
per
|
Discussion
P
a
per
|
pared to the surrounding areas (Fig. 11). Over the source region S4 (Al Roub AL khali desert) dust emission is clearly accompanied with high friction velocity. In the northern part of the Arabian Peninsula the climatology of the friction velocity does not reflect the abovementioned relation between friction velocity and surface dust emission. Although, this region is affected by a high pressure system which causes a weak surface wind
5
field, most of the emitted dust in this region is due to a fast migrating cyclone over the Syria–Iraq area associated with high surface wind (Mashat et al., 2008; Abdi Vishkaee et al., 2012; Alharbi et al., 2013) that has been filtered out in the averaging procedure. The corresponding atmospheric surface dust concentration for dust less than 10 µm is shown in Fig. S2. In the months from December to April the surface dust
concentra-10
tion over the Arabian Peninsula reaches up to 120 µg m−3in the central region, which is in agreement with results for the same region performed in a global modeling study by Ginoux et al. (2004).
4.2 Summer time (warm season)
4.2.1 Large-scale circulation 15
Starting mid-spring (i.e. April) the surface high pressure retreats and the Indian Mon-soon depression starts to progress towards the Arabian Peninsula. In summer (June– August) the Arabian Peninsula is largely impacted by the Indian Monsoon depression and it further intensifies during summer months (Fig. 7c). The prevailing winds in this season are northerlies and northwesterlies (“Shamal”) over the most of the Arabian
20
peninsula (Mashat et al., 2008), while the southern part is affected by strong southerly winds associated with the Low-Level Jet (i.e. Somalia Jet) that is triggered by the In-dian Monsoon (Fig. 7f). In late spring and summer (i.e. April–August), the STJ migrates toward north and a high pressure is develops over the Arabian Peninsula (Fig. 7i).
The summer meridional components in Fig. 9 become northerly, which is an
indi-25
cation of the Indian Monsoon cyclonic circulation. In addition, Fig. 8 shows that the ascending motion in the southern part of the Arabain Peninsula (15–25◦
ACPD
15, 1523–1571, 2015The climatology of dust aerosol over the
arabian peninsula
A. Shalaby et al.
Title Page
Abstract Introduction
Conclusions References
Tables Figures
◭ ◮
◭ ◮
Back Close
Full Screen / Esc
Printer-friendly Version Interactive Discussion
Discussion
P
a
per
|
Discussion
P
a
per
|
Discussion
P
a
per
|
Discussion
P
a
per
than during the winter-spring time. The descending motion over the ocean is evident in the summer season at latitudes from 10 to 15◦N. According to Fig. 10 the ascending motion in southern Arabia in upper air results in uplifting of dust to higher atmospheric levels up to the 500 hPa level. After the retreat of the Indian Monsoon, the ascend-ing motion weakens significantly and the meridional velocity reverses its sign to be
5
southerly again.
4.2.2 Land surface response
During the summer season, starting June, the friction velocity (Fig. S1) gets higher in the eastern and southern part of the Arabian Peninsula, and over Somalia (dust sources S3 and S4 in Fig. 1a). As a consequence high surface dust emission fluxes
10
(Fig. 11) occur over the eastern and the southern Arabian Peninsula (e.g. in Oman) and over Somalia. Those source regions contribute significantly to the resultant AOD in summer. The surface dust concentration in summer reaches maximum values between 100–180 µg m−3(Fig. S2).
5 Dust radiative impact 15
The ultimate aim of studying the climatology of aerosol in any climate chemistry model like RegCM4 is to estimate the radiative feedback of aerosol on climate (Stanelle et al., 2010), namely, the radiative forcing of the aerosol. With regard to some Global Climate Model (GCM) simulations, the principal radiative effect of mineral dust is heating the atmosphere in the source region. This results in inhibiting convection and reduction in
20
precipitation (Tegan and Lacis, 1996). The analysis of radiative forcing and its depen-dence on particle size shows that regardless of the particle size dust particles exert negative radiative forcing (cooling effect) near the Earth’s surface. However, such neg-ative radineg-ative forcing decreases with height according to the dust particle’s radius. The radiative forcing becomes positive (heating effects) for larger particle at higher levels
ACPD
15, 1523–1571, 2015The climatology of dust aerosol over the
arabian peninsula
A. Shalaby et al.
Title Page
Abstract Introduction
Conclusions References
Tables Figures
◭ ◮
◭ ◮
Back Close
Full Screen / Esc
Printer-friendly Version Interactive Discussion
Discussion
P
a
per
|
Discussion
P
a
per
|
Discussion
P
a
per
|
Discussion
P
a
per
|
(Tegan and Lacis, 1996). In this study we only estimate the direct radiative forcing of dust aerosol, since there is no indirect effect parameterization in RegCM4.
In the following sections we will compare the model’s estimation of the Top of Atmo-sphere Radiative forcing (TOARF) and the Bottom of the AtmoAtmo-sphere Radiative Forc-ing (BOARF) with the AERONET’s BOARF and TOARF inversion products (Dubovik
5
and King, 2000). The AERONET BOARF and TOARF calculation based on the “Almu-cantar” basic sky measurement at optical air mass equal to 2–4 (i.e. the zenith angle between 50◦and 80◦) provides highest accuracy for the aerosol properties retrieval al-gorithm (Holben et al., 1998; García et al., 2012). For this condition we do not compare observations with daily average or noon-time modeled radiative forcing, but only select
10
the afternoon model output (i.e. the 15:00 and 18:00 UTC output). The AERONET’s BOARF and TOARF is retrieved for the shortwave range between (0.44–1.02 µm) and we compare this data with model’s surface shortwave range between radiative forcing and TOA shortwave radiative forcing.
5.1 BOARF
15
Figure 12 shows the comparison between the AERONET stations and RegCM4 for (BOARF). While RegCM4 captures the peak of seasonal cycle of BOARF (April– August), it clearly underestimates BOARF for all months. The Kuwait AERONET station shows the largest BOARF median (up to−90 W m−2in June) compared to Solar-Village (June median:−61 W m−2) and UAE-Mazeira (June median up to −62 W m−2). On the 20
other hand, the model’s area averaged AOD values around the AERONET station lo-cations shows lower values in June; the median for Kuwait is∼ −19 W m−2, while for
both, Solar-Village and UAE-Mezaira the median is ∼ −20 W m−2. These experiment
results are close to other modeling results (e.g., Kalenderski et al., 2013 estimates BOARF around−15.0 W m−2for a winter dust storm over the Arabian Peninsula using 25
WRF model). But it seems that RegCM4 underestimates BOARF in other regions like North Africa as shown by Napat et al. (2012), who calculate around−15.0 W m−2 for
ACPD
15, 1523–1571, 2015The climatology of dust aerosol over the
arabian peninsula
A. Shalaby et al.
Title Page
Abstract Introduction
Conclusions References
Tables Figures
◭ ◮
◭ ◮
Back Close
Full Screen / Esc
Printer-friendly Version Interactive Discussion
Discussion
P
a
per
|
Discussion
P
a
per
|
Discussion
P
a
per
|
Discussion
P
a
per
(expressed as the average of monthly medians) as displayed in Table 3 shows that the Kuwait University site has the largest observed BOARF (−65 W m−2), while the
mod-eled BOARF does not show big differences among the three regions. On the average, RegCM4 underestimates BOARF by a factor of 4 (Table 3).
The seasonal behavior of the model shows a negative radiative forcing (cooling
ef-5
fects) over the whole domain with maximum negative radiative forcing over the Arabian Peninsula and Somalia compared to other regions with relatively high dust concentra-tion like Pakistan or the Caspian sea regions (Fig. S3). This is, because dust in those regions does not extend to upper air like it is the case over the Arabian Peninsula (Fig. 10).
10
5.2 TOARF
Figure 13 shows the comparison of TOARF between the AERONET stations and RegCM4. The effect of dust in this case is controversial. The TOARF is generally less negative than the BOARF and even may become positive. This depends on the pre-scribed optical properties like the single scattering albedo and the complex refractive
15
index in the model and also the AERONET retrieval algorithm. This positivity is indica-tive on how the mineral dust aerosol heats the atmosphere. García et al. (2012) show that the AERONET retrieved TOARF is exclusively negative over the Arabian Penin-sula region. However, our analysis for the AERONET data yields positive values only for extreme values not within the 75 percentile (Fig. 13). The Kuwait University site has
20
the largest negative values of TOARF (up to−25 W m−2). Solar-Village has−10 W m−2
and UAE-Meziara has−13 W m−2. The model underestimates TOARF: up to−5 W m−2
over the Kuwait site, −4 W m−2 over Solar-Village and −7 W m−2 over UAE-Meziara.
The comparison between modeled and the observed annual TOARF (expressed as the average of the monthly median) indicates that again the Kuwait site exhibits the
25
largest observed TOARF (−17 W m−2), while the modeled TOARF does not show big
ACPD
15, 1523–1571, 2015The climatology of dust aerosol over the
arabian peninsula
A. Shalaby et al.
Title Page
Abstract Introduction
Conclusions References
Tables Figures
◭ ◮
◭ ◮
Back Close
Full Screen / Esc
Printer-friendly Version Interactive Discussion
Discussion
P
a
per
|
Discussion
P
a
per
|
Discussion
P
a
per
|
Discussion
P
a
per
|
Figure S4 displays the seasonal evolution of TOARF. There are pronounced negative values over the sea surface, but, over land surface the TOARF signal is close to zero or may even become positive over the center of the Arabian Peninsula especially in July. This feature is related to the underlying land surface albedo, where the Arabian Peninsula has a higher surface albedo that contributes to TOARF.
5
6 Summary and conclusions
The Regional Climate Model version 4 (RegCM4) has been used to simulate the occur-rence and distribution of atmospheric mineral dust aerosol over the Arabian Peninsula. Thirteen years of high resolution simulation and a comparison with a suite of observa-tional datasets were utilized to understand the climatology of atmospheric dust
occur-10
rence. Observational data included Kuwait University, Solar-Village and UAE-Mezaira AERONET stations, having the longest AOD record, and.satellite AOD retrievals from MISR, OMI and MODIS (Deepblue) from 2006 to 2012.
While the modeled AOD shows that the dust season extends from March to August with two pronounced maxima, one over the northern Arabian Peninsula in March (AOD
15
≈0.4) and one over the southern Arabian Peninsula in July (AOD≈0.7), the
observa-tions indicate a dust season, which extends from April to August with two pronounced maxima, one over the northern Arabian Peninsula in April (AOD≈0.5) and one over the southern Arabian Peninsula in July (AOD≈0.5). The zonally averaged annual
cy-cle AOD analysis shows two AOD peaks, one in springtime (March–May) and one in
20
summertime (June–August). While the model and the observations agree in the timing of the summertime peak, there is some disagreement in the springtime peak where the model reveals a springtime peak about, one month earlier (February–March). This bi-modal oscillation of dust occurrence is caused by the large scale circulation and the land surface response.
25
ACPD
15, 1523–1571, 2015The climatology of dust aerosol over the
arabian peninsula
A. Shalaby et al.
Title Page
Abstract Introduction
Conclusions References
Tables Figures
◭ ◮
◭ ◮
Back Close
Full Screen / Esc
Printer-friendly Version Interactive Discussion
Discussion
P
a
per
|
Discussion
P
a
per
|
Discussion
P
a
per
|
Discussion
P
a
per
south-west. The frontal area between the cold air in the north and warm air in the south promotes a strong southerly wind with enhanced upward motion, which results in dust uplifting in the northern and western part of the Arabian Peninsula. This is favored by increased surface friction in these areas at the same time.
In summer the atmospheric circulation entirely changes. The Arabian Peninsula is
5
affected by the extension of Indian Monsoon Depression that causes the Shamal, a strong northwesterly wind aligned along the Arabian Gulf. The Shamal is strong enough to push and concentrate dust over the southern part of the Arabian Penin-sula. At the same time the Somalia Low-Level Jet strongly enhances the dust uplifting from dust sources in Somalia. The Somalia dust contributes significantly to the overall
10
dust burden over the region, especially over the Red and Arabian Sea.
The Top of Atmosphere Radiative Forcing (TOARF) and the Bottom of Atmospheric Raditive Forcing (BOARF) data retrieved from AERONET were used to analyze the atmospheric dust radiative forcing to obtain a better understanding of potential climate feedback mechanisms in the region. While the model captures the annual cycle of
15
TOARF and BOARF, it underestimates both by a factor of 3 and 4, respectively. These biases contribute to the large uncertainty of modeled surface temperature over the Arabian Peninsula noticed earlier by Steiner et al. (2014).
Overall, the seasonal behavior of BOARF shows a negative radiative forcing with a maximum in the summer (cooling effects) over the whole domain and with maximum
20
negative radiative forcing over the Arabian Peninsula and Somalia compared to other regions with relatively high dust concentration like Pakistan or the Caspian Sea region. Our study indicates that this is due to the fact that dust in those regions does not extend to upper air like it is the case over the Arabian Peninsula.
The model’s TOARF is less negative and may even display some positivity in the
25
ACPD
15, 1523–1571, 2015The climatology of dust aerosol over the
arabian peninsula
A. Shalaby et al.
Title Page
Abstract Introduction
Conclusions References
Tables Figures
◭ ◮
◭ ◮
Back Close
Full Screen / Esc
Printer-friendly Version Interactive Discussion
Discussion
P
a
per
|
Discussion
P
a
per
|
Discussion
P
a
per
|
Discussion
P
a
per
|
The Supplement related to this article is available online at doi:10.5194/acpd-15-1523-2015-supplement.
Acknowledgements. We gratefully acknowledge the data provided by the AERONET network and we wish to express our appreciation to the operators of stations for maintaining these important measurements.
5
References
Abdou, W. A., Diner, D. J., Martonchik, J. V., Bruegge, C. J., Kahn, R. A., Gaitley, B. J., Crean, K. A., Remer, L. A., and Holben, B.: Comparison of coincident multiangle imaging spectroradiometer and moderate resolution imaging spectroradimeter aerosol optical depths over land and ocean scenes containing aerosol robotic network sites, J. Geophys. Res., 110,
10
D10S07, doi:10.1029/2004JD004693, 2005.
Abdi Vishkaee, F., Flamant, C., Cuesta, J., Oolman, L., Flamant, P., Khalesifard, H.: Dust trans-port over Iraq and northwest Iran associated with winter shamal: a case study, J. Geophys. Res., 117, D03201, doi:10.1029/2011JD016339, 2012.
Alfaro, S. C., and Gomes, L.: Modeling mineral aerosol production by wind erosion: emission
15
intensities and aerosol size distribution in source areas, J. Geophys. Res., 106, 18075– 18084, 2001.
Alharbi, B. H.: Airborne dust in Saudi Arabia: source areas, entrainment, simulation and com-position, PhD dessertation, Monash university, Melbourne, Australia, 313 pp., 2009.
Alharbi, B. H., Maghrabi, A., and Tapper, N.: The march 2009 dust event in Saudi Arabia:
20
precursor and supportive environment, B. Am. Meteorol. Soc., 94, 515–528, 2013.
Dee, D. P., Uppala, S. M., Simmons, A. J., Berrisford, P., Poli, P., Kobayashi, S., Andrae, U., Balmaseda, M. A., Balsamo, G., Bauer, P., Bechtold, P., Beljaars, A. C. M., Van de Berg, L., Bidlot, J., Bormann, N., Delsol, C., Dragani, R., Fuentes, M., Geer, A. J., Haimberger, L., Healy, S. B., Hersbach, H., Hólm, E. V., Isaksen, L., Kållberg, P., Köhler, M., Matricardi, M.,
25
ACPD
15, 1523–1571, 2015The climatology of dust aerosol over the
arabian peninsula
A. Shalaby et al.
Title Page
Abstract Introduction
Conclusions References
Tables Figures
◭ ◮
◭ ◮
Back Close
Full Screen / Esc
Printer-friendly Version Interactive Discussion
Discussion
P
a
per
|
Discussion
P
a
per
|
Discussion
P
a
per
|
Discussion
P
a
per
Dickinson, R. E., Henderson-Sellers, A., and Kennedy, P. J.: Biosphere–atmosphere transfer scheme version 1e as coupled to the NCAR community climate model, Tech. Rep., National Center for Atmos. Res., Boulder, Colorado, USA, 1–80, 1993.
Diner, D. J., Beckert, J. C., Reilly, T. H., Bruigge, C. J., Conel, J. E., Kahn, R. A., Mar-tonchik, J. V., Acherman, T. P., Davies, R., Gerstl, S. A. W., Gordon, H. R., Muller, J.,
My-5
neni, R. B., Sellers, P. J., Pinty, B., and Verstraete, M. M.: Multi-angle imaging spectrora-diometer (misr) instrument description and experiment overview, IEEE T. Geosci. Remote, 36, 1072–1087, 1998.
Dubovik, O. and King, M. D.: A flexible inversion algorithm for retrieval of aerosol optical prop-erties from Sun and sky radiance measurements, J. Geophys. Res., 105, 20673–20696,
10
2000.
Eck, T. F., Holben, B. N., Reid, J. S., Sinyuk, A., Dubovik, O., Smirnov, A., Giles, D., O’Neill, N. T. N., Tsay, S.-C., Ji, Q., Mandoos, A. A., Khan, M. R., Reid, E. A., Schafer, J. S., Sorokine, M., Newcomb, W., and Slusker, I.: Spatial and temporal variability of column-integrated aerosol optical properties in the southern Arabian Gulf and United Arab Emirates
15
in summer, J. Geophys. Res, 113, D01204, doi:10.1029/2007JD008944, 2008.
Emmons, L. K., Walters, S., Hess, P. G., Lamarque, J.-F, Pfister, G. G., Fillmore, D., Granier, C., Guenther, A., Kinnison, D., Laepple, T., Orlando, J., Tie, X., Tyndall, G., Wiedinmyer, C., Baughcum, S. L., and Kloster, S.: Description and evaluation of the model for ozone and related chemical tracers, version 4 (MOZART-4), Geosci. Model Dev., 3, 43–67, 2010.
20
García, O. E., Díaz, J. P., Expósito, F. J., Díaz, A. M., Dubovik, O., Derimian, Y., Dubuis-son, P., and Roger, J.-C.: Shortwave radiative forcing and efficiency of key aerosol types us-ing AERONET data, Atmos. Chem. Phys., 12, 5129–5145, doi:10.5194/acp-12-5129-2012, 2012.
Giannadaki, D., Pozzer, A., and Lelieveld, J.: Modeled global effects of airborne desert on air
25
quality and premature mortality, Atmos. Chem. Phys. 14, 957–968, doi:10.5194/acp-14-957-2014, 2014.
Giorgi, F. and Bates, G. T.: The climatological skill of a regional model over complex terrain, Mon. Weather Rev., 117, 2325–2347, 1989.
Giorgi, F., Bates, G. T., and Nieman, S. J.: The multi-year surface climatology of a regional
30
![Table 1. Monthly deviation in [%] from the AOD annual average median for each site. Bold numbers indicate values with deviations of at least +20 % from the AOD annual average median and are considered dust season.](https://thumb-eu.123doks.com/thumbv2/123dok_br/16275097.184201/34.918.43.671.277.452/monthly-deviation-average-numbers-indicate-deviations-average-considered.webp)