46 Vol. II │ No. │ May 6|
SOURCES OF ENTERPRISE VALUE
Viorica Mădălina Ion (contact author), Academy of Economic Studies, Bucharest, PhD student in Finance, mvmadalina@yahoo.com
We suggest you to cite this article as:
Ion, V.M. (2016) Sources of enterprise value. Junior Scientific Researcher, Vol II, No. 1, pp. 16-29.
Abstract
The value of the enterprise has an increased importance in business valuation, so maximizing it becomes a priority for the interested parties, such as its shareholders or investors. The purpose of this article is the analysis of the sources of enterprise value and its factors, in order to understand the causes of the decrease or the possibilities for maximizing the enterprise value, passing over the main concepts in the literature. The analysis refers to the listed companieson the Bucharest Stock Exchange (BVB) from the energy sector, including the largest Romanian company as per its capitalization, OMV Petrom. The research took into account the fact that the analysis of a large company with a long history is facilitated by the existence of multi-annual information, unlike the firms in the early life cycle operating in an emerging market.
Keywords: benefits, cash flow, valuation, price, profit, enterprise value.
JEL Classification: G32, L25, L21
Introduction
The analysis of the factors influencing the value of a business starts from the existing theories, based on the Management Course from Open University Business School, such as:
Robert Eccles (1998) considered that financial performance indicators are insufficient for measuring business success, and instead we need a set of indicators, including non-financial ones, such as the market share. Similarly, the Balanced Scorecard (Kaplan and Norton, 1998) is a management tool that equally evaluates the clients, employees, financial performance of the organization (using indicators such as cash flow, profitability, development or shareholders value) and the innovation and uses specific key performance indicators for each of the four perspectives – Z theory (OUBS, 2010). Similar perspectives on the activity of the enterprise (market, financial activity, operational activity, human resources) are used in business valuation. Organizations should serve the stakeholders (R. Edward Freeman, 2001), being part
of the external environment where it operates. The interested parties have specific objectives, such as increasing the turnover or the total economic asset of enterprise (Millman, 1993).
Piercy (1997) considered that market-oriented organizations should provide value to customers, competition, partners and collaborators. It is inferred that the main people involved in the activity and the value of the enterprise are the following: external interested parties – its shareholders, investors, lenders, the state, clients, the public, competition, the owners; and internal ones - managers and employees.
47 Vol. II │ No. │ May 6|
and Euske (1987) have a normative perspective regarding ROI maximization and results optimization.
The study and quantification of the inefficiencies arising from the managers-shareholders conflicts - known as agency problem (Eisenhardt, 1989), it appears that managers will act to maximize owners' wealth only together with their welfare, resulting agency costs (Investopedia, 2016). This determines the owners to hire auditors and managers to seek for justifications for their actions, through various reports.
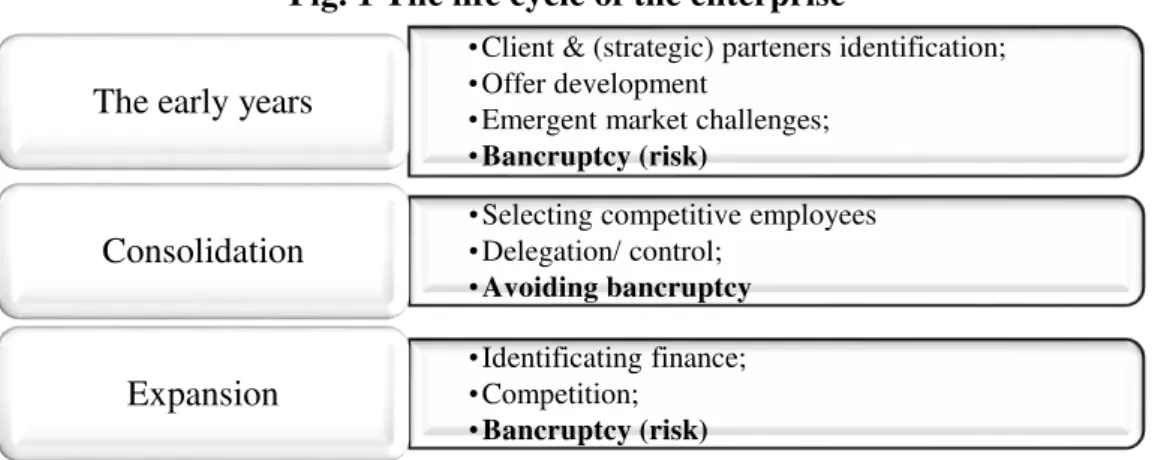
Depending on the enterprise life stage (the early years of operation, the period of consolidation or expansion), it may be confronted with various problems and associated risks, which significantly influence the expectations regarding the future evolution of its performance and value, and the associated risks (fig. 1).
Fig. 1 The life cycle of the enterprise
Source: Developed by the author based on (Porojan, 2002)
As we can see, the risk of bankruptcy is constant in the activity of the enterprise. After the famous bankruptcies1, the enterprise value maximization returned into discussions, requiring:
• Investments to capitalize on the enterprise properties, for a future profitability; • Protection of enterprise value, avoiding wastage/bankruptcy, maintaining the solvency or the financial stability of the enterprise (Elijah, 2010). Bankruptcy is the expression of an improper management, or incorrect expectations of enterprise and market development; as a result, the market eliminates the businesses unable to adapt (coordinator Coralia, 2001).
Next, we will focus the analysis on the firms in the stage of consolidation, with a relevant history and market, which facilitates the analysis and understanding of the value and its factors of influence.
Background
“What remains of his (the owner’s or manager’s) profits after deducting interest on his capital
at the current rate may be called his earnings of undertaking or management.” (Alfred Marshall)
1 Enron, WorldCom / Lehman Brothers
(http://www.inc.com/karl-and-bill/maximizing-shareholder-value-is-not-a-dumb-idea.html)
•Client & (strategic) parteners identification;
•Offer development
•Emergent market challenges;
•Bancruptcy (risk) The early years
•Selecting competitive employees
•Delegation/ control;
•Avoiding bancruptcy Consolidation
•Identificating finance;
•Competition;
48 Vol. II │ No. │ May 6|
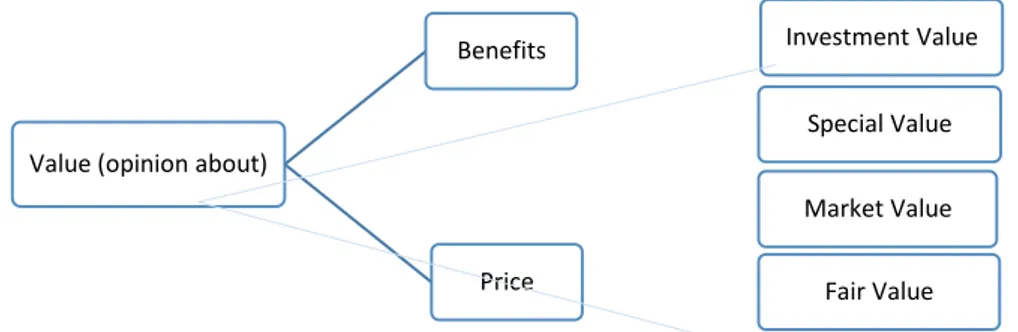
The value is an opinion on the expected price for an asset (SEV 100 general framework) or on the economic benefits resulting from its possession. Examples of the concept - the value of the investment, the special value, market value, or fair value are presented below in Fig. 2.
Fig. 2 Types of value and the price
Source: Developed by the author based on (600 GEV, 2015)
In a free competitive market, we are dealing with the market value, which reflects the best use of an asset; it maximizes its potential and is possible, legally permissible and financially feasible. The value resulting from the analysis and comparison of advantages/ disadvantages for the parties involved is a fair value; the investment value and the special value encompass the economic benefits from the ownership of the asset. The difference between the investment and the market value represents the motivation for buyers/sellers entering the market (200 IVS, 2015).
The expected market price should reflect the conditions of the relevant market, at the time of the assessment, not a corrected/ attenuated price, based on an alleged restorative balance.
In the case of listed companies, we analyze the market cap, the traded value, the liquidity rate (traded value /capitalization), as well as other indicators that reflect the company's value, such as:
The Price Earnings Ratio (PER or P/E) - based on the market capitalization of companies (on profit), expresses the number of years the investment in one share could be recovered from the issuing company; a small PER may indicate the stock is undervalued (Pasol, 2004). However, low-value PER does not automatically indicate undervalued stock, because some firms have no interest to report a big profit, to optimize costs; most Romanian companies rely on bank financing (banks look for companies with a solid financial situation - assets, equity, dues, etc.).
P/E index is used for comparisons: of similar issuers or from the same field, between two or more years (same company), comparisons with the average P/E of the market, etc. Investors begin to sell, when the PER of a share/ the price is too high for the company profit level, considering the action is overrated -over 20 or buy, when consider that the shares are undervalued - below 10 (Economica, 2012).
The price/ book value (P/BV) represents the amount that the shareholders would receive after paying all debt. In the balance sheet the book value is identified with the company equity. If P/BV is bigger than the unit, it means that the enterprise has created value for its shareholders as the investors would be
Value (opinion about)
Benefits Investment Value
Special Value
Price
Market Value
49 Vol. II │ No. │ May 6|
willing to pay more than the amount received from liquidation of assets; on the contrary, when P/BV <1, it means that part of the shareholders’ value was destroyed. In sectors with significant fixed assets P/BV is usually smaller (Tradeville, 2016).
Dividend yield (DIVY).
Bucharest Stock Exchange (BSE) calculates and distributes real-time price indices weighted with free float capitalization, with maximum weights of component companies:
BET reveals the developments of ten most traded companies on BSE, in terms of liquidity, transparency and communication with investors, among which OMV Petrom (SNP), for example, ranks third in this index -15.3% (BVB, 2016);
sectorial index BET-NG reflects the trend of companies listed on the regulated market of the energy field (72%) and utilities (28%), among which SNP has the largest share (28,84%), followed by Romgaz -SNP (BVB, 2016).
Method: direct comparison of relevant enterprises in the energy sector
This study represents a retrospective quantitative analysis of listed enterprises in the energy sector from Romania, and investigates relevant indicators such as: PBV, PER, DIVY, price evolution and performance of OMV PETROM S.A. The comparison also included three Romanian companies in the energy sector: S.N.G.M. ROMGAZ S.A., S.N.T.G.N. Transgaz S.A. and Transelectrica by the similar characteristics of the companies in the energy sector, listed at BSE.
When choosing this method, I have considered that by comparison, the estimated market value is obtained from the market analysis, based on the principle that an important buyer would not pay more than the amount by which it would purchase a comparable undertaking as profitability and risk; investors use such methods to analyse markets, making adjustments according to country risk, growth prospects, etc. (Pasol, 2004).
Results and discussion
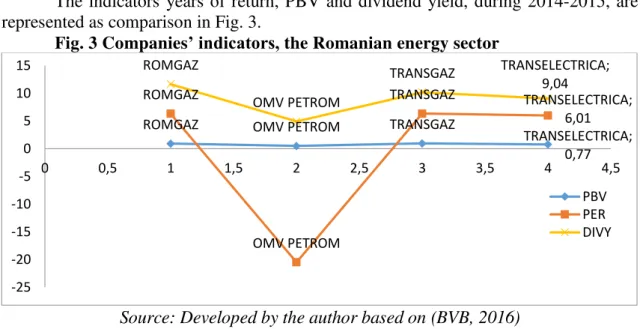
The indicators years of return, PBV and dividend yield, during 2014-2015, are represented as comparison in Fig. 3.
Fig. 3 Companies’ indicators, the Romanian energy sector
Source: Developed by the author based on (BVB, 2016)
ROMGAZ OMV PETROM TRANSGAZ
TRANSELECTRICA; 0,77 ROMGAZ
OMV PETROM
TRANSGAZ TRANSELECTRICA;
6,01 ROMGAZ
OMV PETROM
TRANSGAZ TRANSELECTRICA;
9,04
-25 -20 -15 -10 -5 0 5 10 15
0 0,5 1 1,5 2 2,5 3 3,5 4 4,5
50 Vol. II │ No. │ May 6|
SNP’ index PER has declined steep because of the company’ negative result. The average index resulted is far below the value PER industry profile (7.67) or the market (10.86), according to the data published (BVB, 2016). The small value of P/E may indicate heavily undervalued shares, in the case of the four companies.
Considering the high level of liquidity necessary for investments, that OMV Petrom proposed zero dividends for distribution will cause continuing deterioration of these indicators and PBV is far better than the sector’s (0.36), and in line with the market (0.8).
In addition, in the past two years, the evolution of BET and BET-NG decreased under the influence of SNP move. As the company explains its 2015 annual results, OMV Petrom has faced the steep drop in the global price of crude oil, refining overcapacity on the European markets, enhanced competition and legislative uncertainty (OMV Petrom, 2015).
Fig. 4 Evolution of SNP shares price during the period 2014-2016, comparison
Source: (BVB, 2016)
After annual increases of 11,21% p.a. in average for the period 2012-2014, BET index weakened; having a share of 15.3% in BET index, which registered a negative yield in 2015 (-1%), OMV Petrom (SNP) has a negative variation of -0.43% (BVB, 2016). Similarly, the BET-NG index registered a negative variation in 2015 (-14%) and still remains negative (BVB, 2016). The changes in the market and new information releases change the value, as demonstrated in Figure 5.
51 Vol. II │ No. │ May 6|
Fig. 5 The evolution of company shares, announcements and performance for OMV/PETROM S.A.
Source: (BSE, 2016)
We can observe the change in the share price and in performance, in conjunction with the important moments in the company history, but also the market fall in 2015, when the prices of crude oil fell by about 50%, while global demand for crude oil has increased by 1.8 per cent compared to 2014. The share price of the largest Romanian company listed according to capitalization (SNP) reached the maximum price at the end of august 2014, and after reached the minimum level of the year (OMV Petrom, 2015). In response to the 47% decrease in the average price of Ural crude oil (compared to 2014), the company made use of instruments for hedging risks to crude oil price, and EBIT2 indicator improved (OMV Petrom, 2016). The company announced that has reduced its costs, optimized investments, and revised estimates of crude oil price, which resulted in the depreciation adjustments of assets and a net negative result (OMV Petrom, 2015).
For the quantitative and qualitative analysis, we identified the characteristics of the enterprise: the geographical area in which they operate businesses included in the survey, turnover and its structure, the value and the structure of assets value, profit margins and growth prospects.
Quotations analysis of shares issued by similar enterprises listed on BSE involves calculating the multiplier (600 GEV, 2016) - that show the correlation between the market
52 Vol. II │ No. │ May 6|
value of the enterprise (shares) and the financial base, as for example, the ratio of market capitalisation/net profit, PER market, or market price/book value (P/BV). Analysis of the energy sector offers the possibility of finding the value of the enterprise, from the point of view of the market, of the market value. This value may indicate a possible undervaluation of shares, especially under the influence of the market of petroleum products.
Conclusions
Profit is essential to convince investors of company credibility, while companies turn to the capital market are in a position to report high profits. The enterprise value depends on its multiannual financial results and its market on which depends, so that at any given time, the value of the undertaking might be undervalued, or conversely, overestimated, favoring either savvy buyers or sellers.
Investors ' appreciation for a company is reflected by the stock price (the market value of the company), as well as the volume and value of transactions. The analysis of the shares issued by similar listed enterprises is usually reflected in multipliers (p/e or PBV) calculation which reflect the company’s profitability and signals over/ undervalued enterprise; at the same time, it represents an alternative to the traditional assessment methods (assets, financial performance) based on the financial statements (historical data), which should reflect the image of the company but does not register the brand's reputation, or goodwill.
Bibliography
1. ANEVAR (2015), Ghid de evaluare, Evaluarea întreprinderii. Editura ANEVAR: Bucharest.
2. ANEVAR (2015), Standardele de evaluare. Editura ANEVAR: Bucharest.
3. Bursa de Valori București (2016), BVB Raport lunar - MARTIE 2016. Available at: http://www.bvb.ro/press/2016/MARTIE%202016%20EXTERNAL_RO.pdf. Accessed on 05.05.2016.
4. Coralia, A. (2001), Dicționar de economie.Editura Economică: Bucharest.
5. Eisenhardt, K. M. (1989), Agency Theory: An Assessment and Review. The Academy of Management Review. Vol. 14, Nr. 1, pp. 57-74. Available at: http://www.jstor.org/stable/258191?seq=1#fndtn-references_tab_contents.
Accessed on 28.04.2016.
6. Ilie V. (2010), Gestiunea financiară a întreprinderii. Editura Meteor Pres: Bucharest. 7. Ionescu, A.(2012), Cele mai promițătoarea acțiuni la bursă pentru următoarele luni. Economica.net. Available at: http://www.economica.net/cele-mai-promitatoare-actiuni-la-bursa-pentru-urmatoarele-luni_38680.html#ixzz47o7r0jFk. Accessed on 05.05.2015.
8. Jensen, M. C. (2001), Value maximization, stakeholder theory and the corporate objective function. Journal of Applied corporate finance. Vol. 14, No. 3, pp. 8-21. Available at: http://onlinelibrary.wiley.com/enhanced/doi/10.1111/j.1745-6622.2001.tb00434.x. Accessed on 28.04.2016.
9. OMV Petrom. (2015), Raport anual. Bucharest. 10.OMV Petrom. (2016), Noutăți investitori. Bucharest.
53 Vol. II │ No. │ May 6|
12.Pasol, R. (2004), Cat de scumpe au ajuns acțiunile listate la BVB? Available at: www.kmarket.ro/documentare/arhiva/evaluareper.doc. Accessed on 05.05.2016. 13.Porojan D., B. C. (2002), Planul de afaceri: concepte, metode, tehnici, proceduri.
Casa de editură Irecson: Bucharest.
14.R. Edward Freeman, McVea, J. (2001), A Stakeholder Approach to Strategic Management. Darden Business School Working Paper no 01-02, Available at: http://papers.ssrn.com/sol3/papers.cfm?abstract_id=263511. Accessed on 28.04.2016.
15. Stancu I., B. L. (2015), Finanțe corporative (Vol. 1). Editura Economică: Bucharest. 16.Stancu, I. (2002), Finanțe. Editura Economică: Bucharest.
17.***http://www.bvb.ro/FinancialInstruments/Indices/IndicesProfiles.aspx?i=BET. Accessed on 05.05.2016.
18.***http://www.bvb.ro/FinancialInstruments/Details/FinancialInstrumentsDetails.a spx?s=SNG. Accessed on 05.05.2016.
19. ***http://www.economica.net/actiunile-omv-petrom-s-au-prabusit-cu-aproape-5prc-pe-bursa-la-cel-mai-redus-nivel-din-2011_112651.html. Accessed on 05.05.2016.
20.***http://www.investopedia.com/terms/a/agencycosts.asp. Accessed on 05.05.2016.