The Creative and Advanced Technology Economy in Brazil Executive Sumary
THE CREATIVE AND ADVANCED
TECHNOLOGY ECONOMY IN BRAZIL
Marco Aurelio Ruediger
Rafael Martins de Souza
Wagner de Oliveira
Bárbara Barbosa
October 27th, 2015
THE CREATIVE AND ADVANCED
TECHNOLOGY ECONOMY IN BRAZIL
Marco Aurelio Ruediger
Rafael Martins de Souza
Wagner de Oliveira
Bárbara Barbosa
October 27th, 2015
INTRODUCTION
The Brazilian economy is facing a series of structural challenges. Among these is the historic concentration of commodities in the range of Brazilian exports, something which recently has been aggravated by the decline of competiveness in Brazilian industry. In the near future, the change in China’s model of growth, Brazil’s largest commercial partner, which will no longer be based on investment and in which the consumption will have greater participation, will create some challenges.
It is likely that Brazil will reduce its basic products exports, notably iron ore. On the other hand, there is a possibility that Brazil will be naturally induced to increase the trade of semi-manufactured goods, with products derived from agriculture. Since these products naturally impose pressure on natural resources, forest and water, for example, there immediately arises the question: is this the best position to adopt?
Certainly not.
Given this scenario, it is urgently required for the state to come up with strategies that promote economic activities with greater added value. The aim should be to generate internationally competitive conditions for the production of goods and services which can also generate high quality employment, and which are not easily eliminated by the implementation of technology. Given these considerations, the Creative and Advanced Technology Economy can and should contribute in a decisive form so that this objective can be achieved.
As a result the creative economy and principally the advanced technology one should be at the center of the public debate about the future of the Brazilian economy. Since this industry professionals exercise intellectual and creative activities, they generate employment for highly qualiied professionals.These professionals are diicult to replace through technological change and make innovation the fundamental component for
sustained and long term economic growth.
PRINCIPAL NUMBERS
The numbers presented in this summary correspond to activities related to the Creative and Advanced Technology Economy (CATE). They are divided into four large groups in this document, namely:
Consumption: Publicity, Architecture, Design, and Fashion.
Culture: Cultural Expression, Heritage and Arts, Music, and Performing Arts.
Medias: Editorial and Audiovisual.
Technology: Research and Development (R&D), Information and Communication Technology
(ITC), and Biotechnology.
The number of professionals in the creative and advanced technology economy (CATE)
Between 2004 and 2013, there was a signiicant increase of 90% in the number of professionals involved in CATE related activities in Brazil, a rate signiicantly above that of the growth of the labor force in Brazil during the same period. In 2013 more than 892,000 professionals were employed in CATE.
SEGMENTS 2004 2013 GROWTH
Consumption 211,5 422,9 100,0%
Publicity 45,7 154,8 238,5%
Architecture 62,7 124,5 98,5%
Design 42,6 87 104,3%
Fashion 60,5 56,7 -6,3%
Culture 43,3 62,1 43,6%
Cultural Expressions 18,3 22,5 22,7%
Heritage and Arts 10,2 16,4 60,9%
Music 7,5 12 60,4%
Performing Arts 7,2 11,2 54,9%
Medias 64,2 101,4 58,0%
Editorial 27,8 50,8 82,5%
Audiovisual 36,3 50,6 39,1%
Technology 150,9 306,1 102,8%
R&D 82,2 166,3 102,3%
ICT 55,5 112,9 103,6%
Biotechnology 13,2 26,9 102,8%
Creative Industry 469,8 892,5 90,0%
The strong growth of the labor force is evidence of the dynamism of CATE related sector and the potential impact which can be generated in the Brazilian labor market by the expansion of this set of activities. The sectors which led the growth in the number of professionals were Publicity, with an impressive 238.5%, followed by Design, ICT, Biotechnology, and R&D and Biotechnology, with 104.3%, 103.6%, 102.8%, and 102.3%,
respectively.
The allocation of professionals in the diferent sectors of theCreative and advanced
technology economy
The consumption related activities were responsible for almost half the professionals working in CATE, accounting for 47.38% of this labor force. The Technology Sector was second in terms of the allocation of labor with 34.30% of professionals. While the technology group was the sector which had the second largest number
of professionals in CATE, the Research and Development sector in Brazil (R&D) had the most professionals working amongst all the sectors of CATE, with 166,200 people (18.63% of the total), while it grew by 10.23%
between 2004 and 2013. Figure 1 shows the percentage of professionals employed in each of the CATE sectors in the various groups.
FIGURE 1
ALLOCATION OF PROFESSIONALS IN THE DIFFERENT SEGMENTS OF THE CREATIVE ECONOMY
0% 10% 20% 30% 40% 50% 60% 70% 80% 90% 100%
Architecture Performing Arts Biotechnology Design Cultural Expression
Fashion Music R&D Publicity
Publishing
Editorial
Heritage and Arts ICT
The income of professionals in the creative and advanced Technology economy
In addition to the strategic importance of Research and Development, the income of the professionals in this activity is much higher than the rest, as can be observed in Figure 2. The average monthly salary of R&D professionals income was equivalent in 2013 to R$9,990, much higher than what the professionals in the other sectors received. After R&D, the sectors which most ofered remuneration above the CATE average were Architecture and ICT, with monthly salaries of R$6,927 and R$5,393, respectively.
6927
3157
4911
2760
1508 1412
2216
9990
5075
2364
3794 3721
5393
0 2000 4000 6000 8000 10000 12000
Monthly salary Average
Average: 5542
Architecture
Performing Arts Biotechnology
Design
Cultural Expression
Fashion Music
R&D
Publicity
Audiovisual Publishing
Heritage and Arts
ICT
FIGURE 2
AVERAGE REMUNERATION OF PROFESSIONALS FROM SECTORS OF THE CREATIVE AND ADVANCED TECHNOLOGY ECONOMY (R$)
Source: FIRJAN
On the other hand, the Fashion and Cultural Expression sectors are the ones which ofer the lowest
remunerations, in both cases the average earnings being lower than or close to R$1,500 per month. In the speciic case of the Fashion sector, some activities are exercised without the need for advanced qualiications, as is the case of the dressmaking, which certainly lower the average earnings of the
The geography of cate
The investigation of the allocation of professionals in CATE sectors among the various Brazilian states reveals surprising facts. Tocantins had the second highest percentage of CATE professionals allocated to Technology sectors, 42%, surpassed only by Rio de Janeiro, with 43%. To the contrary of the leader in this question, which
has a large number of schools and superior level research and teaching centers, Tocantins is the newest Brazilian state and does not have the same number of institutions.
The participation of CATE sectors linked to consumption is very high in all states, varying from 55% in Ceará to 35% in Tocantins, as can be seen in Figure 4. In addition to Ceará, the states of São Paulo and
Rio Grande do Sul are those in which half of CATE professionals work in sectors belonging to this group. 0 5 10 15 20 25 35 30 40 45 Average :31
RJ TO AM SE ES MG AC PA SP PE AP SC PR GO DF RN MA BA RS RO AL MT RR MS CE PI PB FIGURE 3
PARTICIPATION OF TECHNOLOGY PROFESSIONALS IN CREATIVE INDUSTRY % in relation to the total CATE professionals
4 3 4 2 ,1 3 7 ,7 3 7 ,4 3 7 ,4 3 6 ,3 3 4 ,8 3 4 ,7 3 4 ,7 3 3 ,8 3 2 ,4 3 2 ,2 3 2 ,1 3 1 ,2 3 1 ,1 3 1 ,1 3 0 ,5 3 0 ,1 3 0,0 2 8 ,6 2 8 ,1 2 7 ,4 2 7 ,1 2 5 ,6 2 1 ,5 1 9 ,5 1 9 ,3
As revealed in Figure 5, the Medias sector has a special weight in Rondônia, accounting for 26% of the total
CATE professionals in this state. The lowest numbers are found in the most important Southeastern states, São Paulo, Rio de Janeiro, and Minas Gerais with 9%, 10%, and 11%, respectively.
Average: 44 0 10 20 30 40 50 60
CE SP RS PR BA SC DF PB PI GO MG PE AP ES MS MT MA AL RR RJ RN PA RO AC AM SE TO
FIGURE 4
PARTICIPATION OF PROFESSIONALS FROM THE CONSUMPTION SECTOR OF THE CREATIVE ECONOMY % of total CATE professionals
5 4 ,5 5 0 ,8 4 9 ,9 4 8,0 4 7 ,5 4 7 ,3 4 7,0 4 6 ,9 4 6 ,3 4 5 ,9 4 5 ,7 4 5 ,7 4 4 ,9 4 4 ,2 4 2 ,4 4 2,0 4 1 ,3 4 1 ,3 4 1,0 4 0 ,5 4 0 ,5 3 8 ,5 3 7 ,6 3 7 ,3 3 7,0 3 5 ,3 3 5 ,1
Finally, Figure 6 contains data about the percentage of professionals allocated to the Culture sector. In all the richest Brazilian states the percentage of professionals working in this sector is less than 8%. The state of Paraíba is the one with the highest percentage of professionals in the culture sector, with 15%.
Average: 15 0 5 10 15 20 25 30
RO MS RR PB MT PA MA PI SE AL DF AM RN AC GO TO RS AP PR SC ES PE CE BA MG RJ SP
FIGURE 5
PARTICIPATION OF PROFESSIONALS FROM THE MEDIAS SECTOR OF THE CREATIVE ECONOMY % of total CATE professionals
Monthly salary Average
2 5 ,7 2 3,0 2 0 ,6 1 9 ,8 1 9 ,8 1 9 ,6 1 9 ,6 1 9 ,4 1 7 ,8 1 7 ,7 1 6 ,4 1 6 ,3 1 5 ,6 1 5,0 1 4 ,9 1 4 ,8 1 4 ,5 1 4 ,3 1 2 ,8 1 2 ,6 1 2 ,3 1 2 ,1 1 1,0 1 0 ,9 1 0 ,9 9 ,5 9,0
The protagonism of Technology professionals in the CATE scenario in Rio de Janeiro is relected in the income received by the professionals of this state. Rio de Janeiro leads the ranking of average income of CATE professionals, even surpassing the earnings of their colleagues in the Federal District and São Paulo, as can
be seen in Figure 7. On the other hand, Piauí and Ceará have the lowest remunerations. The case of Piauí is related to the fact that there is a very large proportion of professionals from the Culture sector in the total of CATE professionals in the state. In the case of Ceará the low remuneration can be explained by the large importance of the Fashion sector, which ofers low earnings.
Average 9,0%
14,
8
13,
9
13.0 13,0 12,8 12,8
11, 5 11, 3 10, 8 9, 5 9,0 9,0 8, 6 8, 5 8, 4
8,0 8,0 8,0
7, 8 7, 2 7, 1 7,0 7,0 6, 2 5, 6 5, 5 5, 5 0 2 4 6 8 10 12 14 16
PI PB CE AC AL RN BA RR MT SE AM MS MA PE AP GO RO TO SC PA MG PR RJ ES RS SP DF
FIGURE 6
PARTICIPATION OF PROFESSIONALS FROM THE CULTURE SECTOR IN THE CREATIVE ECONOMY % of total CATE professionals
6438 5307 4956 4234 3464 3923 3812 3403 3664 2908 3510 2820 3306 2831 3699 3137 2944 2023
2735 2899 2822 2839
2504 2329 1839 2543 2511 8682 6925 5851 5240 5127 5023 4875 4770 4721
4510 4506 4449 4413
4305 4246 4245
3943 3862 3809 3794 3668 3555 3437 3180 3046 2934 2853 0 1000 2000 3000 4000 5000 6000 7000 8000 9000 10000
RJ DF SP AM SE BA ES PA PE MA RN TO MG AP PR AC AL RO GO RS RR SC MS MT PB PI CE
2004 2013
FIGURE 7
AVERAGE MONTHLY REMUNERATION OF CREATIVE PROFESSIONALS PER STATE (R$)
Source: FIRJAN
Figure 8 shows the map of Brazil with the states colored in accordance with the proportion of professionals employed in the sectors of the Creative and Advanced Technology Economy in relation to total employees in the economy of each state. In 2013 São Paulo and Rio de Janeiro reairmed their leadership positions, as they are the only states with more than 2% of their labor forces working with CATE. Santa Catarina, Rio Grande do Sul, Distrito Federal, Paraná, and Minas Gerais form a second bloc, with between 1.5% and 2% of their labor
forces in creative activities.
Figure 9 shows the local Creative and Advanced Technology Economy quotient. This quotient is formed by
the proportion of CATE workers in a state in relation to the total number of workers of this state, divided by the proportion of CATE workers and the total number of workers in the country. This coeicient helps to
FIGURE 8
PROPORTION OF CREATIVE JOBS PER STATE, 2013
[0 , 1] [1 , 1.5] [1.5 , 2] [2, 2.5]
FIGURE 9
LOCAL CREATIVE AND ADVANCED TECHNOLOGY ECONOMY QUOTIENT, 2013
[0 , 0.6] [0.6 , 0.8] [0.8 , 1] [1, 1.4]
Another form of visualizing the importance of states and the distribution of CATE employment in states is shown in Figure 10. In this scatter plot, the vertical axis shows the total professionals who worked in CATE sectors, while the horizontal axis shows the local creative economy quotient. This form of visualization allows a perception at the same time of which states ofer more work opportunities in CATE in absolute terms and
which are the states that have a higher proportion of their labor forces working in CATE than the national average.
As expected, the state of São Paulo by far leaders the ranking of the states which generate employment opportunities in CATE sectors in absolute terms, followed by Rio de Janeiro and Minas Gerais. It also leads the ranking as a creative economy center, followed closely by Rio de Janeiro and, with a little more distance, by the states from the south of the country, Minas Gerais, and the Federal District. Finally, the states of São Paulo, Rio de Janeiro, Santa Catarina, and Rio Grande do Sul are in the superior quartiles in relation to the number of
absolute jobs, and the local creative economy quotient.
FIGURE 10
CREATIVE ECONOMY CENTERS
Employment in the Creative Economy
Thousands
Source: FIRJAN
SP
RJ MG
RS PR SC BA
GO
0 50 100 150 200 250 300 350 400
0,00 0,20 0,40 0,60 0,80 1,00 1,20 1,40 1,60
Local creative economy quotient
Top states in terms of local CATE quotient
Top states in terms of employment in CATE
Cate entrepreneurial cities
There is little data available about the importance of CATE in Brazilian municipalities. Even if there is no document speciically constructed to deal with this subject, one of the few documents which can provide
some data about this is the Entrepreneurial Cities Index, produced by Endeavor in 2014. For example, Figure 11 shows the percentage of workers involved with functions linked to science, technology, engineering, and mathematics in 14 Brazilian state capitals. Salvador and Vitoria, with 7.3% and 7.1%, respectively, are the only cities with more than 7% of their labor force involved in these activities. On the other hand, Fortaleza and Brasilia, with 3.3% and 4.2%, are the selected capitals with the lowest proportion of professionals working in
these sectors.
FIGURE 11
PERCENTAGE OF STEM WORKERS IN RELATION TO TOTAL WORKERS
3,32
4,21 4,54
4,63 4,74 4,75
5,2 5,51
5,66 6,04
6,29 6,47
7,13
0 1 2 3 4 5 6 7 8
Fortaleza Brasília Recife Curitiba Manaus São Paulo Porto Alegre Belo Horizonte Rio de Janeiro Brasília Florianópolis Belém Vitória
7,25 Salvador
International comparison
Understanding the position of Brazil in relation to other countries in the world in terms of the environment for the development of the creative economy concerns the capacity to analyze the possibilities for Brazil to act so that it will be possible to trace out a strategy to insert and maintain the country in the map of the creative economy. The aim of this global perspective is to guarantee that it will be possible to direct the economic development of the country in order to introduce a strategic sector to generate wealth, and as a result to stimulate economic development.
Figure 12 shows the wealth generated by the creative economy in the GDP of European countries in 2003 and in Brazil in 2009. The added value consists of the diference between the gross value produced in the sector and intermediate consumption. In the case of Brazil, the creative economy generated 1.1% of the total GDP, below the average of 1.94%, of the added value generated by European economies in the same year.
3,4 3,2 3,1 3,1 3,0 2,7 2,6 2,5 2,4 2,4 2,3 2,3 2,3 2,2 2,0 1,8 1,8 1,7 1,7 1,4 1,4 1,2 1,2 1,2 1,1 1,0 0,8 0,7 0,6 0,2
0 0,5 1 1,5 2 2,5 3 3,5 4
Itália França Noruega Finlândia Dinamarca Reino Unido Holanda Bélgica Alemanha Suécia Estônia Espanha República Checa Eslovênia Eslováquia Latvia Áustria Lituânia Irlanda Romênia Portugal Bulgária Polônia Hungria Brasil (2009) Grécia Chipre Islândia Luxemburgo Malta FIGURE 12
In the direct comparison with the selected European countries, Brazil only beats Greece, Cyprus, Iceland, Luxemburg, and Malta. The data also suggests that there is signiicant space for the development of CATE in Brazil. For example, the leader of the ranking, France, has 3.4% of its GDP generated by CATE, more than three times the percentage of Brazil. After France, comes Norway, Finland, Denmark, and the United Kingdom, all with 3% or more added value generated in GDP by CATE.
Brazil and the international creative and advanced technology Economy market
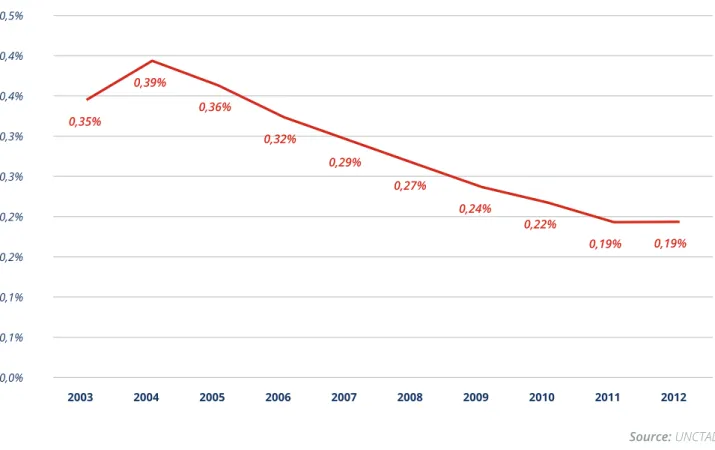
As can be seen in Figure 13, Brazil’s share in the internal creative goods and technology market has fallen. The percentage of Brazilian exports of these goods in relation to the total exports in the rest of the world fell from around 0.39% in 2004 to 0.19% in 2012, the most recent year for which data is available.
Figure 14 shows the percentage variation of exports between 2003 and 2012. This igure suggests that the growth of Brazil’s involvement in the international market is closer to what occurs in the developed countries than in the developing ones. This is not exactly good news, since the performance of the latter is better than the former.
0,35%
0,39%
0,36%
0,32%
0,29%
0,27%
0,24%
0,22%
0,19% 0,19%
0,0% 0,1% 0,1% 0,2% 0,2% 0,3% 0,3% 0,4% 0,4% 0,5%
2003 2004 2005 2006 2007 2008 2009 2010 2011 2012
FIGURE 13
PERCENTAGE OF BRAZILIAN EXPORTS OF TOTAL GLOBAL EXPORTS OF CREATIVE AND ADVANCED TECHNOLOGY GOODS
Although the consolidated numbers have little solace for our exports, there are sectors which have had signiicantly expressive results. For example, this can be seen in Figure 15 and Figure 16. The participation of Brazilian New Media exports in relation to total global exports of these products has grown from 0.01% to 0.27% in only six years. The Visual Arts, despite an oscillation from 2009 - 2012, increased by 0.8% from
2003 - 2012. FIGURE 14
PERCENTAGE VARIATION, IN RELATION TO PREVIOUS YEAR, OF TOTAL EXPORTS OF CREATIVE AND ADVANCED TECHNOLOGY GOODS
World Developing Economies Developed Economies Brazil
12,72 11,43 22,93 23,62 -18,76 18,33 32,84 -7,16 20,10 17,92 12,87 40,86 5,01 35,12 53,50 20,77 12,73 9,24 10,46 35,40 -34,01 7,63 18,82 -25,67 32,01 3,22 -4,11 6,15 6,15 -28,36 2,12 5,25 -3,64 -40 -30 -20 -10 0 10 20 30 40 50 60
2004 2005 2006 2007 2008 2009 2010 2011 2012
4,42 15,75
11,93
0,49%
0,57%
0,52%
0,46%
0,43%
0,40%
0,32%
0,29%
0,22%
0,22%
0,01% 0,01% 0,02%
0,01%
0,05%
0,11%
0,18%
0,22%
0,24% 0,27%
0,0% 0,1% 0,2% 0,3% 0,4% 0,5% 0,6%
2003 2004 2005 2006 2007 2008 2009 2010 2011 2012
Craftwork Audiovisual Design New media
FIGURE 15
PERCENTAGE OF BRAZILIAN EXPORTS OF TOTAL GLOBAL EXPORTS OF CREATIVE AND ADVANCED TECHNOLOGY GOODS (SELECTED SECTORS)
Employment in the Creative Economy
Thousands
Employment in the Creative Economy
Thousands
0,08% 0,11%
0,11%
0,14%
0,11%
0,07%
0,05%
0,08%
0,03% 0,03%
0,06%
0,07%
0,06%
0,07%
0,08%
0,09%
0,19%
0,11%
0,21%
0,14%
0,0% 0,1% 0,1% 0,2% 0,2% 0,3%
2003 2004 2005 2006 2007 2008 2009 2010 2011 2012
FIGURE 16
PERCENTAGE OF BRAZILIAN EXPORTS OF TOTAL GLOBAL EXPORTS OF CREATIVE AND ADVANCED TECHNOLOGY GOODS (SELECTED SECTORS)
Performing Artist Publishing Computer Equipments Visual Arts
Policy implications
The irst conclusion that can be drawn from this document is that the data and statistics available to understand Creative and Advanced Technology Economy in Brazil are still insuicient for understanding the sectors which compose it. More eforts are required to obtain and analyze data for the construction of documents
which allow the question be assessed in depth and which can assist in decision making by the relevant public agencies. For example, there are CATE centers in Brazil which cannot be duly mapped and analyzed due to the non-existence of capillarity data which can allow this level of regionalization.
As a result a plan for the strategic attraction and retention of CATE researchers and entrepreneurs is required, principally those whose activities are related to technology and innovation. The crisis that Europe has been undergoing means that since the beginning of the decade various highly qualiied professionals have become
more likely to accept work opportunities in countries such as Brazil.
There is space for the development of the entrepreneurial potential of researchers based in research institutions. As was recently published by the World Intellectual Property Organization (WIPO), Brazil is badly
placed on the ranking of patent and other intellectual property registers constructed by this institution. The construction and expansion of universities throughout Brazil in recent years should have an impact on the quantity, quality, and spatial spread of this type of registration.
Also necessary is an improvement in the access of researchers and entrepreneurs to the mechanisms of intellectual property registers. The National Intellectual Property Institute (Instituto Nacional de Propriedade Intelectual - INPI), the agency responsible for the registration of intellectual property in Brazil, is recognized for the delay with which it carries out registrations. According to the data from the National Association of Innovative Venture Promotion Agencies (Associação Nacional de Entidades Promotoras de Empreendimentos
These regional potentials are little explored. For example, Brazil possesses various ecosystems which deserve to be carefully studied. The implementation and expansion of biotechnology research centers should be done in a strategic form, with the aim of exploring the potential to generate new products and patents through the biodiversity of these regions. Moreover, these centers shall be able to make local economies more dynamic with the attraction and retention of highly qualiied persons with high incomes.
In some sectors such as Fashion, design and product creation should be privileged, to the detriment of activities which demand less qualiied activities. This can be done through the promotion of training courses, for both
Future work
DAPP/FGV is already carrying out research in various areas, which it intends to develop further:
• Understanding the Creative and Advanced Technology Economy in the BRICS
This initial study has to be expanded to allow a better territorial comprehension of the Creative Economy in Brazil. The available data only allows state level actions or in some state capitals to be seen. It is very important to understand and promote initiatives which occur in states with lower economic representativeness and cities in the interior. This can also be done, using the same methodology and profundity, with the other BRICS.
• Understanding how the transfer of innovation and technology between the BRICS countries can be strengthened
There are various barriers which have to be breached for greater integration among the BRICS. In addition to the enormous continental expansion of Brazil, Russia, China, and India, other geographic barriers exist, as these countries are located in diferent continents. Notwithstanding the strong growth of international trade with China observed since the middle of the 1990s, there is a low history of exchanges of professionals, pro -ducts, and services among the BRICS countries. In order for this bloc to carry out more efective joint actions, it is important that mechanisms be studied and implemented to generate greater ‘bottom up’ interaction of professionals and researchers.
• Investigate and promote how creative and advanced technology products and services produced in
the BRICS can be exported to developing countries
Many solutions which can ofer good results in the BRICS can be applied in other developing countries or ones with late development. DAPP/FGV believes that there are great opportunities to promote economic and social growth through the replication of its studies and solutions in these countries. From the strategic point of view this can will help to with the next step.
• Stimulate the export of creative products and services to the developed countries
REFERENCES
Bakhshi, H., Davies, J., Freeman, A. e Higgs, P., The Geography of The UK’s Creative and High-Tech
Economies, Nesta, January 2015, London.
De Oliveira, João Maria, de Araujo, Bruno C., Silva, Leandro Valério, Panorama da Economia
Criativa no Brasil, IPEA, 2013.
Índice de Cidades Empreendedoras – Brasil, Endeavor Brasil, 2014.
Mapeamento da Indústria Criativa no Brasil, Federação da Indústrias do Estado do Rio de Janeiro,
FIRJAN, dezembro de 2014.
World Intellectual Property Indicators, Economics and Statistics Series, World Intellectual Property
Organization, 2014.
UNCTAD – United Nations Conference on Trade and Development. Statistics on world trade in creative