GV
PESQUISA
T
HE
E
FFECT OF
G
UIA
E
XAME
’
S
R
ATINGS
ON THE
B
RAZILIAN
F
UND
I
NDUSTRY
:
A
N
A
NALYSIS OF
N
ET
-W
ORTH
F
LOWS
Relatório 08/2008
W
ILLIAM
E
ID
J
R
.
R
ICARDO
R
OCHMAN
FGV-EAESP/GVPESQUISA 2/13
The Effect of Guia Exame’s Ratings on the Brazilian Fund Industry:
An Analysis of Net-Worth Flows
William Eid Jr.i
Ricardo Rochmanii
Mônica Carvalhoiii
Abstract
This paper infers the impact the publication “Guia Exame” (the guide) has on the Brazilian
fund industry, more specifically on the ability the concerned funds develop on attracting new
investment. The impact is measured using the event-study analysis based on the variation of net
worth subsequently to the event of being rated, according to the methodology applied by the
guide to rank the funds. We used five years of fund ratings according to Guia Exame (2000-2004)
and analyzed the changes of these funds’ net worth. We also compared the event amongst
different categories of funds. The results found confirm the expected effects according to star
rankings and asset manager size in all years.
JEL classification: G11, G14, G20
Key words: event-study, mutual funds, asset flow, fund ratings.
FGV-EAESP/GVPESQUISA 3/13
i. Introduction
The “Guia Exame” (the guide) compiles a mass of information provided to investors once a
year on the middle of August since 1996, with a circulation of approximately 160,000 copies and
directed to a business-oriented public. It assigns ratings that range from one to five stars, giving
an idea of how past performance evolved along the observed period according to different
performance measures. Apart from the ratings, the most recent editions provide more detailed
information such as fund distributors, asset classes, net-worth (in Brazilian Reais and US
dollars), asset manager, asset management company and past fund returns in the period.
The guide publishes the ranking of one thousand funds positioned in different fund
categories related to the risk associated with the fund. It has been published in the past nine
years; ranking funds by number of stars, being the 5-star funds considered the top performers
and the one star-fund the laggards. It covers the relevant sample of funds in the Brazilian
market, being excluded the ones that are not open to new investment as well as the so-called
“exclusive funds” that are created exclusively for just one or a few investors.
The objective of this paper is to identify the impact the publication “Guia Exame” has on the
ability of the funds ranked by this magazine to attract new investment. Through the analysis,
we also explore the mechanism governing investment decisions of economic agents. In other
words, the identification of any sort of impact this publication has over the amount of resources
directed to any specific category of funds is an indicative factor of investor’s behavior.
We start by depicting related literature, which are basically publications about
Morningstar® Mutual Funds™ FundInvestor, which is a reference guide focused on the
American Fund Industry, once we have not identified any research specifically about the
Brazilian industry. After the related literature, the sample data is described and then the
methodology employed, which slightly differs from previous works that has been published on
Morningstar, as in Guercio and Tkac (2001), given the need to adapt to the characteristics of the
Brazilian fund industry. We proceed with the results analysis and then present our
FGV-EAESP/GVPESQUISA 4/13
ii. Related Literature
We based our research on a number of dedicated papers about event studies methodology
as well as on specific fund industry and fund rating systems. The work of Campbell, Lo e
Mackinlay (1997) describes the event-study methodology. The most common use of this
methodology is to examine the effect of some event or set of events on the value of assets, and
to infer an unexpectedly large increase or decrease relative to standard deviation of “typical”
changes. According to them, the most common application of event studies is to study firms
stock prices, however there are applications also in exchange rates behavior analysis (Brooks
and Kwok (1990)) and bond prices. There are, as far as we know, no similar studies in related
literature
Blake and Morey (1999) perform an analysis of the impact of the Morningstar ratings on
mutual funds performance. The objective of that work was to measure predictability of
Morningstar five-star system over fund performance, through the analysis of a data set of funds
at the time they were rated by Morningstar. The authors circumvent funds survivorship bias,
adjust for sales fees charged by distributors, and compare returns according to naïve
alternatives (historical average of monthly returns) analyzing different time spans (to allow for
short and long term analysis to be consistent also with investors target horizons). Analogous to
our work, theirs was conducted through parametric and non-parametric tests. The type of
analysis developed differs from what we performed in our study, however the characteristics of
the American fund industry as well as the longer term existence of the Morningstar ratings
allow for specificities that our data base still lacks. Moreover, the core of the analysis is based on
funds returns, whilst in our case the study focused on net-worth evolution.
Guercio and Tkac (2001) apply event-study methods on a sample of 3,388 equity mutual
funds from November 1996 to October 1999 and find that that the Morningstar ratings have a
significant effect on fund flows, with 5-star funds receiving flows above normal and
downgraded funds losing money beyond what would normally be expected.
Morey (2003) performs a study of the effects of Morningstar mutual fund ratings on future
fund performance, strategy, risk-taking, expenses, and portfolio turnover. The research reaches
interesting results, finding that three years after a fund received its initial 5-star rating, fund
performance severely falls off. It is also found that after receiving their initial 5-star rating, the
risk levels of funds rise and that the funds are not able to load on momentum stocks as well as
FGV-EAESP/GVPESQUISA 5/13
they did before receiving the 5-star rating. The conclusion is that the rating event is usually
followed by a period when managers are not able to keep up the same performance and risk
control levels, implying in impoverished results – which points out to a further use of the
Morningstar reports, indicating that in some cases a good rating may represent a “kiss of
death”.
iii. Sample Data
The data used encompassed the past four editions of the guide, from 2001 to 2004, even
though there are published editions as back as 1996. It was not possible to use information prior
to the year 2001 guide, given data inconsistencies amongst the years: differences in the currency
base and too broad figures defining the funds net-worth. In this study the 1000 funds that were
published in the guide were then divided according to the star rankings, which we analyzed
separately.
The number of funds included in each category sample varies slightly due to discontinuities
in ANBID data base, which includes all sort of existing data on the investment funds industry
in Brazil, and it is the main source of financial information about the funds in this study. There
are also issues such as fund name change, asset management firm mergers and acquisitions as
well as funds that may close after the event analyzed which do have an impact on the quality of
the data used, even though we believe that major distortions have been stripped out. In the case
of mergers, we assumed that investors re-invest the funds immediately after the event, while in
the case of liquidation it is assumed that investors re-invested the proceeds in similar funds
immediately. However, we did not extend the analysis to the fund level, but to the samples
formed according to the above mentioned categorizations. Most samples were smaller than 30
funds by category.
For the elaboration of the guide, the criteria for fund analysis are quite detailed, selecting
them according to a set of parameters. To be eligible to the guide the fund must be listed in the
ANBID – Brazilian National Association of Investment Banks data base for at least 12 months
with daily data and fulfill the following requirements:
1. It cannot be a pension fund, offshore fund, privatization or a principal guaranteed fund;
FGV-EAESP/GVPESQUISA 6/13
“mirror” fund (a fund constituted by one institution with the purpose to distribute FIFs from third parties);
3. It cannot be free of administration and performance charges concomitantly;
4. It must be open to investment and be amongst the one-thousand biggest net-worth funds in the industry;
5. Net-worth should not show excessive movements just before the ranking closing date (there is a specific methodology defined by the authors of the guide to determine what are considered “excessive movements” prior to the rating closing date).
In the guide the selected funds are then separated according to their ANBID category, and
then between wholesale and retail funds. Subsequently, the funds are analyzed according to
their nature: active or passive, and then respectively scrutinized according to the Generalized
Sharpe Ratio (Sharpe, 1994) or according to average square minimum errors. The benchmarks
used are the IBOVESPA (São Paulo Stock Exchange Index), the IBX (another São Paulo Stock
Exchange Index), PTAX-800 (Brazilian Reais to US dollar exchange rate) and the CDI (Brazilian
inter bank deposit certificates, which is a proxy for fixed income markets base rates). The
“stars” are given to funds according to the ranking of 10% top performance funds that are
granted five stars, the next 15% receiving four stars and three, two and one stars being given to
the next blocks of 25% of all funds listed. All funds with a negative Generalized Sharpe Ratio
receive automatically one star.
Our analysis was performed in four stages, in order to explore different categorizations. We
first analyzed the funds according to the stars assigned by the Guia Exame and then according
to four asset classes: fixed income, equity, multi-market and balanced funds (mostly hedge
funds) and others (all funds that could not be assigned to one of the other categories). Next, we
inferred possible effects associated with size (splitting the whole industry into big,
medium-sized, small and “boutiques”), and then by fund size (now splitting the fund sample by net
worth in big, medium, small and very small) type of investor (retail and wholesale. We
organized the tests according to the below described segmentation:
1. Star ranking (one to five stars) by Fund Category (fixed income, equity, multi-market and others);
2. Star ranking by Asset Manager size (less than R$15m, between R$15m and R$50m, between R$50m and R$500m, and above R$500mm of assets under management.);
FGV-EAESP/GVPESQUISA 7/13
4. Star ranking by Fund Category by type of client: wholesale or retail according to the Guia Exame criteria.
iv. Methodology
In our research, we chose the event study methodology to infer the impact of fund rankings
on the increase or decrease in net-worth of the funds ranked by the guide, according to the
number of stars granted each year. We analyzed the average investment flow after the guide
publication, comparing to the average flows measured before the event. The goal was to infer
the response investors give to objective information provided by the guide. To infer the pace of
investor’s response, we performed a sensitivity study according to the estimation window
period length, inferring differences between three-month and six-month spans. The nature of
response was also analyzed: whether results came in the expected direction, with three, four
and five-stars funds receiving investment flows, and two and one stars funds losing investment
flows comparing the periods before and after the event.
According to Dwyer (2001) what is crucial to perform an event study is to determine the time
spans to be considered before and after the event, as well as the event window or the period over
which the event occurs. The event window is a specific event, which can be the announcement of
stock splits, earning announcements, merger or takeover announcements, regulatory changes
affecting firms. In short, what makes something an event is some change, development,
announcement that may produce a relatively large change in the price of the asset over some
period. The second step required, after setting the event window, is to define an estimation
window, or the period over which parameters are estimated. The information estimated from the
estimation window will be compared to the results obtained from the post-event window, where
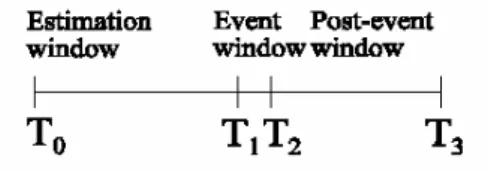
we should capture the possible effects from the event. According to Campbell, Lo and Mackinlay
(1997), the time periods needed to perform an event-study are:
• (T0...T1) is the estimation window;
• (T1...T2) is the event window;
FGV-EAESP/GVPESQUISA 8/13
Figure 1. Event-study time windows.
In this paper, the event window is the month in which the rankings announcement took
place (August, each year). The estimation window was defined first as three months and after
as six months prior to the announcement and the post-event window covers three months after
the event and then six months after it.
The variable chosen is the net-worth of each fund considered along the study period from
2000 to 2004. We estimated the monthly average of each fund’s net-worth and then stripped out
the return of the funds shares in order to isolate net new investment. We took the last working
day of each month to compose the series of net-worth relative changes. In our study, the
estimation window was set in two different stages, three and six months prior to the event,
mirroring the three and six months after the event that were set as post-event windows. We
used the following equation to infer net new investment (net variation on each fund’s net
worth):
NWt+1 Net New Investment =
-Quota (t+1) Quota (t)
x Average NW (t , t+1)
NW t Net New Investment =
-Quota (t+1) Quota (t)
x Average NW (t , t+1)
NW t
Equation 1. Estimation of the net new investment received/lost by the fund
Where NWt is the net-worth of the fund at time t, Quotat is the value of one quota of the
fund at time t, and Average NW is the average net-worth of the fund between times t+1 and t.
According to Mackinlay (1997) the most common application of event studies is to analyze
stock returns; hence the Capital Asset Pricing Model (CAPM) and the market models are largely
used to establish benchmarks for expected returns. Different choices for modeling normal
return are mentioned, being the two most common ones the constant-mean-return model
(where the average return is, in a self-explanatory way, constant) and the market model, which
assumes a stable linear relation between the market return and the security return. In our study,
FGV-EAESP/GVPESQUISA 9/13
valuation of a stock in the market and the analysis of its returns. The next step defined is then to
establish the return due to the event, identifying what is to be considered an abnormal return.
Campbell, Lo and MacKinlay (1997) define normal return as “the return that would be expected
if the event did not take place”. I this study we define the normal return, or the expected
change in the net-worth of the funds the change in the net-worth of the whole sample of a
thousand funds in the guide. The abnormal return is the difference between the change in the
net-worth of the fund and the expected change of the net-worth of the whole sample.
We performed our analysis through Wilcoxon tests to infer the significance of a difference
between two normally distributed averages, through which we perform a hypothesis test of
quality of two population medians. We discarded small sub samples with less than 15 funds.
v. Research Results and Analysis
In this section, we describe the results found in the tests performed. We considered as
“expected” all significant results (at 5% and 10% significance levels) in the three-star and above
rated funds.
The results for all the tests we conducted were almost the same: we did not find any clear
evidence of impact from the Guia Exame on the fund’s net worth. Table 1 above shows the
results when we tested for the impact due to the star ranking. Year by year and ranking by
ranking the table shows the p-value for each test. The grey cells shows results statistically
significant (at a minimum of 10% level) against our expectations, the yellow ones results again
statistically significant at a minimum of 10% level according to what we expected. The numbers
bellow n is the sample size.
Table 1
Year
n 3 months 6 months n 3 months 6 months n 3 months 6 months n 3 months 6 months n 3 months 6 months
91 83.69% 2.41% 133 89.73% 36.48% 176 5.50% 35.43% 123 0.34% 1.47% 394 0.01% 0.00%
n 3 months 6 months n 3 months 6 months n 3 months 6 months n 3 months 6 months n 3 months 6 months
104 84.32% 0.15% 144 22.84% 14.43% 189 1.30% 41.98% 166 45.00% 7.11% 323 76.41% 45.96%
n 3 months 6 months n 3 months 6 months n 3 months 6 months n 3 months 6 months n 3 months 6 months
92 42.25% 11.04% 136 36.39% 16.25% 181 0.10% 1.73% 111 0.06% 2.48% 361 4.50% 4.53%
n 3 months 6 months n 3 months 6 months n 3 months 6 months n 3 months 6 months n 3 months 6 months
100 80.98% 3.72% 139 90.29% 1.32% 183 0.08% 49.82% 103 14.32% 5.15% 378 0.00% 0.00%
2001
1 star
2004
2003
2002
FGV-EAESP/GVPESQUISA 10/13
The first thing to note is that we had a few significant results. From a total of 40 tests, only 21
were significant or 53%. And only 10 according to our expectations and 11 against it. It’s
impossible to derive a clear trend here.
Similar results are shown in table 2. The tests here are related to the sample split in retail and
wholesale clients.
Table 2
Year
Stars n 3 months 6 months n 3 months 6 months
5 37 13.33% 72.29% 54 15.67% 0.43%
4 52 71.57% 45.52% 81 91.56% 13.49%
3 45 2.23% 5.72% 131 35.34% 93.96%
2 18 0.74% 9.36% 105 3.06% 4.77%
1 214 0.00% 0.00% 180 0.00% 0.00%
n 3 months 6 months n 3 months 6 months
5 36 22.64% 30.72% 68 59.08% 0.17%
4 46 33.91% 59.62% 98 37.47% 13.34%
3 51 44.21% 72.17% 138 1.59% 26.77%
2 33 4.63% 44.76% 133 95.43% 11.41%
1 145 88.31% 0.91% 178 28.08% 34.03%
Stars n 3 months 6 months n 3 months 6 months
5 22 8.24% 5.75% 70 91.84% 51.03%
4 43 3.46% 24.64% 93 77.53% 37.30%
3 80 0.08% 1.33% 101 20.34% 28.06%
2 65 0.34% 10.72% 46 5.95% 12.48%
1 212 0.00% 0.00% 149 5.70% 4.13%
Stars n 3 months 6 months n 3 months 6 months
5 38 79.97% 35.71% 62 60.14% 5.00%
4 56 57.91% 1.04% 83 57.65% 26.40%
3 81 2.71% 78.30% 102 1.28% 56.92%
2 56 33.17% 87.68% 47 54.64% 1.68%
1 231 0.00% 0.00% 147 1.29% 55.92%
Retail Wholesale
2004
2003
2002
2001
From the total tests, only 41% were statistically significant at a minimum level of 10%. And
only 17,5% according to our expectations. Again we conclude that there’s no tangible effect
from the Guia Exame on fund’s net worth.
Due to lack of space we are not going to show the other tables. But the results are quite
similar. After testing for asset classes, asset management size, fund size, asset classes and fund
FGV-EAESP/GVPESQUISA 11/13
We also conducted tests changing the sample control. Instead of the weight average of
fund’s we use an arithmetic average and also no control. The results remain.
vi. Conclusion
When organizing the data for statistical testing we sought after possible combinations that
could point out to relevant niches that could or not point to an effect of the guide’s publication
on the funds net-worth. As a focused marketing tool, the guide is expected to cause an impact
on the specific public that it can tackle. Likewise, there are market niches which are potentially
yet-to-be developed.
We did not found clearly impacts from the Guia Exame over the fund’s net worth. Including
when we run tests over more refined segmentations, combining star rankings and client type
with fund size and investment classes. The results found point to the inexistence of defined
trends.
The main conclusion is that the average investor does not decide were to invest based on the
Guia Exame. But we have to deal with the results with care. It’s important to remember that the
sub samples with less than 15 funds were discarded. And our first felling is that on the small
funds in small asset management companies the Guia Exame has his great impact. But we could
not test it. And this can be one of the reasons of our pour results, instead of the investor’s
decision process.
We believed that this piece should be continued by further research focused on the very
small samples. We can also focus on fund performance and stability after the rankings,
FGV-EAESP/GVPESQUISA 12/13
vii.References
1. BLAKE, C., MOREY, M. “Morningstar Ratings and Mutual Fund Performance”, March 1999
2. BROOKS, L.D., KWOK, C.Y. “Examining Event Study Methodologies in Foreign Exchange
Markets”, Journal of International Business Studies, v.21, 1990.
3. CAMPBELL, J.Y., LO, A.W., MACKINLAY, A.C. The Econometrics of Financial Markets,
Princeton: Princeton University Press, p.149-180, 1997.
4. DWYER, G.P. Jr., “The Use of Event Studies in Finance and Economics”, University of Rome at Tor Vergata, fall, 2001.
5. GUERCIO, D. Del, and TKAC, P.A. “Star Power: The effect of Morningstar Ratings on Mutual Fund Flows”, Reserve Bank of Atlanta, Working Paper, n.15, 2001.
6. MACKINLAY, A.C. “Event Studies in Economics and Finance”, Journal of Economic Literature, march, 1997.
7. MOREY, M. “The Kiss of Death: A 5-Star Morningstar Mutual Fund Rating?”, Working Paper, september 2003. In <http://ssrn.com/abstract=455240> accessed in February, 2nd, 2005.
FGV-EAESP/GVPESQUISA 13/13