online | memorias.ioc.fiocruz.br Leishmaniasis remains a serious public health
prob-lem. It is endemic in 88 countries and affects 12 million people worldwide. The visceral form, caused by Leish-mania donovani and Leishmania chagasi, is prevalent in tropical and subtropical regions, with 90% of cases occurring in Bangladesh, Brazil, India, Nepal and Su-dan (Desjeux 2001, Goto & Prianti 2009, Verma et al. 2010). Leishmania infection may be asymptomatic, oli-gosymptomatic or progressive and the most severe cases result in splenomegalia, fever, pancytopenia, hypergam-maglobulinemia and weight loss (Badaro et al. 1986). During active visceral leishmaniasis, parasites replicate within mononuclear phagocytes in the spleen, liver and bone marrow; disease can be fatal if the infection is not treated (Goto & Prianti 2009).
Protective immunity is associated with efficient cel-lular responses and the production of cytokines such as interleukin (IL)-12, interferon (IFN)-γ and tumor necro -sis factor (TNF)-α (Pinelli et al. 1995, Dye 1996). Ini -tially, after promastigote phagocytosis, dendritic cells and macrophages release IL-12, which stimulates natural killer (NK) cells to secrete large amounts of IFN-γ. IL-12 induces the differentiation and proliferation of CD4+
Th1 cells populations, which produce more IFN-γ (Cun -ningham 2002). IFN-γ is responsible for activating mac -rophages to produce TNF-α, which, in synergism with IFN-γ, increases phagocytosis and induces macrophage leishmanicidal activity through the production of nitrogen and oxygen metabolites (Belosevic et al. 1989, Bodgan et al. 1990, Liew et al. 1990, Theodos et al. 1991, Ray et al. 2000, Wilhelm et al. 2001, Cunningham 2002). On the other hand, susceptibility to leishmaniasis is associated with a Th2 type immune response, characterised by the predominance of the humoral response and the production of cytokines, such as IL-4 and IL-10 (Agnello et al. 2003, Sharma & Singh 2009). Immunoregulatory mechanisms, which favour pathogen resistance, immunopathologic control and the establishment of chronic infection, occur when another population of cells, referred to as Tregs, is activated. Tregs produce immunosuppressive cytokines, such as IL-10 and transforming growth factor (TGF)-β, and are responsible for regulating Th1 and Th2 responses (Belkaid et al. 2002, Gantt et al. 2003, Suffia et al. 2006, Nylén et al. 2007, Sharma & Singh 2009).
At present, the Th1 and Th2 paradigm is being recon-sidered following the discovery of a novel lineage of ef-fector CD4+ Th cells called Th17 cells, which produce IL-17A and F, IL-21, IL-22, IL-23, IL-26 and TNF-α (Dong 2008, Guedes et al. 2010). Th17 cells have been associated with the pathogenesis of several autoimmune and inflam-matory diseases, such as psoriasis, rheumatoid arthritis, colitis and toxoplasmosis (Tesmer et al. 2008, Guedes et al. 2010). However, only a few studies have assessed the role + Corresponding author: gagcezario@gmail.com
Received 24 January 2011 Accepted 24 May 2011
Analysis of the expression of toll-like receptors 2 and 4 and cytokine
production during experimental Leishmania chagasi infection
Glaucia Aparecida Gomes Cezário1/+, Larissa Ragozo Cardoso de Oliveira1, Eliana Peresi1,
Vanessa Cristina Nicolete1, Jossimara Polettini2, Carlos Roberto Gonçalves de Lima1,
Mariana Gatto1, Sueli Aparecida Calvi1
1Departamento de Doenças Tropicais
2Departamento de Patologia, Faculdade de Medicina de Botucatu, Universidade Estadual Paulista, Botucatu, SP, Brasil
Toll-like receptors (TLRs) recognise pathogen-derived molecules and influence immunity to control parasite infections. This study aimed to evaluate the mRNA expression of TLRs 2 and 4, the expression and production of
the cytokines interleukin (IL)-12, interferon (IFN)-γ, tumor necrosis factor (TNF)-α, IL-17, IL-10 and transforming growth factor (TGF)-β and the production of nitric oxide (NO) in the spleen of mice infected with Leishmania cha-gasi. It also aimed to evaluate any correlations between mRNA expression TLR2 and 4 and cytokines and NO pro
-duction. Infection resulted in increased TLR2-4, IL-17, TNF-α and TGF-β mRNA expression during early infection, with decreased expression during late infection correlating with parasite load. IFN-γ and IL-12 mRNA expression decreased at the peak of parasitism. IL-10 mRNA expression increased throughout the entire time period analysed. Although TGF-β, TNF-α and IL-17 were highly produced during the initial phase of infection, IFN-γ and IL-12 ex
-hibited high production during the final phase of infection. IL-10 and NO showed increased production throughout the evaluated time period. In the acute phase of infection, there was a positive correlation between TLR2-4, TNF-α, IL-17, NO, IL-10 and TGF-β expression and parasite load. During the chronic phase of infection, there was a positive correlation between TLR2-4, TNF-α, IL-17 and TGF-β expression and parasite load. Our data suggest that infection
by L. chagasi resulted in modulation of TLRs 2 and 4 and cytokines.
of IL-17 in protozoan infection and it is not known whether this cytokine acts to aid host defence or contributes to the pathogenesis of these infections (Bacellar et al. 2009).
The specific detection of microorganisms by innate immune cells is mediated by pattern recognition recep-tors (PRRs), germ line-encoded receprecep-tors that conserved microbial structures referred to as pathogen-associated molecular patterns (Medzhitov 2007). Toll-like receptors (TLRs) are essential PRRs that mediate the recognition of microbial structures and induce inflammatory and adap-tive responses (Tuon et al. 2008). Several studies have shown the recognition of Leishmania-derived molecules by different TLRs (Becker et al. 2003, de Veer et al. 2003, Flandin et al. 2006). For instance, lipophosphoglycan (LPG) from Leishmania major stimulated macrophages to secrete cytokines such as IL-12 and TNF-α by binding to TLR2 (de Veer et al. 2003). Additionally, IFN-γ stimu -lation of macrophages induced expression of TLR2 and 3 that participated in the recognition of L. donovani pro-mastigotes. Additionally, the involvement of TLRs in ni-tric oxide (NO)induction and TNF-α production has been reported (Flandin et al. 2006). Similarly, in in vivo experi-ments with mice, Kropf et al. (2004) observed the involve-ment of TLR4 in the control of L. major infection through increased inducible NO synthase expression.
In view of these observations and in the absence of information concerning experimental visceral leishmani-asis infection, studies evaluating the association between TLRs and Th1, Th2 and Th17 cytokines during L. cha-gasi infection may contribute to a better understanding of the parasite/host relationship during infection. This study evaluated the mRNA expression of TLRs 2 and 4, the ex-pression and production of IL-12, IFN-γ, TNF-α, IL-17, IL-10 and TGF-β and the production of NO. Further, any correlations between RNAm expression of TLRs 2 and 4, cytokines and NO production and parasite load during infection with L. chagasi were evaluated.
MAtERiALS ANd MEthOdS
Animals, parasites and experimental infection - Fe-male Balb/c mice aged 8-10 weeks were obtained from the breeding colony of the Tropical Disease Depart-ment, Botucatu Medical School, São Paulo State Uni-versity (UNESP). All animals received sterile water and food ad libitum throughout the experiment. All of the procedures involving animals and their care were con-ducted in conformity with National and International Guidelines and were approved by the Ethical Commit-tee for Animal Experimentation of the Botucatu Medi-cal School, UNESP. The mice were divided into two groups: non-infected (G1) and infected with L. chagasi (G2). The animals in G2 were infected intravenously with L. chagasi strain M6445 amastigotes at a concen -tration of 1 x 07 amastigotes/mL in a final volume of 0.1 mL per animal. Time points for animal euthanasia were previously determined based on approximated parasite load; parasite loads were estimated by the microtitration technique in culture and the imprinting technique in the spleen. Five animals from each group were euthanized on days one (24 h after infection, beginning of the acute phase), three, seven, 14, 21, 28 (parasitism peak), 35 (ini
-tial decrease in parasite burden, beginning of the chronic phase) and 42 post-infection (p.i.). Tissue samples from the spleen were immediately obtained after animal death and stored in the RNA stabilisation reagent RNAlater® solution (Applied Biosystems, Foster City, CA, USA) at 80ºC until RNA extraction for cytokine and TLR ex-pression analysis by real-time polymerase chain reaction (PCR). Other samples from the spleen were snap frozen in liquid nitrogen and stored at 80ºC until analysis for protein production. Spleen fragments were collected, weighed and then homogenised with a tissue titrate in Schneider’s drosophila medium (Gibco BRL, Eragny, FRA) to determine the parasite load.
Cytokine quantification enzyme-linked immunosorbent assay (ELISA) - Snap-frozen spleen samples were lysed in phosphate-buffered saline (50 mg/mL) with a protease inhibitor cocktail (Complete, EDTA-free, Roche Diagnos- tics). The tissue fragments were macerated and centrifu- ged and the supernatants were collected for cytokine quantification. ELISA kits for IL-17, IL-10, IFN-γ, TNF-α, IL-12 and TGF-β (R&D Systems, Minneapolis, MN, USA) were utilised and the procedures were performed accord-ing to the manufacturer’s instructions. Optical densities were measured at 450 nm. The results are expressed as pg/mL. The limits of sensitivity for the different assays were as follows: IL-17, IL-10, TGF-β and TNF-α, 15 pg/ mL; IFN-γ, 50 pg/mL; and IL-12, 5 pg/mL.
Quantification of cytokines and TLRs 2 and 4 mRNA expression by real-time PCR assay - Total RNA was extracted from spleen tissue samples stored in RNA- later(Applied Biosystems, CA, USA) using the TRIzol reagent (Invitrogen, Carlsbad, CA, Canada) according to the manufacturer’s instructions. cDNA was synthesised using 1 µg of total RNA as a template in a reverse tran-scription reaction (ImProm-IITM Reverse Transcriptase System, Promega, Madison, WI, USA). Quantitative real-time PCR mRNA analyses were performed using the ABI Prism 7300 SDS software (Applied Biosys-tems, Foster City, CA, USA); Applied Biosystems Power Sybr® Green (Fermentas, Vilnius, LTU) was used for the quantification of amplicons. The standard PCR condi-tions were as follows: 95ºC (10 min), 40 cycles of 95ºC (15 s) and 60ºC (1 min), followed by a standard dena -turation curve. mRNA expression levels of the relevant genes and β-actin were determined using relative quan -tification by comparison with a standard curve for each gene, which was included in each PCR run generated from the serial dilution of a cDNA pool from the spleen tissue samples in the study. Standard curves and samples were measured in duplicate and a NO template control was included in all runs. Quantitative real-time PCR mRNA analyses were performed using murine primer sequences available in the GenBank database (Table I).
(bioMérieux, Marcy-l’Etoile, Rhone, FRA). Under ster-ile conditions, 96-well microtitration plates (Nunc, Life Tech Inc, Maryland, MA, USA) with 225 µL of culture medium per well were plated with four-fold serial dilu-tions of the homogenized tissue suspension. Plates were incubated for seven days at 26-28ºC in a 5% CO2 atmo-sphere before being examined using an inverted micro-scope at 100x or 200x magnification (Nikon Eclipse TS100-F, Shanghai, CHI). A titration result was consid-ered positive with the presence of at least one parasite in the last dilution, which was used for parasite load quan-tification as described by Buffet et al. (1995).
Macrophage culture -After spleen removal, splenic macrophages were obtained according to protocol de-scribed in Fenechet al. (1991). Briefly, spleen fragments were removed and placed into Petri dishes (20 x 100 mm) containing 5 mL of Roswell Park Memorial Institute medium (RPMI) 1640 culture medium (Sigma-Aldrich, St. Louis, MO, USA). Fragments were broken up using sterile needles to obtain single cell suspensions. Cell sus-pensions were then centrifuged at 1,500 rpm for 10 min. Next, the supernatants were discarded and the cell but-ton was taken off by homogenisation. After adding 7 mL of complete tissue-culture medium (CTCM), consist- ing of RPMI 1640 tissue culture medium supplemented with 2 mM L-glutamine (Sigma-Aldrich St. Louis, MO, USA), 10% heat-inactivated FCS (Vitrocell, Campinas, SP, BRA), 20 mM Hepes (Sigma-Aldrich, St. Louis, MO, USA) and 40 ug/mL gentamicin (Gibco Labora-tories, Grand Island, NY), macrophages were counted using neutral red (0.02%) and the concentrations were adjusted. Next, 100 µL of the suspensions, containing
1 x 10⁶ cells/mL, were dispensed in each well of a 96-well flat-bottomed plate (Nunc, Life Tech Inc, Mary-land, MA, USA). After incubation in 5% CO2 at 37ºC for 2 h, non-adhering cells were aspirated and each well was rinsed twice with CTCM. Macrophages were then cul-tured in CTCM in 5% CO2 at 37ºC for24 h; supernatants were then collected and assayed for NO production.
Determination of nitrite (NO2-) production - NO
pro-duction was quantified by the accumulation of NO2- in the supernatants using the standard Griess assay (Green et al. 1982). Briefly, 100 µL of supernatants from the macrophage cultures were mixed with an equal volume of the Griess Reagent (Sigma-Aldrich, St. Louis, MO, USA), containing 1% sulfanilamide (Sigma-Aldrich, St. Louis MO, USA) diluted in 5% H3PO4 and 0.1% N-(1 Naphthyl) ethyl-enediamine (Sigma-Aldrich Co, USA). Absorbance at 540 nm was determined using an automated ELISA plate reader (MD 5000, Dynatech Laboratories Inc, Chantilly, VA, USA). Conversion of absorbance to micromolar concentrations of NO was performed using a standard curve of a known concen-tration of NaNO2 diluted in distilled H2O. All measure-ments were performed in triplicate and are expressed in micromolar concentrations of NO.
Statistical analysis - Results were statistically analy-sed by ANOVA using Graphpad Software (Graph Pad In-stat 3.05, San Diego, CA, USA) and compared utilising the Tukey-Kramer test. Spearman analysis was performed for the correlation analysis between the expression of TLR2-4, IL-12, IFN-γ, TNF-α, TGF-β, IL-10, IL-17, NO and parasite load. Significance was set at p < 0.05.
TABLE I
Primers used in real-time polymerase chain reaction
Gene Primers Sequence
IL-2p40 F1 5´-CCC AAG CAG GCC ACA GAA TTG AAA-3´
R2 5´-AGT CAA ATC CAG AAC ATG CCG CAG-3´
IL-17 F1 5´-ACC GCA ATG AAG ACC CTG AT-3´
R2 5´-TCC CTC CGC ATT GAC ACA-3´
IL-10 F1 5´-GCC AAG CCT TAT CGG AAA TG-3´
R2 5´-CAC CCA GGG AAT TCA AAT GC-3´
IFN-γ F1 5´-AGA GGA TGG TTT GCA TCT GGG TCA-3´
R2 5´-ACA ACG CTA TGC AGC TTG TTC GTG-3´
TNF-α F1 5´-CAT CTT CTC AAA ATT CGA GTG ACA A-3´
R2 5´-TGG GAG TAG ACA AGG TAC AAC CC-3´
TGF-β F1 5´-AAC AAT TCC TGG CGT TAC CTT-3´
R2 5´-CTG CCG TAC AAC TCC AGT GA -3´
TLR-2 F1 5´-TGT CTC CAC AAG CGG GAC TT -3´
R2 5´-TTC GAT GGA ATC GAT GAT GTT G -3´
TLR-4 F1 5´-TGA CAG GAA ACC CTA TCC AGA GTT-3´
R2 5´-TCT CCA CAG CCA CCA GAT TCT-3´
β-actina F1 5´-AGA GGG AAA TCG TGC GTG AC-3´
R2 5´-CAA TAG TGA TGA CCT GGC CGT-3´
RESuLtS
Parasite load in L. chagasi-infected Balb/c mice - The parasite load increased only slightly until day seven p.i., with a greater increase observed on day 14 p.i.; splenic parasite load peaked at day 28 p.i. and decreased from day 35 p.i.(Fig. 1).
L. chagasi-induced TLR2 and 4 mRNA expression - To determine whether L. chagasi infection affected the expression of TLRs 2 and 4, mRNA levels were evaluat-ed. L. chagasi-infected animals in G2 exhibited greater TLR4 mRNA expression at all of the studied time points compared to the non-infected animals in G1. TLR4 mRNA expression in G2 animals was significantly high-er on days one, three, seven, 14, 21 and 28 p.i., compared with days 35 and 42 p.i. (Fig. 2A). The animals in G2 also showed higher mRNA expression of TLR2 in rela-tion to G1 animals at all studied time points. In G2 ani-mals, TLR2 mRNA expression was significantly higher on days 14, 21 and 28 p.i. It was also observed that, at the beginning of infection (days 1, 3 and 7), TLR2 mRNA expression was higher than the expression observed on days 35 and 42 p.i. (Fig. 2B).
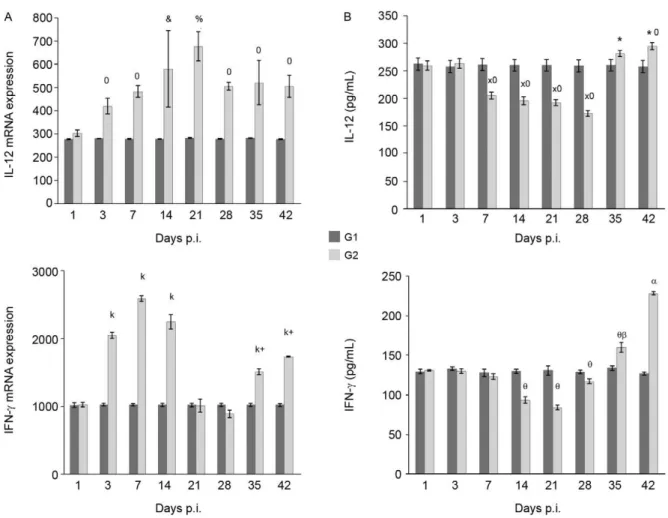
Proinflammatory and Th17 cytokines mRNA and pro -tein expression during L.chagasi infection - As IFN-γ and IL-12 are considered to be the major protective cytokines in visceral leishmaniasis and TNF-α and IL-17 have been shown to be inflammatory in several parasitic infections, we investigated the expression of these cytokines through-out the course of L. chagasi infection. In G2 animals, higher levels of IFN-γ mRNA expression were detected, compared with those in G1 animals from days three-14 p.i. and end of the time period (35th and 42th days); pro -duction in G2 was similar at the beginning, lower from the 14-28th days and higher at the end of infection (35th and 42th days) compared to levels observed in G1 mice. The
highest IFN-γ production occurred on the 42th day p.i. (Fig. 3A, B). With respect to IL-12, IL-12 mRNA expres-sion was significantly higher in G2 animals compared to G1 animals throughout the period of infection evaluated. In G2 animals, IL-12 mRNA expression increased from day one-21 p.i., with decreased levels observed on day 28 p.i. IL-12 mRNA expression was significantly higher on days 14 and 21 in G2 animals compared to expression levels on other days. IL-12 mRNA was also significantly increased on days 28, 35 and 42 compared to levels dur -ing the beginn-ing of infection on days one and three p.i. IL-12 protein production in G2 animals was significantly lower on days seven, 14, 21 and 28 p.i. and higher on days 35 and 42 p.i. compared to IL-12 levels detected in G1 animals. In G2 animals, the increased IL-12 production during late infection (days 35 and 42 p.i.) was statistically significant when compared to the IL-12 levels detected on days seven, 14, 21 and 28 p.i. (p< 0.001) (Fig. 3A, B)
Fig. 1: total parasite load (PL) in the spleen of Balb/c mice during the course of visceral infection with Leishmania chagasi. The data means
are representative of two independent experiments (5 mice per group).
Fig. 2: mRNA expression of Toll-like receptors (TLR)2 and 4 during Leishmania chagasi infection. TLR2 and 4 were quantified in the
sple-nocytes of infected (G2) and non-infected (G1) Balb/c mice by real-time polymerase chain reaction on day one, three, seven, 14, 21, 28, 35 and 42 post-infection (p.i.). The data (mean ± standard error of the mean) are representative of two independent experiments (5 mice per group). Statistically significance between groups is indicated. *: p < 0.05 vs. G1; #: p < 0.05 vs. G2 one-28 p.i.; 0: p < 0.05 vs. G2 one-28 p.i.; +: p < 0.05
Increased TNF-α and IL-17 mRNA expression and protein were detected in G2 animals compared to G1 animals throughout the entire course of infection begin-ning at day three p.i. In G2 animals, TNF-α mRNA lev -els increased until day 14 p.i. and then remained steady until 28 days p.i. IL-17 mRNA expression and protein production steadily increased in G2 animals until day 28 p.i.; decreased expression was observed on days 35 and 42 p.i. (Fig. 4A, B). There was an inverse correlation between parasite load and IFN-γ and IL-12 (r = -0.22 to -0.87, p < 0.05) production and a direct correlation be -tween parasite load and IL-17 and TNF-α (r = 0.26-0.77, p < 0.05) expression and production during infection.
TGF-β and IL-10 mRNA expression and production
during L. chagasiinfection - As TGF-β and IL-10 have been demonstrated to contribute to the control of inflam-matory processes and parasite persistence, we evaluated their mRNA expression and production during L. cha-gasi infection. The animals in G2 showed higher TGF-β mRNA expression and protein levels compared with
those in G1 animals, throughout the course of infection beginning at day three p.i.; however, levels in G2 ani-mals decreased on days 35 and 42 p.i. Similar to TGF-β, IL-10 mRNA expression and protein production in G2 animals were higher throughout the course of infection starting at day three p.i. compared with those in G1 ani-mals. Interestingly, IL-10 mRNA expression and protein levels increased steadily throughout all of the measure time points compared with those in G1. In G2 animals, the highest IL-10 protein levels were observed on days 35 and 42 p.i. (Fig. 5A, B).
During the initial phase of infection, there was a direct correlation between IL-10 and TGF-β mRNA expression and protein production and IL-17, TNF-α, NO production and parasite load (r = 0.32-0.53, p < 0.05). Additionally, there was an inverse correlation between IL-10 and TGF-β mRNA expression and protein production and IL-12 and IFN-γ protein levels (r = -0.16 to -0.56, p < 0.05). Late in infection, there was a direct correlation between IL-10 mRNA expression and protein levels and IL-12, IFN-γ and NO production (r = 0.24-0.89, p < 0.05).
Fig. 3: interferon (IFN)-γ and interleukin (IL)-12 mRNA expression and production during Leishmania chagasi infection. IFN-γ and IL-12 were quantified in the splenocytes of infected (G2) and non-infected (G1) Balb/c mice by real-time polymerase chain reaction (A) and enzyme-linked
immunosorbent assay (B) on days one, three, seven, 14, 21, 28, 35 and 42 post-infection (p.i.). The data (mean ± standard error of the mean) are representative of two independent experiments (5 mice per group). Statistically significance between groups is indicated. k: p < 0.001 vs.G1 and G2 one, 21, 28 p.i.; +: p < 0.001 vs.G2 three, seven,14 p.i.; θ:p < 0.01 vs. G1; β: p < 0.05 vs.G2 14-28 p.i.; α: p < 0.001 vs. G1 and G2 one-35 p.i.;
NO2- production during L. chagasi infection - NO
production by splenic cells during L. chagasi infection is depicted in Fig. 6. NO production by splenic cells from G2 animals was significantly higher compared to cells from G1 animals beginning on the 14 day p.i. In G2 ani-mals, NO levels were maintained at steady levels until the seven day p.i. However, beginning on the 14th day, NO levels increased continually until the end of the experi-ment. During the initial phase of infection, there was a positive correlation between NO levels and IL-17, TNF-α, IL-10 and TGF-β production and parasite load (r = 0.23-0.76, p < 0.05). Late in infection, a positive correlation was observed between NO levels and IL-12, IFN-γ and IL-10 production (r = 0.13-0.86, p < 0.05). Additionally, an in -verse correlation between NO levels and parasite load (r = -0.65, p < 0.05) was observed during late infection.
Correlation between the expression of TLR2-4 mRNA
and the production of cytokines and NO and
para-site load during L. chagasi infection - The results of the correlation analysis between the levels of expression of
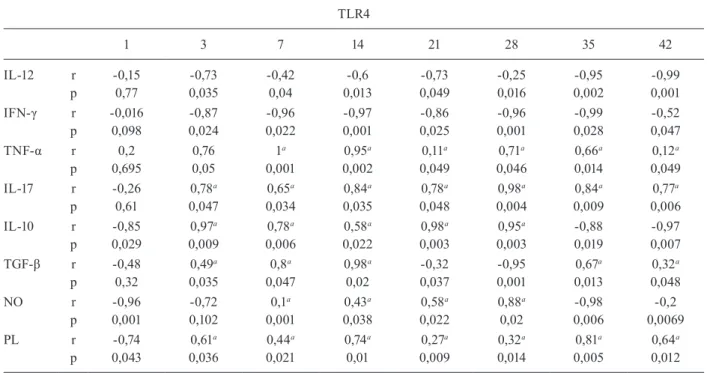
TLR2-4 and the production of cytokines and NO and parasite load are shown in Tables II and III. A positive correlation was observed between TLR2-4 and TNF-α, IL-17, IL-10, TGF-β and parasite load at the beginning of infection and between TLR2-4, TNF-α, IL-17, TGF-β and parasite load late in infection. Additionally, an in-verse correlation was found between TLR2-4, IL-12, IFN-γ and parasite load at the beginning of infection and between TLR2-4 and IL-12, IFN-γ, NO, IL-10 at the end of infection (Tables II, III).
diSCuSSiON
Although studies have suggested an involvement of TLRs in the initial interaction of Leishmania with the immune system, the role played by TLRs in visceral leishmaniasis is still unclear. In this context, we aimed to evaluate the expression of TLR2 and 4, the expres-sion and production of IFN-γ, TNF-α, IL-17, IL-10 and TGF-β and the production of NO during the acute and chronic phases of L. chagasi infection in Balb/c mice.
Fig. 4: tumor necrosis factor (TNF)-α and interleukin (IL)-17 mRNA expression and production during Leishmania chagasi infection. TNF-α and IL-17 were quantified in the splenocytes of infected (G2) and non-infected (G1) Balb/c mice by real-time polymerase chain reaction (A) and
enzyme-linked immunosorbent assay (B) on days one, three, seven, 14, 21, 28, 35 and 42 post-infection (p.i.). The data (mean ± standard error of the mean) are representative of two independent experiments (5 mice per group). Statistically significance between groups is indicated. *: p < 0.001 vs. G1 and G2 one, three, seven, 35, 42 p.i.; +: p < 0.05 vs. G1 and G2 one p.i.; γ: p < 0.05 vs. G2 seven-28 p.i.; θ: p < 0.01 vs. G1 and G2
Additionally, we correlated the expression of TLR2-4, cytokine production and NO production with parasite load. L. chagasi infection induced TLR2 and 4 mRNA expressions throughout the course of infection, indicat-ing that these receptors could potentially be involved in parasite recognition. These results are in agreement with previous studies showing that Leishmania parasites can bind to both TLR2 and 4 to enter host cells (Kropf et al. 2004, Flandin et al. 2006). We also found that, at the peak of parasitism, there was higher expression of TLR4 and particularly of TLR2. A possible explanation for this result is that the parasite and/or cytokines can modulate the expression of these receptors. This idea is supported by studies showing that LPG from L. major is recognised by TLR2 in NK cells, which leads to their activation and a subsequent increase in surface TLR2 levels (Becker et al. 2003). However, based on our experiments, it cannot be stated that increased TLR2 and 4 mRNA expression was due to increased mRNA levels within individual cells. In our study, increased expression may have oc-curred as a result of the influx of inflammatory cells to the spleen, particularly at the beginning of infection. Additionally, the decrease in parasite load observed in
the chronic phase of infection may be associated with the partial control of the infection. Although microscopy was not performed to detect whether an alteration in the number of cells occurred, it can be suggested that the decreased parasite load late in infection may also be re-lated to a reduction in cell infiltrates. Hence, it can be suggested that the lower expression of TLRs at the end of infection may have resulted from a decreased number of parasites stimulating the cells, as well as from a smaller influx of cells into the spleen.
We hypothesise that L. chagasi infection resulted in cytokine modulation. The mechanism responsible for cytokine production most likely involves TLRs. Parasite components could have led to the activation of TLR2 and 4, resulting in the production of cytokines (Tuon et al. 2008). Although the mRNA expression of IL-12 and IFN-γ was higher in the infected animals, production during the initial phase of infection remained low and was reduced in comparison to G1 animals. These findings can be ex-plained by the fact that the process of translation of these cytokines was prevented (Maier et al. 2009). The inhibi-tion of cytokine synthesis may have occurred due to the action of suppressive mechanisms, such as soluble factors
Fig. 5: mRNA expression and production of transforming growth factor (TGF)-β and IL-10 during Leishmania chagasi infection. TGF-β and interleukin (IL)-10 were quantified in the splenocytes of infected (G2) and non-infected (G1) Balb/c mice by real-time polymerase chain reaction
(A) and enzyme-linked immunosorbent assay (B) on days one, three, seven, 14, 21, 28, 35 and 42 post-infection (p.i.). The data (mean ± standard error of the mean) are representative of two independent experiments (5 mice per group). Statistically significance between groups is indicated. *: p < 0.001 vs. G1 and G2 one, 35, 42 p.i.; +: p < 0.001vs. G1 and G2 one-28 p.i.; &: p < 0.05 vs. G1 and G2 one p.i.; γ:p < 0.01 vs. G2 seven-28
or different cell types (Barral et al. 1986, Carvalho et al. 1989, Bacellar et al. 1996). The presence of such mecha-nisms has been shown in studies using peripheral blood mononuclear cells (PBMC) (Barral et al. 1986, Carvalho et al. 1989, Bacellar et al. 1996).Our results show that low IL-12 and IFN-γ production was followed by high parasite load; hence, the high parasite load observed at the beginning and in the intermediate phase of infection
may be due to the low release of these cytokines by cells. Conversely, the decreased parasite load in the chronic phase would be related to the increased production of these cytokines. These results are in agreement with oth-ers showing that IL-12 and IFN-γ play a protective role during Leishmania infection because they promote the Th1 response in addition to controlling parasitic replica-tion and resolving the infecreplica-tion (Hernandez-Pando et al. 1997, Watford et al. 2004, Cummings et al. 2010). Con-sistent with our results, several studies have shown low or absent IFN-γ or IL-12 production in the supernatants of PBMC cultures stimulated with Leishmania antigen (Cillari et al. 1995, Ghalib et al. 1995, Kumar et al. 2001). Additionally, the modulation of TLR receptors by IFN-γ and IL-12 has also been shown. Studies have found that macrophages activated by IFN-γ exhibit higher TLR2 expression on their surface (Flo et al. 2001). In an perimental model of neurocysticercosis, increased ex-pression of TLRs 11-13 was observed in the acute phase compared to the chronic phase. Acute infection was as-sociated with the Th1 response. However, a Th1/Th2 response pattern was detected in the chronic phase and was associated with decreased expression of TLRs 11-13, which contributed to the reduction of the tissue damage induced by excessive inflammation (Mishra et al. 2008).
In this study, it was also shown that L. chagasi infec-tion resulted in increased IL-17 mRNA expression and protein production. These results correlated with the pro-file of TLR2-4 expression and parasite load and showed a response characteristic that was opposite to IFN-γ and of
TABLE II
Correlation (r) between the expression of toll-like receptor (TLR)2 and the production of cytokines and nitric oxide (NO) and parasite load (PL) during Leishmania chagasi infection
TLR2
1 3 7 14 21 28 35 42
IL-12 r -0,37 -0,43 -0,89 -0,87 -0,83 -0,53 -0,43 -0,6
p 0,042 0,039 0,018 0,029 0,035 0,027 0,017 0,009
IFN-γ r -0,52 -0,21 -0,58 -0,84 -0,27 -0,96 -0,32 -0,22
p 0,028 0,067 0,022 0,032 0,059 0,002 0,0053 0,0076
TNF-α r -0,67 -0,39 0,78a 0,81a 0,96a 0,89a 0,63a 0,85a
p 0,139 0,043 0,047 0,046 0,001 0,016 0,047 0,049
IL-17 r -0,26 0,82a 0,98a 0,63a 0,79a 0,88a 0,25a 0,1a
p 0,66 0,044 0,001 0,046 0,048 0,019 0,048 0,045
IL-10 r -0,49 0,4 0,933a 0,8a 0,07a 0,81a -0,59 -0,54
p 0,318 0,342 0,006 0,045 0,005 0,049 0,21 0,26
TGF-β r -0,02 0,97a 0,26a 0,89a -0,32 -0,95 0,67a 0,85a
p 0,955 0,009 0,049 0,017 0,05 0,002 0,013 0,016
NO r 0,69 0,44 0,78a 0,13a 0,93a 0,98a -0,04 -0,83
p 0,127 0,97 0,001 0,007 0,007 0,005 0,009 0,037
PL r -0,27 0,29a 0,37a 0,61a 0,74a 0,56a 0,68a 0,48a
p 0,042 0,4 0,027 0,008 0,03 0,005 0,037 0,025
a:statistically significant differences among expression of TLR2 and production of cytokine and NO and PL are shown as p < 0,05; IFN: interferon; IL: interleukin; TGF: transforming growth factor; TNF: tumor necrosis factor.
Fig. 6: nitric oxide (NO) production during Leishmania chagasi infec-tion. NO was quantified in the splenic macrophages of infected (G2) and non-infected (G1) Balb/c mice on days one, three, seven, 14, 21,
28, 35 and 42 post-infection (p.i.). The data (mean ± standard error of the mean) are representative of two independent experiments (5 mice
per group). Statistically significance between groups is indicated. *:
IL-12. It has been observed that TLR4 activation stimu- lates dendritic cells to produce IL-23, which is im- portant for Th17 cell maintenance (Vanden et al. 2006). Additionally, in a previous study (unpublished observa-tions) using the same infection model, a direct correlation between IL-17, TNF-α and IL-6 was observed. These cy -tokines were associated with an intense inflammatory process and tissue damage. Hence, according our find-ings, we suggest that IL-17 is involved not in infection control, but in pathogenesis mechanisms that contribute to disease development. These results are in agreement with other studies showing that in experimental L. ma-jor infection, increased IL-17 production was observed in susceptible Balb/c animals compared to resistant C57BL/6 animals. These studies also showed that lesion development and infection susceptibility were related to IL-17 production. Balb/c mice failed to control lesion exacerbation, exhibiting a larger recruitment of neutro-phils to asymptomatic sites, while also exhibiting simi-lar IFN-γ and IL-10 production levels (Anderson et al. 2009, Kostka et al. 2009). In regards to TNF-α levels, our results indicate a positive correlation with TLR2-4 expression, IL-17 mRNA expression and protein levels and parasite load. In a study using the SIR2RP protein of Leishmania infantum, it was shown that TNF-α pro-α pro- pro-duction from bone marrow DCs was dependent on TLR2 (Silvestre et al. 2009). Although TNF-α is essential for normal responses associated with parasite elimination, its excessive or inappropriate production may cause dam-age to the host (Robak et al. 1998, Bradley 2008). Consis-tent with this, in a study on visceral leishmaniasis, high
TNF-α concentrations were related to disease progres -sion (Kaye et al. 2004). Additionally, TNF-α inhibition healed ulcers in patients with American cutaneous leish-maniasis (Ribeiro de Jesus et al. 2008). In accordance with these studies, our results also suggest that TNF-α is involved not in protection, but in tissue damage and pathogenesis. NO production increased during infection. Consistent with this, large amounts of NO were reported in the supernatants of murine macrophages infected with L. chagasi and stimulated with IFN-γ; these results re -flects the importance of NO in leishmanicidal activity (Gantt et al. 2001). Our results indicate a positive correla-tion, in the initial phase of infeccorrela-tion, between NO lev-els and TLR2-4 expression and between IL-17, TNF-α, IL-10 and TGF-β production and parasite load. During late infection, our results indicate a positive correlation between NO levels and IL-12, IFN-γ and IL-10 produc -tion. Although the levels of such metabolites were high at the beginning of infection, this increase did not result in parasite destruction during the initial phase of infection. Parasite clearance occurred only at the beginning of the chronic phase, most likely when the levels of NO were sufficiently increased to eliminate the parasites. This was also likely due to the elevated levels of IFN-γ, the main cytokine involved in the induction of NO.
In leishmaniasis, similar to other infections, IL-10 and TGF-β have been identified as important cytokines involved in homeostatic mechanisms and in limiting tis-sue damage caused by extensive inflammation. Never-theless, these cytokines also favour pathogen persistence (Belkaid et al. 2001). In visceral leishmaniasis, IL-10 has
TABLE III
Correlation (r) between the expression of toll-like receptor (TLR)4 and the production of cytokines and nitric oxide (NO) and parasite load (PL) during Leishmania chagasi infection
TLR4
1 3 7 14 21 28 35 42
IL-12 r -0,15 -0,73 -0,42 -0,6 -0,73 -0,25 -0,95 -0,99
p 0,77 0,035 0,04 0,013 0,049 0,016 0,002 0,001
IFN-γ r -0,016 -0,87 -0,96 -0,97 -0,86 -0,96 -0,99 -0,52
p 0,098 0,024 0,022 0,001 0,025 0,001 0,028 0,047
TNF-α r 0,2 0,76 1a 0,95a 0,11a 0,71a 0,66a 0,12a
p 0,695 0,05 0,001 0,002 0,049 0,046 0,014 0,049
IL-17 r -0,26 0,78a 0,65a 0,84a 0,78a 0,98a 0,84a 0,77a
p 0,61 0,047 0,034 0,035 0,048 0,004 0,009 0,006
IL-10 r -0,85 0,97a 0,78a 0,58a 0,98a 0,95a -0,88 -0,97
p 0,029 0,009 0,006 0,022 0,003 0,003 0,019 0,007
TGF-β r -0,48 0,49a 0,8a 0,98a -0,32 -0,95 0,67a 0,32a
p 0,32 0,035 0,047 0,02 0,037 0,001 0,013 0,048
NO r -0,96 -0,72 0,1a 0,43a 0,58a 0,88a -0,98 -0,2
p 0,001 0,102 0,001 0,038 0,022 0,02 0,006 0,0069
PL r -0,74 0,61a 0,44a 0,74a 0,27a 0,32a 0,81a 0,64a
p 0,043 0,036 0,021 0,01 0,009 0,014 0,005 0,012
been detected in the serum, lymph nodes and the spleen (Cillari et al. 1995, Ghalib et al. 1995, Kenney et al. 1998, Ansari et al. 2006). These findings are in agreement with our results, which show the presence of high IL-10 levels in the spleen, particularly in late infection. However, our results suggest that, at the beginning of infection, IL-10 levels were associated with TLRs 2 and 4 expressions, NO production and parasite load, in addition to low IFN-γ and IL-12 levels. Although this may suggest the involvement of IL-10 in the suppression of these cytokines, this may have not occurred because IFN-γ, IL-12 and NO levels at the end of infection were high, despite high levels of IL-10. With respect to TGF-β, results show that, in addi -tion to its involvement in IL-17 induc-tion together with IL-6, it may also be related to the suppression of protec-tive mechanisms, acting directly or indirectly to decrease IFN-γ and IL-12 production. In our study, high TGF-β levels were detected at the beginning of infection and cor-related positively with TLR2-4 expression and parasite load and negatively with IFN-γ and IL-12 production; fur -ther, the opposite situation was observed late in infection. Increased TGF-β mRNA expression and protein levels were also detected in the spleen; according to our results, this expression was associated with immunosuppressive mechanisms (Li et al. 1999, Nylén et al. 2007).
In addition to the involvement of TLR2 and 4 in leish-maniasis, other TLRs, such as TLR3, TLR7 and TLR9, also operate in Leishmania recognition (Flandin et al. 2006, Schleicher et al. 2007, Paun et al. 2011). It was ob-served that TLR9 activation by Leishmania seems to be crucial in modulating the production of cytokines, such as IL-12 (Schleicher et al. 2007). According to these find-ings, we suggest that other TLRs could be involved in cytokine modulation during infection with L. chagasi.
In summary, our findings show that, in the acute phase of infection, there was a correlation between TLR2-4 expression, TNF-α, IL-17, IL-10, TGF-β, and NO production and parasite load, which was high dur-ing this period of infection. In the final phase or chronic phase of infection, a correlation between low TLR2-4 expressions, lower TNF-α, IL-17 and TGF-β produc -tion and low parasite load was observed. In this period, we also detected increased production of IL-12, IFN-γ and NO, which were likely involved in infection con-trol. These findings suggest that L. chagasi interacted with TLR2-4 and that parasite infection led to cytokine modulation during the acute and chronic phases. Further studies will be conducted to confirm the involvement of TLRs in cytokine and NO production during experimen-tal infection with L. chagasi.
REfERENCES
Agnello D, Lankford CSR, Bream J, Morinobu A, Gadina M, Shea JJO, Frucht DM 2003. Cytokines and transcription factors that regulate T helper cell differentiation: new players and new in-sights. J Clin Immunol23: 147-161.
Anderson CF, Stumhofer JS, Hunter CA, Sacks D 2009. IL-27 regu-lates IL-10 and IL-17 from CD4+ cells in nonhealing Leishmania
major infection. J Immunol 183: 4619-4627.
Ansari NA, Saluja S, Salotra P 2006. Elevated levels of interferon-gamma, interleukin-10 and interleukin-6 during active disease in Indian Kala azar. Clin Immunol 119: 339-345.
Bacellar O, Brodskyn C, Guerreiro J, Barral-Netto M, Costa CH, Coffman RL, Johnson WD, Carvalho EM 1996. Interleukin-12 restores interferon-gamma production and cytotoxic responses in visceral leishmaniasis. J Infect Dis 173: 1515-1518.
Bacellar O, Faria D, Nascimento M, Cardoso TM, Gollob KJ, Dutra WO, Scott P, Carvalho EM 2009. IL-17 production in patients with American cutaneous leishmaniasis. J Infect Dis200: 75-78.
Badaro R, Jones TC, Carvalho EM, Sampaio D, Reed SG, Barral A, Teixeira R, Johnson WD Jr 1986. New perspectives on a subclini-cal form visceral leishmaniasis. J Infec Dis154: 1003-1011. Barral A, Carvalho EM, Badaro R, Barral-Neto M 1986. Suppression
of lymphocyte proliferative responses by sera from patients with American visceral leishmaniasis. Am J Trop Med Hyg 35: 735-742.
Becker I, Salaiza N, Aguirre M, Delgado J, Carrillo-Carrasco N, Ko-beh LG, Ruiz A, Cervantes R, Torres AP, Cabrera N, González A, Maldonado C, Isibasi A 2003. Leishmania lipophosphoglycan (LPG) activates NK cells through Toll-like receptor 2. Mol
Bio-chem Parasitol 130: 65-74.
Belkaid Y, Hoffmann KF, Mendez S, Kamhawi S, Udey MC, Wynn TA, Sacks DL 2001. The role of interleukin (IL)-10 in the per-sistence of Leishmania major in the skin after healing and the therapeutic potential of anti-IL-10 receptor antibody for sterile cure. J Exp Med 194: 1497-1506.
Belkaid Y, Piccirillo CA, Mendez S, Shevach EM, Sacks DL 2002. CD4+
CD25+ regulatory T cells control Leishmania major persistence and
immunity. Nature 420: 502-507.
Belosevic M, Finbloom DS, Van Der Meide, Slayter MV, Nacy CA 1989. Administration of monoclonal anti-IFN-gamma antibodies
in vivo abrogates natural resistance of C3H/HeN mice to infec-tion with Leishmania major. J Immunol 143: 266-274.
Bodgan C, Moll H, Solbach W, Röllinghoff M 1990. Tumor necrosis
factor-α in combination with interferon-γ, but not with interleu -kin 4 activates murine macrophages for elimination of Leishma-nia major amastigotes. Eur J Immunol 20: 1131-1135.
Bradley JR 2008. TNF-mediated inflammatory disease. J Pathol 214: 149-160.
Buffet PA, Sulahian A, Garin YJF, Nassar N, Derouin F 1995. Cul -ture microtitration: sensitive method for quantifying Leishma-nia infantum in tissues of infected mice. Antimicrob Agents Chemother39: 2167-2168.
Carvalho EM, Bacellar O, Barral A, Badaro R, Johnson Jr WD 1989. Antigen-specific immunosuppression in visceral leishmaniasis is cell mediated. J Clin Invest 83: 860-864.
Cillari E, Vitale G, Arcolco F, Agostino PD, Mocciaro C, Gambino
G, Malta R, Stassi G, Giordano C, Milano S 1995. In vivo and in vitro cytokine profiles and mononuclear cell subsets in Sicilian patients with active visceral leishmaniasis. Cytokine7: 740-745.
Cummings HE, Tuladhar R, Satoskar AR 2010. Cytokines and their STATs in cutaneous and visceral leishmaniasis. J Biomed Bio-techonol2010: 1-6.
Cunningham AC 2002. Parasitic adaptive mechanisms in infection by leishmania. Exp Mol Pathol 72: 132-141.
de Veer MJ, Curtis JM, Baldwin TM, DiDonato JA, Sexton A, McCo-nville MJ, Handman E, Schofield L2003. MyD88 is essential for clearance of Leishmania major: possible role for lipophosphoglycan and Toll-like receptor 2 signaling. Eur J Immunol 33: 2822-2831. Desjeux P 2001. The increase in risk factors for leishmaniasis
world-wide. Trans R Soc Trop Med Hyg95: 239-243.
Dye C 1996. The logic of visceral leishmaniasis control. Am J Trop Med Hyg55: 125-130.
Fenech MF, Dunaiski V, Osborne Y, Morley AA 1991. The cytokine-sis-block micronucleus assay as a biological dosimeter in spleen and peripheral blood lymphocytes of the mouse following acute whole-body irradiation. Mutat Res 263: 119-126.
Flandin JF, Chano F, Descoteaux A 2006. RNA interference reveals a role for TLR-2 and TLR3 in the recognition of Leishmania dono-vani promastigotes by interferon-gamma - primed macrophages.
Eur J Immunol 36: 411-420.
Flo TH, Halaas O, Torp S, Ryan L, Lien E, Dybdahl B, Sundan A, Espevik T 2001. Differential expression of Toll-like receptor 2 in human cells. J Leukoc Biol69: 474-481.
Gantt KR, Goldman TL, McCormick ML, Miller MA, Jeronimo SMB, Nascimento ET, Britigan BE, Wilson ME 2001. Oxidative responses of human and murine macrophages during phagocyto-sis of Leishmania chagasi. J Immunol167: 893-901.
Gantt KR, Schultz-Cherry S, Rodriguez N, Jeronimo SMB, Nas-cimento ET, Goldman TL, Recker TJ, Miller MA, Wilson ME
2003. Activation of TGF-β by Leishmania chagasi: importance for parasite survival in macrophages. J Immunol 170: 2613-2620.
Ghalib HW, Whittle JA, Kubin M, Hashim FA, el-Hassan AM,
Grabstein KH, Trinchieri G, Reed SG 1995. IL-12 enhances
Th1-type responses in human Leishmania donovani infections.
J Immunol 154: 4623-4629.
Goto H, Prianti MG 2009. Immunoactivation and immunopathog-eny during active visceral leishmaniasis. Rev Inst Med Trop Sao Paulo5: 241-246.
Green LC, Wagner DA, Glogowski J 1982. Analysis of nitrate, nitrite, and [15N] nitrate in biological fluids. Anal Biochem 126: 131-138. Guedes PMM, Gutierrez FRS, Maia FL, Milanezi CM, Silva GK, Pa-vanelli WR, Silva JS 2010. IL-17 produced during Trypanosoma cruzi infection plays a central role in regulation parasite-induced myocarditis. PloS Negl Trop Dis4: e604.
Hernandez-Pando R, Orozco H, Arriaga K, Sampieri A, Larriva-Sahd J, Madrid-Marina V 1997. Analysis of the local kinetics and lo-Analysis of the local kinetics and lo-calization of interleukin-1 alpha, tumour necrosis factor-alpha and transforming growth factor-beta during the course of experi-mental pulmonary tuberculosis. Immunol 90: 607-617.
Kaye PM, Svensson M, Ato M, Maroof A, Polley R, Stager S, Zubairi S, Engwerda CR 2004. The immunopathology of experimental visceral leishmaniasis. Immunol Rev 201: 239-253.
Kenney RT, Sacks DL, Gam AA, Murray HW, Sundar S 1998. Splenic cytokine responses in Indian kala-azar before and after treatment.
J Infect Dis 177: 815-818.
Kostka SL, Dinges S, Griewank K, Iwakura Y, Udey MC 2009. IL-17 promotes progression of cutaneous leishmaniasis in susceptible mice. J Immunol 182: 3039-3046.
Kropf P, Freudenberg MA, Modolell M, Price HP, Herath S, Antoniazi S, Galanos C, Smith DF, Müller I 2004. Toll-like receptor 4 con-tributes to efficient control of infection with the protozoan parasite
Leishmania major. Infect Immun 72: 1920-1928.
Kumar R, Pai K, Sundar S 2001. Reactive oxygen intermediates, ni-Reactive oxygen intermediates, ni-trite and IFN-gamma in Indian visceral leishmaniasis. Clin Exp Immunol 124: 262-265.
Li J, Hunter CA, Farrell JP 1999. Anti-TGF-beta treatment promotes rapid healing of Leishmania major infection in mice by enhanc-ing in vivo nitric oxide production. J Immunol162: 974-979. Liew FY, Li Y, Millott S 1990. Tumor necrosis factor-alpha
syner-gizes with IFN-gamma in mediating killing of Leishmania major
through the induction of nitric oxide. J Immunol145: 4306-4310. Maier T, Güell M, Serrano L 2009. Correlation of mRNA and protein
complex biological samples. FEBS Lett583: 3966-3973.
Medzhitov R 2007. Recognition of microorganisms and activation of the immune response. Nature449: 819-826.
Mishra BB, Gundra UM, Teale JM 2008. Expression and distribution of Toll-Like receptors 11-13 in the brain during murine neuro-cysticercosis. J Neuroinflammation5: 53.
Nylén S, Maurya R, Eidsmo L, Manandhar K, Sundar S, Sacks D 2007. Splenic accumulation of IL-10 mRNA in T cells distinct from CD4+CD25+ (Foxp3) regulatory T cells in human visceral
leishmaniasis. J Exp Med 204: 805-817.
Paun A, Bankoti R, Joshi T, Pitha PM, Stäger S 2011. Critical role of
IRF-5 in the development of T helper 1 responses to Leishmania donovani infection. PLoS Pathog 7: e1001246.
Pinelli E, Gonzalo RM, Boog CJ, Rutten VP, Gebhard D, del Real
G, Ruitenberg J 1995. Leishmania infantum-specific T cell lines derived from asymptomatic dogs that lyse infected macrophages in a major histocompatibility complex-restricted manner. Eur J Immunol25: 1594-1600.
Ray M, Gam AA, Boykins RA 2000. Inhibition of interferon-γ signal -ing by Leishmania donovani. J Infect Dis181: 1121-1128. Ribeiro de Jesus A, Luna T, Pacheco de Almeida R, Machado PR,
Carvalho EM 2008. Pentoxifylline down modulate in vitro T cell responses and attenuate pathology in Leishmania and HTLV-I in-fections. Int Immunopharmacol8: 1344-1353.
Robak T, Gladalska A, Stepien H 1998. The tumor necrosis factor family of receptors/ligands in the serum of patients with rheuma-toid arthritis. Eur Cytokine Netw9: 145-154.
Schleicher U, Liese J, Knippertz I, Kurzmann C, Hesse A, Heit A, Fischer JAA, Weiss S, Kalinke U, Kunz S, Bodgan C 2007. NK cell activation in visceral leishmaniasis requires TLR9, myeloid DCs, and IL-12 but is independent of plsmacytoid DCs. J Exp
Med 204: 893-906.
Sharma U, Singh S 2009. Immunobiology of leishmaniasis. Indian J
Exp Biol 47: 412-423.
Silvestre R, Silva AM, Cordeiro-da-Silva A, Ouaissi A 2009. The contribution of Toll-like receptor 2 to the innate recognition of a
Leishmania infantum silent information regulator 2 protein. Im-munol 128:484-499.
Suffia IJ, Reckling SKR, Piccirillo CA, Goldzmid RS, Belkaid Y 2006. Infected site-restricted Foxp3+ natural regulatory T cells
are specific for microbial antigens. J Exp Med203: 777-788. Tesmer LA, Lundy SK, Sarkar S, Fox DA 2008. Th17 cells in human
disease. Immunol Rev223: 87-113.
Theodos CM, Povinelli L, Molina R, Sherry B, Titus RG 1991. Role of tumor necrosis factor in macrophage leishmanicidal activity
in vitro and resistance to cutaneous leishmaniasis in vivo. Infect Immun 59: 2839-2842.
Tuon FF, Amato VS, Bacha HA, Almusawi T, Duarte MI, Neto VA 2008. Toll-like receptors and leishmaniasis. Infect Immun76: 866-872.
Vanden ES, Goriely S, De Wit D, Goldman M, Willens F 2006. Pref-erencial production of the IL-12 (p40)/IL-23(p19) heterodimer by dendritic cells from human newborns. Eur J Immunol 36:21-26. Verma S, Kumar R, Katara GK, Singh LC, Negi NS, Ramesh V,
Sa-lotra P 2010. Quantification of parasite load in clinical samples of leishmaniasis patients: IL-10 level correlates with parasite load in visceral leishmaniasis. PLoS ONE5: e10107.
Watford WT, Hissong BD, Bream JH, Kanno Y, Muul L, O’Shea JJ 2004. Signaling by IL-12 and IL-23 and the immunoregulatory roles of STAT4. Immunol Rev 202: 139-156.
Wilhelm P, Ritter U, Labbow S, Donhauser N, Röllinnghoff M, Bod-gan C, Körner H 2001. Rapidly fatal leishmaniasis in resistant