Analyses of the genotoxic and mutagenic potential of the products formed
after the biotransformation of the azo dye Disperse Red 1
Farah Maria Drumond Chequer
a,⇑, Thiago Mescoloto Lizier
b, Rafael de Felício
c,
Maria Valnice Boldrin Zanoni
b, Hosana Maria Debonsi
c, Norberto Peporine Lopes
c, Ricard Marcos
d,
Danielle Palma de Oliveira
aaUSP, Departamento de Análises Clínicas, Toxicológicas e Bromatológicas, Faculdade de Ciências Farmacêuticas de Ribeirão Preto, Universidade de São Paulo, Ribeirão Preto,
SP 14040-903, Brazil
bUNESP, Departamento de Química Analítica, Universidade Estadual Paulista Júlio de Mesquita Filho, Instituto de Química de Araraquara, Araraquara, SP 14801-970, Brazil cUSP, Departamento de Física e Química, Faculdade de Ciências Farmacêuticas de Ribeirão Preto, Universidade de São Paulo, Ribeirão Preto, SP 14040-903, Brazil dUAB, Grup de Mutagènesi, Departament de Genètica i de Microbiologia, Edifici Cn, Universitat Autònoma de Barcelona, 08193 Cerdanyola del Vallès, Spain
a r t i c l e
i n f o
Article history:
Received 28 February 2011 Accepted 30 May 2011 Available online 30 August 2011
Keywords:
Azo dye Disperse Red 1 Biotransformation Mutagenicity Ames test
Mouse lymphoma assay
a b s t r a c t
Azo dyes constitute the largest class of synthetic dyes. Following oral exposure, these dyes can be reduced to aromatic amines by the intestinal microflora or liver enzymes. This work identified the products formed after oxidation and reduction of the dye Disperse Red 1, simulating hepatic biotransformation and evaluated the mutagenic potential of the resultant solution. Controlled potential electrolysis was car-ried out on dye solution using a Potentiostat/Galvanostat. HPLC-DAD and GC/MS were used to determine the products generated after the oxidation/reduction process. TheSalmonella/microsome assay with the strains TA98 and YG1041 without S9, and the mouse lymphoma assay (MLA) using the thymidine kinase (Tk) gene, were used to evaluate the mutagenicity of the products formed. Sulfate 2-[(4-aminophe-nyl)ethylamino]-ethanol monohydrate, nitrobenzene, 4-nitro-benzamine and 2-(ethylphenylamino)-eth-anol were detected. This dye has already being assigned as mutagenic in different cell system. In addition, after the oxidation/reduction process the dye still had mutagenic activity for theSalmonella/microsome assay. Nevertheless, both the original dye Disperse Red 1 and its treated solutions showed negative results in the MLA. The present results suggest that the ingestion of water and food contaminated with this dye may represent human and environmental health problem, due to the generation of harmful com-pounds after biotransformation.
Ó2011 Elsevier Ltd. All rights reserved.
1. Introduction
Over 800,000 tons of dyestuffs are annually produced
throughout the World, of which 60–70% are azo dyes (Anliker, 1977; Combes and Haveland-Smith, 1982). At least 3000 azo dyes were in use in the 1990s (Chung and Cerneglia, 1992), duced by the diazotization of aromatic amines, and used to pro-vide color in products manufactured by the textile, leather, printing, paper, food and cosmetic industries. It has been esti-mated that 10–15% of the total amount of dyes are released into the environment during manufacturing (Nam and Renganathan, 2000; Moutaouakkil et al., 2003; Mansour et al., 2007), such a discharge being undesirable for esthetic reasons and also be-cause many azo dyes and their breakdown products are toxic, mutagenic and carcinogenic to both humans and aquatic life
(Spadaro et al., 1992; Van Der Zee et al., 2001; Pinheiro et al., 2004; Seesuriyachan et al., 2007).
The toxic effects of azo dyes, mainly their mutagenicity, can be caused by both the dyes themselves and by their metabolites, such as arylamines and free radicals (Collier et al., 1993; Weisburger, 1997). One of the criteria used to classify a dye as harmful to hu-mans is its ability to reductively cleave, and consequently to form aromatic amines when in contact with sweat, saliva or gastric juices. Some of these aromatic amines are carcinogenic and can accumulate in food chains (Pielesz, 1999; Pielesz et al., 2002). Examples of such aromatic amines are the biphenylamines such as benzidine and 4-biphenylamine, which are present in the envi-ronment, constituting a threat to human health and to the ecosys-tems in general (Choudhary, 1996; Chung et al., 2000).
After the oral ingestion of an azo dye, it can be reduced to free aromatic amines by anaerobic intestinal microflora and possibly by mammalian azo reductase in the intestinal wall or in the liver (Umbuzeiro et al., 2005). Such a biotransformation can occur in a wide variety of mammalian species including bothRhesusmonkeys
0887-2333/$ - see front matterÓ2011 Elsevier Ltd. All rights reserved. doi:10.1016/j.tiv.2011.05.033
⇑Corresponding author. Tel.: +55 16 3602 0663.
E-mail address:[email protected](F.M.D. Chequer).
Contents lists available atSciVerse ScienceDirect
Toxicology in Vitro
(Rinde and Troll, 1975; Prival and Mitchell, 1982) and humans (Watabe et al., 1980).
The activation of azo dyes involves nitro reduction and azo reduction (Umbuzeiro et al., 2005), and thus it is reasonable that the intestinal microflora play an important role in this activation process (Chung, 1983; Chung et al., 1992; Lima et al., 2007), and the CYP450 enzymes present in the intestine could also play a part in the activation of these dyes (Umbuzeiro et al., 2005; Lima et al., 2007).
According to Chequer and coworkers (2009), exposure to the azo dye Disperse Red 1 (DR1) causes an increase in the frequency of micronuclei (MN) in human lymphocytes and in HepG2 cells, in a dose-dependent manner (Chequer et al., 2009). This dye also exhibited mutagenic activity in the Salmonella/microsome assay with the strains TA98, TA100, YG1041 and YG1042 in the absence of metabolic activation, but after adding the S9 mix, its mutagenic-ity was decreased (or eliminated). It has been proposed that the P450-dependent metabolism probably generated more stable products, with a reduced probability of interacting with DNA (Ferraz et al., 2010). It is therefore important to know the toxicity of both the original dye and its metabolic products, since the efflu-ent treatmefflu-ent applied by industries does not completely remove the mutagenic compounds, and consequently they can be found in treated water (Oliveira et al., 2007).
Thus the aim of the present study was to investigate the oxida-tion and reducoxida-tion products obtained from the azo dye DR1 using the methodologies of HPLC–DAD and GC–MS. It also proposed to evaluate the mutagenic potential of these products using two dif-ferent methods: theSalmonella/microsome assay with the strains TA98 and YG1041 in the absence of exogenous metabolic activa-tion (S9), and the mouse lymphoma assay (MLA). TheSalmonella/ microsome mutagenicity assay (Salmonella test; Ames test) is a short-term bacterial reverse mutation assay specifically designed to detect a wide range of chemical substances that can produce ge-netic damage leading to gene mutation (Mortelmans and Zeiger, 2000). The MLA, using the thymidine kinase (Tk) gene as the target, is the most widely used of thein vitroassays for gene mutation in mammalian cells (Moore et al., 2003), detecting a broad spectrum of genetic damage, such as gene and chromosomal mutations (Cle-ments, 2000; Soriano et al., 2007).
2. Materials and methods
2.1. Chemical compound
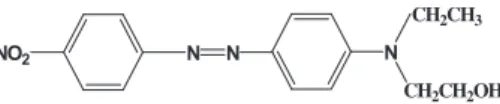
The dye DR1 (CAS No. 2872–52-8) was purchased from Sigma (St. Louis, MO, purity > 95%) (Fig. 1).
2.2. Investigation of metabolic pathways of the dye Disperse Red 1
The metabolic pathways of the dye were investigated using the mimetic system based on oxidation and reduction processes. The oxidation reactions were evaluated using three different tech-niques, one enzymatic (using an exogenous metabolic system – S9 mixture) and two chemical techniques (spectroelectrochemis-try and controlled potential electrolysis). The reduction reactions were carried out by the two techniques used in chemical oxidation.
2.2.1. Oxidation by the microsomal rat liver metabolizing system (S9) The S9 metabolizing system is widely used in mutagenicity as-says (mainly theSalmonella/microsome mutagenicity assay) in or-der to mimic the oxidation reactions that take place via cytochrome P450. These reactions are extremely important in tox-icology, because they may generate more or less toxic products, i.e. bioactivation and detoxification, respectively. Considering this, the
role of the cytochrome P450 isoenzymes in the chromophore group of this dye was monitored spectrophotometrically in the present study, promoting the reaction between DR1 and S9, as described below.
The metabolic activation system (S9 mixture) was provided by the Aroclor 1254 induced Sprague Dawley rat liver S9 mix (MolTox, Boone, USA), which was prepared at a concentration of 4% (v/v) as previously described (Maron and Ames, 1983). The dye solutions (1.010 4mol L 1) were incubated with different volumes of S9 mixture, varying between 50 and 500
l
L, for 90 min at 37°C. Due to precipitation of the S9 proteins, interference in the spectro-photometric determination was observed. It was thus decided to extract the product of the reaction between the dye and S9, by shaking briefly with three 3 mL aliquots of dichloromethane. After completely drying each extract at room temperature, methanol was added to resuspend it, and the spectrometric analyses then carried out.The products formed from reactions with the S9 system were monitored by High Performance Liquid Chromatography coupled to a Diode Array detector (HPLC/DAD) (Shimadzu SCL-10AVR HP and 8453, respectively). The spectrophotometric measurements were made using a Hewlett Packard spectrophotometer. The con-ditions for the HPLC/DAD were: mobile phase acetonitrile: water (80:20 v/v), flow 1 mL/min, injection volume of 20 mL, room
tem-perature and a Varian G-ODS (C18) separation column
(4250 mm, 5 mm).
2.2.2. Spectroelectrochemical oxidation and reduction of the dye The solution of the dye DR1 was prepared in dimethyl sulfoxide (DMSO) containing 0.1 mol L 1 tetrabutylammonium tetrafluoro-borate (TBABF4) as the supporting electrolyte. For the reductive process, nitrogen (99.7% purity) was bubbled into the dye solution for 10 min to remove the oxygen. A three-electrode system was used with a gold wire as the working electrode, a platinum wire as the auxiliary electrode and an Ag/AgCl (3 mol L 1) electrode as the reference electrode. The spectra were monitored until the reac-tion was stabilized, with measurements every 10 min.
The oxidation and reduction reactions were carried out at a po-tential of +1.5 and 1.5 V, respectively. The concentration of the DR1 dye in the solution was monitored by measuring changes in the absorbance at specified time intervals, using a Hewlett Packard 8453 diode array spectrophotometer operating at wavelengths be-tween 200 and 1200 nm.
2.2.3. Controlled potential electrolysis and voltammetric
All the electrochemical measurements were carried out using a Potentiostat EG&G model 283 (PAR) in a conventional 10.0 mL electrochemical cell into which the following three electrodes were inserted: an Ag/AgCl (KCl 3.0 mol L 1) reference electrode, a plati-num gauze as the auxiliary electrode and a glassy carbon working electrode (area of 3.14 mm2 for the voltammetric measurements and 4 cm2for the electrolysis experiments).
The voltammetric curves were obtained by transferring 10 mL of methanol/0.01 mol L 1 tetrabutylammonium tetrafluoroborate solution into the voltammetric cell, and the required volume of the stock solution of the original dye DR 1 and its reduction and oxidation products, separately, were added using a micropipette. The solution was purged with nitrogen for 15 min and the voltam-metric curves were recorded.
N
NO2 N
CH2CH2OH CH2CH3
N
Fig. 1.Chemical structure of the dye Disperse Red 1.
In order to obtain sufficient metabolized dye for the analysis of the aromatic amines using HPLC/DAD and GC/MS, the oxidation and reduction process was also carried out using controlled poten-tial electrolysis. The solutions of the dye DR1 were prepared at 3.1810-4mol L-1 and 610-3mol L-1 in 0.01 mol L-1 DMSO/ TBABF4. Oxidation and reduction were carried out using +1.5 and 1.5 V, respectively, and the reactions monitored every 30 min during the total analysis time of 2.5 h. The products generated were analyzed by transference of the electrolyzed samples under defined experimental conditions. The color of the solution was measured according to the UV–Vis spectra. The HPLC–DAD analysis was carried (under the conditions described below) using a pre step of sample filtration in a MILLEX Millipore (0.45
l
m) system.2.3. Chromatographic analysis
2.3.1. HPLC/DAD analysis
The HPLC/DAD analysis of the oxidation and reduction products obtained from the dye DR1 after the controlled potential electrol-ysis process, was carried out using a Shimadzu CLC-ODS (C18) re-versed-phase column (25 cm4.6 mm5
l
m, 100 A) connectedto a Shimadzu CLC-ODS (C18) guard column (1 cm4.6 mm
5
l
m, 100 A). The best experimental conditions for these productsunder the optimized isocratic mode were: a mobile-phase of methanol/acetonitrile 50:50 v/v, a flow rate of 1.0 mL/min and a column temperature of 40°C. The analysis time was 10 min and all the analyses were carried out in triplicate.
The optimized conditions for the HPLC/DAD identification and quantification of the aromatic amines and other compounds pre-sents in the oxidation and reduction products were a mobile-phase of methanol/phosphate buffer 510 5mol L 1(pH 6.9) + 20 mM of triethylamine in a proportion of 50:50 v/v, a flow rate of 1.0 mL min 1 and a column temperature of 40°C (condition 1). However other amines were better separated under similar
exper-imental conditions but using methanol/phosphate buffer
5.010 5mol L 1(pH 6.9) + 20.0 mM of triethylamine in a pro-portion of 80:20 (v/v), a flow rate of 1.0 mL min 1and a column temperature of 40°C (condition 2). All these methodologies were carried out based on chromatographic parameters such as reten-tion time (tR), retention constant factor (k), selectivity (
a
), the res-olution between peaks (r) and the theoretical plate number (N). Standard curves and a quantitative analysis of the target amines were carried out by linear regression of the plotting of peak area vsconcentration, and a further comparison by the standard addi-tion method using spiking aliquots of the working standard in methanol. The procedure was carried out in triplicate for each sam-ple. Characteristic UV–Vis spectra (CVS) obtained by diode array detection under the hydrodynamic conditions were recorded and used as parameters to identify and confirm the investigated spe-cies, subsequently comparing with the spectra recorded for the pure samples of each component in the CVS sample.2.3.2. GC/MS analysis
In order to confirm the products detected by HPLC–DAD, the DR1 solutions obtained after oxidation and reduction controlled potential electrolysis, were injected into the Gas Chromatograph coupled with Mass Spectrometry (GC–MS).
Gas chromatography–mass spectrometry analysis was carried out using a Shimadzu GCMS model QP2010 apparatus. The carrier gas (He) was adjusted to a constant flow rate (1.0 mL/min). The DB5-MS column [30 m0.25 mm i.d., film thickness 0.25
l
m(5% cross-linked phenyl-methylpolysiloxane)] was temperature controlled from 80 (0 min hold) to 290°C at 15°C/min, and then isothermally at 290°C for a further 30 min, giving a total analysis time of 45 min. The injection volume was 1.0
l
g mL 1, and theinjector temperature was set at 220°C with a split ratio of 1:5.
The column outlet was inserted directly into the electron ioniza-tion source block operating at 70 eV, and the scan range was 50– 500 Da. The mass spectral identification was investigated by com-parison with the Wiley and NIST commercial mass spectral databases.
2.4. Mutagenicity testing
2.4.1. The Salmonella/microsome assay
The Salmonella/microsome assay with the strains TA98 and YG1041 without S9 was used for the evaluation of the mutagenic activity of the oxidation and reduction products of the azo dye Dis-perse Red 1. These strains were chosen based on the results of Fer-raz and coworkers (2010), who showed that the mutagenicity of DR1 detected with TA98 and YG1041 was higher when compared with TA100 and YG1042, suggesting that the mutagenic activity of this dye was mainly due to frame-shift mutations. In the present study the pre-incubation protocol described byMaron and Ames (1983)and by Mortelmans and Zeiger (2000)was used. Briefly: 100
l
l overnight cultures ofSalmonella typhimurium of the TA98and YG1041 strains, 500
l
l of 0.2 mol L 1sodium phosphate bufferand 100
l
l of the test sample were added to sterilized tubes. Thesewere homogenized and incubated at 37°C for 30 min, and 2.0 mL of molten top agar then added, the mixture homogenized and poured into a Petri plate containing 20 mL of minimal agar. The plates were incubated in the inverted position for 66 h at 37°C (±0.5). DMSO was used as the negative control and 4-nitroquino-line-1-oxide (4NQO; CAS number 56-57-5), at a concentration of 0.5
l
g/plate for TA98 and 4-nitro-O-phenylenediamine (CASnum-ber: 99-56-9) at a concentration of 1.0
l
g/plate for YG1041, as thepositive controls. The test was carried out in triplicate.
The colonies were counted by hand and the background cafully evaluated. The mutagenic potencies of these oxidized and re-duced solutions of the dye Disperse Red 1 were obtained using Salanal software, a program developed by Integrated Laboratory Systems, Research Triangle Park, NC USA for the statistical analysis of the Salmonella/microsome assay, using the Bernstein model (Bernstein et al., 1982). Samples were considered positive when a significant ANOVA and dose response was obtained and the muta-genic potency was expressed in revertants/
l
g of compound.2.4.2. Mouse lymphoma assay
MLA was carried out according toSoriano et al. (2007), using L5178Y/Tk± 3.7.2C kindly provided by Dr. Olivier Gillardeux (Sano-fi-Synthélabo, Paris, France). The cells were cultured in a suspen-sion using RPMI 1640 supplemented with 10% heat-inactivated horse serum, 2 mML-glutamine, 100 U/mL penicillin, 100
l
g/mLstreptomycin, 1 mM sodium pyruvate and 2.5
l
g/mL ofamphoter-icin B. The serum concentration was reduced to 5% during treat-ment and increased to 20% when the cells were dispensed into the microwells.
Preliminary experiments were carried out to determine the sol-ubility and cytotoxicity of the chemical compounds to be tested. The cytotoxicity was determined by way of the relative total growth (RTG) after 4, 24 and 48 h of treatment at concentrations from 0.1 to 500
l
g/mL, without metabolic activation.2.4.2.1. Gene mutation assay.MLA was carried out as previously de-scribed (Soriano et al., 2007). TheTk / mutants were selected add-ing 4
l
g/mL of TFT to each culture.TFT was added to the cultures (1104cells/mL) to a final con-centration of 4
l
g/mL. Each culture was treated with TFT,solution (MTT, 2.5 mg/mL) was added to each well, and the plates incubated for 4 h so that the cell colonies could acquire a black col-oration. The colony size was estimated in a manner similar to that described byHonma et al. (1999): a small colony was defined as one with a size6one-fourth of the well diameter.
2.4.2.2. Statistical analysis. The statistical approach used was a one-way ANOVA followed by the Dunnett test, which was used to as-sess the significance of the difference in MF (mutant frequency) be-tween the control and treated cultures. The dose–response was also calculated by testing for linear trend (Moore et al., 2003; McC-lain et al., 2006). The level of statistical significance was set at 5%.
3. Results
3.1. Oxidation profile of the dye Disperse Red 1
Initially, a preliminary experiment was carried out to determine the best experimental conditions for the spectrophotometric anal-ysis of DR1. Thus a spectrophotometric profile of the dye DR1 at different concentrations (2.510 5, 5.010 5, 7.510 5 and 1.010 4mol L 1) dissolved in DMSO (data not shown) was car-ried out. After this initial analysis, the best working condition was established as being 1.010 4mol L 1. DR1 showed a band at 510 nm corresponding to the chromophore group (azo group), i.e. the portion of the molecule responsible for the color of the dye. After fixing 1.010 4mol L 1as the best experimental condi-tion, the dye was reacted with the S9 mixture.Fig. 2(A and B) clearly shows that the chromophore group of DR1 is completely metabolized by the Cytochrome P450 isoenzymes, detected by suppression of the peak at 510 nm in the UV–Vis spectra and also by the removal of the peak attributed to the dye attR= 5.5 min by HPLC/DAD. In addition, under the optimized conditions for HPLC/ DAD, sulfate 2-[(4-aminophenyl)ethylamino]-ethanol monohy-drate was detected as the resultant product after the reaction with S9, at a ratio of 5%.
The cleavage of the azo bond by the oxidative process was con-firmed by the results obtained with the electrochemical oxidation experiments. It can be seen inFig. 3that the band characteristic of the chromophore group of DR1 (at 510 nm) decreased during the electrolysis when performed at +1.5 V for up to 50 min. Concomi-tantly, a new peak was observed at 640 nm, due to the formation of stable radicals and change in color. After 90 min of electrolysis, the total removal of the bands due to the chromophore group, total discoloration and loss of the extra bands at 640 nm were verified
(Fig. 3). This indicates that the spectroelectrochemical technique detected the radical as an intermediate product, which vanished in the presence of oxygen or after a long electrolysis time. Accord-ing to this findAccord-ing, sulfate 2-[(4-aminophenyl)ethylamino]-ethanol monohydrate with a retention time (tR) of 10.0 min and nitroben-zene (tR= 12.0 min), in a proportion of 6% and 7% respectively, were detected after 2.5 h of oxidation by controlled potential elec-trolysis (Fig. 4).
3.2. Reduction profile of the dye Disperse Red 1
With the objective of determining whether this effect also oc-curred under reducing conditions, the experiments were repeated monitoring the reduction of 3.1810 4mol L 1 in 0.01 mol L 1 DMSO/TBABF4 slightly acidified with acetic acid, using a potential of 1.5 V. The UV–Vis spectra recorded simultaneously during the reduction of Red 1 indicated a decrease in the band at 510 nm up to 60 min, but there was no extra peak at 640 nm (Fig. 5).
The DR1 dye solution (3.1810 4mol L 1 in 0.01 mol L 1 DMSO/TBABF4) was also subjected to 2.5 h reduction using
0 1 2 3 4 5 6 7 8 9 10 11 12 13 14 15
0 1x10⁴ 2x10⁴ 3x10⁴ 4x10⁴ 5x10⁴
antesreação
apósreação
200 300 400 500 600 700 800 0.0
0.1 0.2 0.3 0.4 0.5 0.6
A
a b
λ/(nm) Run time/min
After reaction Before the reaction
Area/mUA
(A)
(B)
Fig. 2.Results obtained after reaction of the dye Disperse Red 1 (1.010 4mol L1) with 300 mL of S9 (4% v/v) followed by extraction with dichloromethane. (A) Absorption spectra in the UV–Vis region and (B) HPLC/DAD chromatogram with a mobile phase of acetonitrile: water (80:20), flow rate of 1 mL min1, Injection volume of 20 mL, room
temperature for the column and analysis atk= 502 nm.
300 400 500 600 700 800
0.0 0.5 1.0 1.5 2.0 2.5 3.0 3.5
Absorbance
λ(nm)
Fig. 3. Spectra obtained during electrochemical oxidation of the dye Disperse Red 1 at 1.010 4mol L1in DMSO/TBABF4 (0.1 mol L 1). The spectra were recorded every 10 min under a fixed potential of +1.5 V. The black line corresponds tot= 0, red tot= 10 min, light green tot= 20 min; dark blue tot= 30 min, light blue to
t= 40 min and purple tot= 50 min. (For interpretation of the references to color in this figure legend, the reader is referred to the web version of this article.)
controlled potential electrolysis, the solution being previously deaerated by bubbling in N2(99.7% purity) for 10 min. The reaction was monitored every 30 min and the band corresponding to the chromophore group was totally suppressed after only 2 h of elec-trolysis. However, even under these conditions there was no evi-dence of the formation of intermediate stable radicals during the reduction process of the nitro group of the DR1 dye.
Thus the electrolyzed product was submitted to extraction and identified by HPLC/DAD, which indicated the formation of the same aromatic amine (sulfate 2-[(4-aminophenyl)ethylamino]-ethanol monohydrate) previoulsy detected in a proportion of 9%. Nitrobenzene was not detected under these conditions.
Using GC/MS 4-nitro-benzamine was also detected, after both the oxidation and reduction processes, confirming the generation of aromatic amines after cleavage of the bond. According to the mass spectra corresponding to the peaks, the peakstR= 13.576 min and 13.513 min (Fig. 6A and B, respectively) are related to the sub-stance 4-nitro-benzamine (Fig. 7). In addition, after an analysis of
the reduction products, 2-(ethylphenylamino)-ethanol was also detected.Table 1summarizes the products detected after the oxi-dation and reductions reactions.
3.3. Evaluation of the mutagenicity of the oxidation and reduction products using the Salmonella/microsome and MLA tests
As mentioned in Section 2, the mutagenicity of the products formed during electrochemical oxidation and reduction of the dye DR1 were evaluated using both theSalmonella typhimurium and mouse lymphoma assays.
For the Salmonellaassay, the strains TA98 and YG1041 were chosen, which both show a high production of enzymes including nitroreductase and acetyltransferase, based on the results obtained by the authors’ research group (Ferraz et al., 2010). The tests were only carried out in the absence of S9, considering that the dye had already undergone the chemical metabolism process.
The oxidation products of the dye DR1 showed a mutagenic re-sponse to TA98 and YG1041 in the absence of S9 (Fig. 8A and B). Analyzing this figure, it can be seen that the mutagenic potency of the oxidized dye with the YG1041 strain (184.30 rev/
l
g) wasabout 5 times higher than with the TA98 strain (35 rev/
l
g),show-ing the importance of nitroreduction and acetylation in the muta-genicity of these products.
Fig. 9shows the mutagenic responses of the reduction products with the TA98 (A) and YG1041 (B) strains. The results presented by the oxidation and reduction products were similar; however the mutagenic potentials presented by the oxidized dye for both strains were higher than those obtained by the reduced products (Fig. 10). In addition it can be seen that the mutagenic potentials in the test with the YG1041 strain were smaller for the oxidized and reduced products as compared to the original dye, whereas for the strain TA98 the opposite effect occurred. The data for the original DR1 dye can be found in a previous paper (Ferraz et al., 2010).
With respect to the MLA test,Table 2shows the average of the results obtained after treatment of the mouse lymphoma cells with six concentrations of the Disperse Red 1 dye. Each concentration was tested in two independent experiments and good concordance was observed between them. Positive controls with methyl meth-anesulfonate (MMS 10
l
g/mL) were run in parallel, showing clearand significantly increased mutant frequencies. This procedure was repeated using solutions of the oxidized and reduced Disperse Red 1 dye. However, none of the concentrations of the original, oxi-dized or reduced azo dye DR1 induced mutagenic effects in the MLA, as shown inTables 2–4.
However, high cytotoxicity was observed with the reduction products of DR 1, and the concentrations of 175, 200 and 250
l
g/mL presented relative total growth below 20% (data not shown).
4. Discussion
Concern about the carcinogenic risk of azo dyes and their breakdown products started with the study published by Rehn (1985) as cited inDipple et al., 1985, who observed that workers from an aniline dye factory in Germany developed urinary bladder cancers. This fact prompted the subsequent animal testing of various chemicals to which these workers were exposed, and the conse-quent discovery of the carcinogenic activity of the azo dye 20 ,3-di-methyl-4-aminoazobenzene for the liver of rats and mice (Yoshida, 1933 as cited inDipple et al., 1985). An isomeric com-pound,N,N-dimethyl-4-aminoazobenzene was subsequently found to induce the same toxic effect (Kinosita, 1936 as cited inDipple et al., 1985). In this context, it is important to determine the muta-genic activity not only of the azo dyes, but also of their metabolites, 0 1 2 3 4 5 6 7 8 9 10 11 12 13 14 15
0.0 2.0x10⁵ 4.0x10⁵ 6.0x10⁵ 8.0x10⁵ 1.0x10⁶ 1.2x10⁶
1hora 2horas 2.5horas Pico 1 Pico 2 Peak 1
Peak 2
Run time/min
Zero time
0.5 hour
1 hour
2 hour
2.5 hour
Area/mUA
Fig. 4.Chromatogram of the oxidation products obtained from the dye Disperse
Red 1 (3.1810 4mol L1) with a controlled potential for 2.5 h. Peak 1: sulfate 2-[(4-aminophenyl)ethylamino]-ethanol monohydratetR= 10.0 min. Peak 2:
nitro-benzenetR= 12.0 min. Chromatographic conditions: mobile phase =
MeOH/phos-phate buffer 50:50 (pH 6.9, 30lM), temperature = 40°C, flow rate = 1.0 mL min 1, k= 230 nm and injection volume = 20lL.
300 400 500 600 700 800 900
0.0 0.2 0.4 0.6 0.8 1.0 1.2 1.4 1.6
Absorbance
λ(nm)
Fig. 5.Spectra obtained during the reduction of the dye Disperse Red 1 at
1.010 4mol L1in DMSO/TBABF
4(0.1 mol L 1) plus 0.3% acetic acid. Spectra
recorded every 10 min to a total electrolysis time of 60 min under a fixed potential of 1.5 V. The black line corresponds tot= 0, red tot= 10 min, light green to
considering that great amounts of these compounds are used all over the world for coloring proposes, and can reach the environment.
Azo dyes can be ingested by humans and other living beings through the consumption of contaminated food or water, and can then suffer oxidation or reduction processes in the body, with the consequent generation of products more or less toxic than the original molecules (Chung, 1983; Umbuzeiro et al., 2005; Man-sour et al., 2007). For instance, it has been shown thatN -demeth-ylation,N-oxidation and esterification reactions are involved in the activation of p-dimethylaminoazobenzene to a primary carcino-genic agent. On the other hand, detoxication is associated with C-oxidation and the reductive cleavage of the azo bond (Zbaida et al., 1989).
Hence the importance of studying the possible products formed after metabolism of the azo dye Disperse Red 1, considering that this compound showed mutagenic potential in human lympho-cytes and in HepG2 cells (Chequer et al., 2009) and in the Ames Test (Ferraz et al., 2010).
There is little available data concerning the products formed after the oxidation of azo dyes. It is known that these com-pounds may be oxidized to N-hydroxy derivates by cytochrome P450. TheN-hydroxy radicals can be acetylated by enzymes such as O-acetyltransferase, generating electrophilic nitrenium ions that can react with DNA to form adducts (Chung et al., 1992; Arlt et al., 2002; Umbuzeiro et al., 2005). In the present work three oxidation and two reduction reactions were used aimed
Fig. 6.Chromatograms corresponding to the reactions of: (A) oxidation and (B) reduction of the dye Disperse Red 1.
Fig. 7.(A) Mass spectra of the samples (B) mass spectrum of the standard 4-nitro-benzamine (similarity 97%).
at mimicking the hepatic metabolism via cytochrome P450.
Moreover, for the Salmonella mutagenic assay, the strain
YG1041 was used, which overproducesO-acetyltransferase when compared to TA98, in order to evaluate the role of this enzyme
Table 1
Oxidation and reduction products obtained from the azo dye evaluated and identified using CG–MS and HPLC–DAD.
Analysis Oxidation products Reduction products
CG–MS 4-Nitro-benzamine 4-Nitro-benzamine
NH2
O2N O2N NH2
CG–MS – 2-(Ethylphenylamino)-ethanol
N OH
HPLC–DAD Sulfate 2-[(4-aminophenyl)ethylamino]-ethanol monohydrate Sulfate 2-[(4-aminophenyl)ethylamino]-ethanol monohydrate
H2N N OH
SO-4 .H2O
H2N N OH
SO
-4 .H2O
HPLC–DAD Nitrobenzene –
NO2
Fig. 8.Comparison of the mutagenicity profiles of the oxidation products from the dye Disperse Red 1 with the strains TA98 (A) and YG1041 (B) in the absence of S9. The
numbers between brackets were generated as the values for the slope by theBernstein et al. model (1982)and represent the potency of the compound expressed in revertants per microgram.
Fig. 9.Comparison of the mutagenicity profiles of the reduction products from the dye Disperse Red 1 with the strains TA98 (A) and YG1041 (B) in the absence of S9. The
in the toxic effect of the dye after the oxidation/reduction reactions.
Ferraz et al. (2010)investigated the mutagenicity of DR1 using the Salmonella assay, and described a 75–80% decrease in dye mutagenicity in the presence of S9, clearly showing that the oxida-tive biotransformation of DR1 is crucial for the toxic effect. It is important to point out that the S9 mixture is a homogenate of rat liver cells pretreated with Aroclor-1254. Thus, substances which exert their mutagenic activity after being metabolized via cytochrome P450 may be generated by the addition of S9 (Jarvis et al., 1996). Considering this, the role of the cytochrome P450 isoenzymes in the chromophore group of this dye was monitored spectrophotometrically. The data clearly showed that the oxidation processes with both the exogenous metabolic (S9) and electrochemical systems were able to metabolize the azo group, generating aromatic amines and other compounds such as
Fig. 10.Comparison of the results obtained for the original (Ferraz et al., 2010), oxidized and reduced Disperse Red 1 dye.
Table 2
Toxicity and mutagenicity of the original dye Disperse Red 1 in mouse lymphoma cells.
Concentration (lg/mL) Percent plating efficiency Mutant frequency (10 6) Relative total growth MF (S/L)a IMF (MF SMF)b
Original Disperse Red 1
0 72 154 100 108/46 –
0.1 89 126 120 97/29 28
1 82 165 113 125/40 11
10 70 164 81 103/61 10
50 76 140 76 97/43 14
100 80 161 84 116/45 7
250 71 150 31 110/40 4
MMS (10lg/mL) 48 789* 61 652/137 635
*P60.05 (significantly different from negative control).
a Total mutant frequency divided into small/large (S/L) colony mutant frequencies.
b MF SMF = IMF (induced mutant frequency), where MF is one of the frequencies of the mutants in the test culture and SMF is the frequency of spontaneous mutants.
Table 3
Toxicity and mutagenicity of the oxidized azo dye Disperse Red 1 in mouse lymphoma cells.
Concentration (lg/mL) Percent plating efficiency Mutant frequency (10 6) Relative total growth MF (S/L)a IMF (MF SMF)b
Oxidized Disperse Red 1
0 90 96 100 71/25 –
0.1 85 215 87 166/49 119
1 76 182 82 121/61 86
10 73 216 73 158/58 120
50 76 169 74 123/46 73
100 82 166 56 106/60 70
250 81 196 40 181/15 100
MMS (10lg/mL) 42 998* 36 871/127 902
*P60.05 (significantly different from negative control).
a Total mutant frequency divided into small/large (S/L) colony mutant frequencies.
b MF SMF = IMF (induced mutant frequency), where MF is one of the frequencies of the mutants in the test culture and SMF is the frequency of spontaneous mutants.
Table 4
Toxicity and mutagenicity of the reduced azo dye Disperse Red 1 in mouse lymphoma cells.
Concentration (lg/mL) Percent plating efficiency Mutant frequency (10 6) Relative total growth MF (S/L)a IMF (MF SMF)b
Reduced Disperse Red 1
0 85 149 100 124/25 –
0.1 85 121 97 83/38 28
1 75 201 87 147/54 52
10 98 130 82.5 105/25 19
50 79 158 68.5 134/24 9
100 78 186 49.5 159/27 37
150 75 253 32.5 208/45 104
MMS (10lg/mL) 54 749* 56.5 681/68 600
*P60.05 (significantly different from negative control).
a Total mutant frequency divided into small/large (S/L) colony mutant frequencies.
b MF SMF = IMF (induced mutant frequency), where MF is one of the frequencies of the mutants in the test culture and SMF is the frequency of spontaneous mutants.
4-nitro-benzamine, sulfate 2-[(4-aminophenyl)ethylamino]-etha-nol monohydrate and nitrobenzene.
In addition to oxidation, the induction of hepatic microsomal azoreductase by cytochrome P-450 is very important in the muta-genic activity of azo dyes (Chung et al., 1992). In this case, the azo bond is cleaved primarily by azoredutases with the consequent for-mation of aromatic amines. As previously mentioned, in
mamma-lian systems azoreduction is catalyzed by bacteria with
azoreductase activity in the intestinal tract, and by hepatic en-zymes in the liver. The bacterial azoreductases are much more ac-tive than liver azoreductases (Watabe et al., 1980; Collier et al., 1993; Rafii et al., 1997). For instance, the mutagen benzidine is formed after metabolism of the azo dye Direct Black 38 by human intestinal microflora (Combes and Haveland-Smith, 1982; Chung, 1983; Cerniglia et al., 1986).
Some azo dyes, such as Brown FK, Red 2G, Acid Black 1 and Di-rect Blue 2b, are diDi-rectly mutagenic in bacterial tests. However, many other azo dyes, such as Red No. 9 and Direct Black 38 only showed positive responses for mutagenicity after chemical reduc-tion processes, incubareduc-tion with rodent caecal extract or incubareduc-tion with human intestinal tract contents (Haveland-Smith and Com-bes, 1980; Reid et al., 1983; Cerniglia et al., 1986; Chung and Cerneglia, 1992; Rafii et al., 1997).
The present findings showed that reduction reaction of the DR1 also altered the azo bond, as noted by the decrease in the charac-teristic band of the chromophore group during electrolysis at 1.5 V. Besides, there was no evidence of the formation of interme-diate stable radicals during the reduction process of the nitro group of the DR1 dye. This is important because the formation of stable radical species could lead to the formation of more reactive species that could attack specific sites on the nitrogenated base of the DNA (Hunger, 1994; Rafii et al., 1997), changing the action mechanism of the dye. In addition, the results of the chemical analysis using HPLC/DAD and GC/MS demonstrated that aromatic amines such as sulfate 2-[(4-aminophenyl)ethylamino]-ethanol monohydrate, 4-nitro-benzamine and 2-(ethylphenylamino)-ethanol, were also generated after reduction of the dye DR1.
Of all the compounds identified in this work as possible metab-olites of this dye, the most dangerous is nitrobenzene, which in-duces methemoglobinemia, and the International Agency for Research on Cancer (IARC) has classified it as a possibly carcinogen for humans (2B) (IARC, 1996; Bhatkhande et al., 2003; Lepera, 2008).
The compound 4-nitro-benzamine was also identified after oxidation and reduction of the dye DR1, but no data were found in the literature on the mutagenic or carcinogenic potential of this chemical. However, the solution obtained after the reduction and oxidation of DR1 tested positive in the Salmonella mutagenicity assay, showing greater responses with YG1041 as compared to TA98, showing the importance of the enzymes nitroreductase and acetyltransferase in the toxic effect of the DR1 metabolites. This result agrees with the study carried out by Osugi et al. (2009)andFerraz et al. (2010), who demonstrated the mutagenic potential of the original dye. This result can be explained by the chemical structure of each dye, because a relevant property of environmental genotoxic mutagens is related to the high electro-philic character of the molecule or its derivative (Osugi et al., 2009). This characteristic raises the possibility of a reaction with the nucleophilic groups of DNA, leading to adduct generation. If this genotoxic effect is not reverted, it can induce a permanent mutation in the DNA, and this mutation could be detected by the Salmonellaassay (Pinto and Felzenszwalb, 2003; Osugi et al., 2009). McCann and coworkers (1975)tested 61 aromatic amines and azo dyes using the Salmonella/microsome mutagenicity test and observed a 90% correlation between carcinogenicity and mutage-nicity (McCann et al., 1975; Chung, 1983). A necessary prerequisite
for carcinogenicity may be the transformation of azo dyes by intes-tinal bacteria. In the gut, the metabolites of the azo dyes may then be reabsorbed from the digestive tract, and so act adversely with the body tissue to originate tumors (Chung, 1983).
The MLA system was also used to evaluate the mutagenicity of the original dye DR1 and of the products obtained after biotrans-formation processes. MLA allows for differentiation of the large and small colonies. It is believed that small colonies are induced by chromosomal damage and large colonies by gene mutations (Hozier et al., 1981; Moore et al., 1985; Jäger et al., 2004).
Accordingly it would be expected that Ames-positive samples should be characterized by an induction of large colonies in MLA (Jäger et al., 2004). However this was not observed in the present study: both the dye DR1 and its oxidation and reduction products were negative in the MLA, with a greater number of small as com-pared to large colonies. HoweverClements (2000)observed that colony size did not necessarily predict whether a chemical com-pound was a mutagenic or clastogenic agent causing chromosomal breaks.
According toJäger et al. (2004), who carried out the MLA with nine textile dye products that showed positive results in the Ames test, only 60% of these induced genotoxic effects in the MLA (i.e. only six of the nine were positive in the MLA). Therefore there was no clear correlation between mutations in the Salmonella/ microsome test and the induction of large colonies in the MLA (Jäger et al., 2004).
In conclusion, the azo dye Disperse Red 1 can be metabolized by hepatic enzymes generating mutagenic compounds such as nitro-benzene, which can contribute to the observed effect. Thus this dye should be used with caution and effective treatments of efflu-ents and of drinking water should be applied in order to avoid environmental and human contact with this compound, due to the generation of mutagenic products after oral exposure.
5. Conflict of Interest
The authors declare there were no conflicting interests.
Acknowledgements
This work was supported by the Faculty of Pharmaceutical Sci-ence at Ribeirão Preto, University of São Paulo, Brazil, and by FA-PESP, CAPES and CNPq.
References
Anliker, R., 1977. Color chemistry and the environment. Ecotoxicol. Environ. Saf. 1, 211–237.
Arlt, V.M., Glatt, H., Muckel, E., Pabel, U., Sorg, B.L., Schmeiser, H.H., Phillips, D.H., 2002. Metabolic activation of the environmental contaminant 3 nitrobenzanthrone by human acetyltransferases and sulfotransferase. Carcinogenesis 23, 1937–1945.
Bernstein, L., Kaldor, J., Mccann, J., Pike, M.C., 1982. An empirical approach to the statistical analysis of mutagenesis data fromSalmonellatest. Mutat. Res. 97, 267–281.
Bhatkhande, D.S., Pangarkar, V.G., Beenackers, A.A.C.M., 2003. Photocatalytic degradation of nitrobenzene using titanium dioxide and concentrated solar radiation: chemical effects and scaleup. Water Res. 37, 1223–1230.
Cerniglia, C.E., Zhuo, Z., Manning, B.W., Federle, T.W., Heflich, R.H., 1986. Mutagenic activation of the benzidine-based dye Direct Black 38 by human intestinal microflora. Mutat. Res. 175, 11–16.
Chequer, F.M.D., Angeli, J.P.F., Ferraz, E.R.A., Tsuboy, M.S., Marcarini, J.C., Mantovani, M.S., Oliveira, D.P., 2009. The azo dyes Disperse Red 1 and Disperse Orange 1 increase the micronuclei frequencies in human lymphocytes and in HepG2 cells. Mutat. Res. 676, 83–86.
Choudhary, G., 1996. Human health perspectives on environmental exposure to benzidine: a review. Chemosphere 32, 267–291.
Chung, K.T., 1983. The significance of azo-reduction in the mutagenesis and carcinogenesis of azo dyes. Mutat. Res. 114, 269–281.
Chung, K.T., Stevens, S.E., Cerneglia, C.E., 1992. The reduction of azo dyes by the intestinal microflora. Crit. Rev. Microbiol. 18, 175–190.
Chung, K.T., Hughes, T.J., Claxton, L.D., 2000. Comparison of the mutagenic specificity induced by four nitro-group-containing aromatic amines in
Salmonella typhimurium hisgenes. Mutat. Res. 465, 165–171. Clements, J., 2000. The mouse lymphoma assay. Mutat. Res. 455, 97–110. Collier, S.W., Storm, J.E., Bronaugh, R.L., 1993. Reduction of azo dyes during in vitro
percutaneous absorption. Toxicol. Appl. Pharmacol. 118, 73–79.
Combes, R.D., Haveland-Smith, R.B., 1982. A review of the genotoxicity of food, drug and cosmetic colours and other azo, triphenylmethane and xanthene dyes. Mutat. Res. 98, 101–248.
Dipple, A., Michejda, C.J., Weisburger, E.K., 1985. Metabolism of chemical carcinogens. Pharmacol. Ther. 27, 265–296.
Ferraz, E.R.A., Umbuzeiro, G.A., De-Almeida, G., Catolo-Oliveira, A., Chequer, F.M.D., Zanoni, M.V.B., Dorta, D.J., Oliveira. D.P., 2010. Differential toxicity of Disperse Red 1 and Disperse Red 13 in the Ames test, HepG2 cytotoxicity assay, and Daphnia acute toxicity test, 2010. Environ. Toxicol., in press, doi:10.1002/ tox.20576.
Haveland-Smith, R.B., Combes, R.D., 1980. Genotoxicity of the food colours Red 2G and Brown FK in bacterial systems: use of structurally-related dyes and azo-reduction. Food Cosm. Toxicol. 18, 223–228.
Honma, M., Hayashi, M., Shimada, H., Tanaka, N., Wakuri, S., Awogi, T., Yamamoto, K.I., Kodani, N., Nishi, Y., Nakadate, M., Sofuni, T., 1999. Evaluation of the mouse lymphoma tkassay (microwell method) as an alternative to the in vitro
chromosomal aberration test. Mutagenesis 14, 5–22.
Hozier, J., Sawyer, J., Moore, M., Howard, B., Clive, D., 1981. Cytogenetic analysis of the L5178Y Tk+/ ? / mouse lymphoma mutagenesis assay system. Mutat.
Res. 84, 169–181.
Hunger, K., 1994. On the toxicology and metabolism of azo dyes. Chimia 48, 520– 522.
IARC, Nitrobenzene, IARC Monographs on the Evaluation of Carcinogenic Risks to Humans, Vol. 65, IARC, Lyon, 1996, pp. 381–408.
Jäger, I., Hafner, C., Schneider, K., 2004. Mutagenicity of different textile dye products inSalmonella typhimuriumand mouse lymphoma cells. Mutat. Res. 561, 35–44.
Jarvis, A.S., Hokeycett, M.E., Mcfarland, V.A., Bulich, A.A., Bounds, H.C., 1996. A comparison of the Ames assay and Mutatox in assessing the mutagenic potential of contaminated dredged sediment. Ecotoxicol. Environ. Saf. 33, 193– 200.
Lepera, J.S., 2008. Agentes Metemoglobinizantes. In: Oga, S., Camargo, M.M.A., Batistuzzo, J.A.O. (Eds.), Fundamentos de Toxicologia, third ed. Atheneu Editora, São Paulo, pp. 261–274.
Lima, R.O.A., Bazo, A.P., Salvadori, D.M.F., Rech, C.M., Oliveira, D.P., Umbuzeiro, G.A., 2007. Mutagenic and carcinogenic potential of a textile azo dye processing plant effluent that impacts a drinking water source. Mutat. Res. 626, 53–60. Mansour, H.B., Corroler, D., Barillier, D., Ghedira, K., Chekir, L., Mosrati, R., 2007.
Evaluation of genotoxicity and pro-oxidant effects of the azo dyes: Acids yellow 17, violet 7 and orange 52, and of their degradation products byPseudomonas putidamt-2. Food Chem. Toxicol. 45, 1670–1677.
Maron, D.M., Ames, B.N., 1983. Revised methods for theSalmonellamutagenicity test. Mutat. Res. 113, 173–214.
McCann, J., Choi, E., Yamasaki, E., Ames, B.N., 1975. Detection of carcinogens as mutagens in the Salmonella/microsome test: Assay of 300 chemicals. Proc. Natl. Acad. Sci. USA 72, 5135–5139.
McClain, R.M., Wolz, E., Davidovich, A., Bausch, J., 2006. Genetic toxicity studies with genistein. Food Chem. Toxicol. 44, 42–55.
Moore, M.M., Clieve, D., Hozier, J.C., Howard, B.E., Batson, A.G., Turner, N.T., Sawyer, J., 1985. Analysis of trifluoro-thymidine-resistant (TFTr) mutants of L5178Y
Tk+/ mouse lymphoma cells. Mutat. Res. 151, 161–174.
Moore, M.M., Honma, M., Clements, J., Bolcsfoldi, G., Cifone, M., Delongchamp, R., Fellows, M., Gollapudi, B., Jenkinson, P., Kirby, P., Kirchner, S., Muster, W., Myhre, B., O’donovan, M., Oliver, J., Omori, T., Ouldelhkimm, M.C., Pant, K.,
Preston, R., Riach, C., San, R., Stankowski, L.F.E., Thakur, A., Wakuri, S., Yoshimura, I., 2003. Mouse lymphoma thymidine kinase gene mutation assay: International Workshop on Genotoxicity Tests Workgroup Report— Plymouth, UK 2002. Mutat. Res. 540, 127–140.
Mortelmans, K., Zeiger, E., 2000. The Ames Salmonella/microsome mutagenicity assay. Mutat. Res. 455, 29–60.
Moutaouakkil, A., Zeroual, Y., Dzayri, F.Z., Talbi, M., Lee, K., Blaghen, M., 2003. Purification and partial characterization of azoreductase from Enterobacter agglomerans. Arch. Biochem. Biophys. 413, 139–146.
Nam, S., Renganathan, V., 2000. Non-enzymatic reduction of azo dyes by NADH. Chemosphere 40, 351–357.
Oliveira, D.P., Carneiro, P.A., Sakagami, M.K., Zanoni, M.V.B., Umbuzeiro, G.A., 2007. Chemical characterization of a dye processing plant effluent—Identification of the mutagenic components. Mutat. Res. 626, 135–142.
Osugi, M.E., Rajeshwar, K., Ferraz, E.R.A., Oliveira, D.P., Araújo, A.R., Zanoni, M.V.B., 2009. Comparison of oxidation efficiency of disperse dyes by chemical and photoelectrocatalytic chlorination and removal of mutagenic activity. Electrochim. Acta 54, 2086–2093.
Pielesz, A., 1999. The process of the reduction of azo dyes used in dyeing textiles on the basis of infrared spectroscopy analysis. J. Mol. Struct. 511–512, 337–344. Pielesz, A., Baranowska, I., Rybak, A., Włochowicz, A., 2002. Detection and
determination of aromatic amines as products of reductive splitting from selected azo dyes. Ecotoxicol. Environ. Saf. 53, 42–47.
Pinheiro, H.M., Touraud, E., Thomas, O., 2004. Aromatic amines from azo dye reduction: status review with emphasis on direct UV spectrophotometric detection in textile industry wastewaters. Dyes Pigments 61, 121–139. Pinto, L.F.R., Felzenszwalb, I., 2003. Genética do câncer humano. In: Ribeiro, L.R.,
Salvadori, D.M.F., Marques, E.K. (Eds.), Mutagênese Ambiental. Editora da ULBRA, Canoas, pp. 29–48.
Prival, M.J., Mitchell, V.D., 1982. Analysis of a method for testing azo dyes for mutagenic activity in Salmonella typhimurium in the presence of flavin mononucleotide and hamster liver S9. Mutat. Res. 97, 103–116.
Rafii, F., Hall, J.D., Cerniglia, C.E., 1997. Mutagenicity of azo dyes used in foods, drugs and cosmetics before and after reduction byClostridiumspecies from the human intestinal tract. Food Chem. Toxicol. 35, 897–901.
Reid, T.M., Morton, K.C., Wang, C.Y., King, C.M., 1983. Conversion of Congo red and 2-azoxyfluorene to mutagens followingin vitroreduction by whole-cell rat cecal bacteria. Mutat. Res. 117, 105–112.
Rinde, E., Troll, W., 1975. Metabolic reduction of benzidine azo dyes to benzidine in the rhesus monkey. J. Natl. Cancer Inst. 55, 181–182.
Seesuriyachan, P., Takenaka, S., Kuntiya, A., Klayraung, S., Murakami, S., Aoki, K., 2007. Metabolism of azo dyes byLactobacillus caseiTISTR 1500 and effects of various factors on decolorization. Water Res. 41, 985–992.
Soriano, C., Creus, A., Marcos, R., 2007. Gene-mutation induction by arsenic compounds in the mouse lymphoma assay. Mutat. Res. 634, 40–50. Spadaro, J.T., Gold, M.H., Renganathan, V., 1992. Degradation of azo dyes by the
lignin degrading fungusPhanerochaete chrysosporium. Appl. Environ. Microbiol. 58, 2397–2401.
Umbuzeiro, G.A., Freeman, H., Warren, S.H., Kummrow, F., Claxton, L.D., 2005. Mutagenicity evaluation of the commercial product C.I. Disperse Blue 291 using different protocols of the Salmonella assay. Food Chem. Toxicol. 43, 49–56. Van Der Zee, F.P., Lettinga, G., Field, J.A., 2001. Azo dye decolourisation by anaerobic
granular sludge. Chemosphere 44, 1169–1176.
Watabe, T., Ozawa, N., Kobayashi, F., Kuruta, H., 1980. Reduction of sulphonated water-soluble azo dyes by micro-organisms from human faeces. Food Cosm. Toxicol. 18, 349–352.
Weisburger, J.H., 1997. A perspective on the history and significance of carcinogenic and mutagenic N-substituted aryl compounds in human health. Mutat. Res. 376, 261–266.
Zbaida, S., Stoddart, A.M., Levine, W.G., 1989. Studies on the mechanism of reduction of azo dye carcinogens by rat liver microsomal cytochrome P-450. Chem. Biol. Inter. 69, 61–71.