GETÚLIO VARGAS FOUNDATION OF SÃO PAULO SCHOOL OF PUBLIC ADMINISTRATION AND GOVERNMENT
PROGRAM OF POLITICS AND PUBLIC SECTOR ECONOMICS
ANA CAROLINA PEREIRA ZOGHBI
THREE ESSAYS ON EDUCATION FROM THE PERSPECTIVE OF THE ECONOMICS OF PUBLIC SECTOR
ANA CAROLINA PEREIRA ZOGHBI
THREE ESSAYS ON EDUCATION FROM THE PERSPECTIVE OF THE ECONOMICS OF PUBLIC SECTOR
Thesis presented to the Graduate Program of Politics and Public Sector Economics of the School of Public Administration and Government of Getúlio Vargas Foundation of São Paulo, in fulfillment of the degree requirements of Ph.D in Public Administration and Government.
Field of Knowledge:
Politics and Public Sector Economics
Advisor: Prof. Paulo Roberto Arvate
Zoghbi, Ana Carolina Pereira.
Three Essays on Education from the perspective of the Economics of Public Sector / Ana Carolina Pereira Zoghbi. - 2011.
97 f.
Orientador: Paulo Roberto Arvate
Tese (doutorado) - Escola de Administração de Empresas de São Paulo.
1. Educação -- Financiamento. 2. Educação e estado -- Brasil. 3. Educação -- Custos. 4. Avaliação educacional. I. Arvate, Paulo Roberto. II. Tese (doutorado) - Escola de Administração de Empresas de São Paulo. III. Título.
THREE ESSAYS ON EDUCATION FROM THE PERSPECTIVE OF THE ECONOMICS OF PUBLIC SECTOR
Thesis presented to the Graduate Program of Politics and Public Sector Economics of the School of Public Administration and Government of Getúlio Vargas Foundation of São Paulo, in fulfillment of the degree requirements of Ph.D in Public Administration and Government.
Field of Knowledge:
Politics and Public Sector Economics
Approval Date
__/__/____
Committee on Final Examination:
_____________________________________ Prof. Paulo Roberto Arvate (Advisor)
FGV-SP
_____________________________________ Profª. Fabiana Fontes Rocha
USP
_____________________________________ Prof . Ricardo da Silva Freguglia
UFJF
_____________________________________ Prof. Nelson Marconi
FGV-SP
_____________________________________ Profª. Verônica Inês Fernandez Orellano
ACKNOWLEDGMENTS
To Professor Paulo Roberto Arvate, my advisor, for guidance, attention and enormous scientific and intellectual contribution these past four years by always being willing to help me.
To Professors George Avelino, Ciro Biderman and Luiz Fernando Abrucio for the opportunity to work in CEPESP, to attend their courses and to receive academic counsel.
To Professors Fabiana Rocha, Verônica Orellano, and Enlinson Mattos for the opportunity to work together which has enriched my learning over the past four years.
To Getúlio Vargas Foundation from Sao Paulo, for the opportunity to work toward a PhD in Politics and Public Sector Economics and thank you to the secretaries of the Postgraduate department who always helped me with all the procedures.
To Coordination of Improvement of Higher Education (CAPES) for granting me a PhD scholarship, which greatly contributed to this work.
To Rafael Terra de Menezes, my husband, for his devotion in building a life with me. For the love, support, help, and understanding dedicated to me. For every tender, kind, and generous gesture. For the last seven very special years.
To my parents, João Roberto Zoghbi and Heliana Zoghbi, fondly, for all the love, support, encouragement and dedication, which not only contributed to this work, but was also essential throughout my life, conveying understanding in my darkest hours.
To my brothers Orlando Zoghbi and João Zoghbi, who always stood beside me and were willing to help.
To my mother-in-law, Marli Terra, who witnessed and assisted my academic endeavors.
To my dear friend Priscilla Albuquerque Tavares, for her encouragement, constant support, and long conversations sharing good and bad times.
To my colleagues of CEPESP, Gabriela Moriconi, Guilherme Lichand, Lara Simielli, Mauna Baldini, Sérgio Calderini, Simone Hirakawa and Vladmir Maciel, with whom I have enjoyed great happiness, and who have helped me grow through another stage of my life.
To Rafaella Cabral, Thiago Leitao and Lídia Ferraz from INEP, for the assistance with the microdata, and to INEP for providing the data.
ABSTRACT
This work consists of three essays organized into chapters that seek to answer questions at first sight unrelated, but with one common denominator, which is the scarcity of public resources devoted to education, overall, especially in lower education. .
The first chapter deals with the scarcity of resources devoted to education in a context of population aging. Two hypotheses were tested for Brazilian municipalities on the relationship between the aging of the population and educational expenditure. The first, already proven in the literature, is that there is an intergenerational conflict for resources and the increase of the share of elderly in the population reduces the educational expenditure. The second, proposed here for the first time, is that there should be reduction of competition for resources if there is a relationship of co-residence between young and old. The results indicated that an increase in the share of elderly reduces the educational expenditure per youth. But the results also illustrate that an increase in the share of elderly co-residing with youth (family arrangement more common in Latin American countries) raises the educational expenditure, which reflects a reduction of competition for resources between generations.
The second chapter assesses the allocative efficiency of investments in Higher Education. Using the difference between first-year and last-year students’ scores from Enade aggregated by HEI as a product in the Stochastic Production Function, is possible to contribute with a new element in the literature aimed at estimating the production function of education. The results show that characteristics of institutions are the variables that best explain the performance of students, and that public institutions are more inefficient than the private ones.
Finally, the third chapter presents evidence that the allocation of public resources in early childhood education is important for a better future school performance. In this chapter was calculated the effects of early childhood education on literacy scores of children attending the 2nd grade of elementary school. The results using OLS and propensity score matching show that students who started school at the ages to 5, 4, and 3 years had literacy scores between 12.22 and 19.54 points higher than the scores of those who began school at the ages 6 years or late. The results also suggest that the returns in terms of literacy scores diminish in relation to the number of years of early childhood education.
RESUMO
Este trabalho é composto por três ensaios organizados em capítulos que buscam responder questões a uma primeira vista independentes, mas com um denominador comum, que é a escassez de recursos públicos destinados à educação.
O primeiro ensaio trata da escassez de recursos voltados à educação em um contexto de envelhecimento populacional. Foram testadas duas hipóteses sobre a relação entre o envelhecimento populacional e os gastos em educação. A primeira, já presente comprovada na literatura, é a de que há uma disputa intergeracional por recursos e o aumento na proporção de idosos reduz os gastos em educação. A segunda, proposta aqui pela primeira vez, é a de que deve haver redução dessa disputa por recursos se houver uma relação de co-residência entre jovens e idosos. Os resultados indicaram que um aumento no percentual de idosos, de fato, reduz os gastos por jovem em educação. Mas também foram encontradas evidências de que conforme aumenta a proporção de jovens e idosos co-residindo (arranjo familiar mais comum em países lationo-americanos), aumentam os gastos em educação, o que reflete uma atenuação da disputa intergeracional por recursos.
O segundo capítulo avalia a eficiência alocativa dos investimentos realizados no Ensino Superior. Utilizando a diferença entre os escores de alunos ingressantes e concluintes do Enade agregados por IES como produto na Função de Produção Estocástica, foi possível contribuir com um elemento novo na literatura voltada à estimação de Função de Produção de Educação. Os resultados mostraram que as características das instituições são as variáveis que melhor explicam o desempenho. Adicionalmente, as instituições públicas são mais ineficientes que as privadas.
Por fim, o terceiro capítulo apresenta evidências de que a alocação de recursos públicos na Educação Infantil é importante para um melhor desempenho escolar futuro. Nesse capítulo foram calculados os efeitos da educação infantil sobre os escores de alfabetização das crianças do 2º ano do Ensino Fundamental. Os resultados encontrados com o uso de OLS e de Propensity Score Matching mostram que alunos que ingressaram com 5, 4, e 3 ou menos anos de idade, obtiveram escores de alfabetização entre 12,22 e 19,54 pontos a mais do que os que ingressaram na escola com 6 anos ou mais. Os resultados também sugerem que os retornos são decrescentes em relação ao tempo de Educação Infantil.
CONTENTS
LIST OF FIGURES ... 10
LIST OF TABLES ... 11
1 Introduction ... 12
2 Intergenerational conflict and public education expenditure when there is co-residence between the elderly and young (1st Essay) ... 15
2.1 The model ... 17
2.2 Instrumental variables ... 18
2.3 Budgeting process for municipalities, resources for the education area, data sources and key variables ... 21
2.4 Empirical estimates ... 26
2.5 Final Remarks ... 32
3 Production Efficiency in Education: Evidence from the Brazilian Universities (2nd Essay) 34 3.1 Measuring The Performance of Higher Education Institutions: Output Definitions . 37 3.2 Measuring the Performance of Higher Education Institutions (HEI): Defining the inputs 43 3.3 Result ... 45
3.4 Final Remarks ... 51
4 The Effects of Early Childhood Education on Literacy Scores Using Data from a New Brazilian Assessment Tool (3rd Essay) ... 53
4.1 Literature Review ... 57
4.2 Dataset ... 60
4.3 Estimation Strategy on the Presence of Self-Selections Bias ... 64
4.4 Results ... 70
4.5 Testing ... 75
4.6 Final Remarks ... 82
REFERENCES ... 84
APPENDIX ... 93
Appendix 1stEssay: ... 93
Appendix 1stEssay ... 94
Appendix 2ndEssay: ... 95
Appendix 2nd Essay ... 96
LIST OF FIGURES
Figure 4.1: Kernel density before matching - Group 1: Treated (Age 5 or less) vs (Control
Age 6 or more) ..………...79
Figure 4.2: Kernel density after matching - Group 1: Treated (Age 5 or less) vs (Control Age
6 or more) ………..79
Figure 4.3: Kernel density before matching - Group 2: Treated (Age 3 or less) vs (Control
Age 6) ………79
Figure 4.4: Kernel density after matching - Group 2: Treated (Age 3 or less) vs (Control Age
6) ………79
Figure 4.5: Kernel density before matching - Group 3: Treated (Age 4) vs (Control Age
6)……….79
Figure 4.6: Kernel density after matching - Group 3: Treated (Age 4) vs (Control Age
6)……….79
Figure 4.7: Kernel density before matching - Group 4: Treated (Age 6) vs (Control Age
5)……….79
Figure 4.8: Kernel density after matching - Group 4: Treated (Age 6) vs (Control Age 5)
……….79
Figure 4.9: Kernel density before matching - Group 5: Treated (Age 5) vs (Control Age 3 or
less) ………...…..80
Figure 4.10: Kernel density after matching - Group 5: Treated (Age 5) vs (Control Age 3 or
less)………..80
Figure 4.11: Kernel density before matching - Group 6: Treated (Age 5) vs (Control Age
4)………..80
Figure 4.12: Kernel density after matching - Group 6: Treated (Age 5) vs (Control Age
4)………..80
Figure 4.13: Kernel density before matching - Group 7: Treated (Age 4) vs (Control Age 3
or less) ………....80
Figure 4.14: Kernel density after matching - Group 7: Treated (Age 4) vs (Control Age 3 or
less)………..80
Figure 4.15: Kernel density before matching - Group 8: Treated (Age 5 -another municipality) vs (Control Age 6 or more in the municipality)………...80 Figure 4.16: Kernel density after matching - Group 8: Treated (Age 5 -another municipality)
vs (Control Age 6 or more in the municipality)………..80
Figure 4.17: Kernel density after matching - Group 9: Treated (Age 5 -private school) vs
(Control Age 5-public school)……….81
Figure 4.17: Kernel density before matching - Group 9: Treated (Age 5 -private school) vs
LIST OF TABLES
Table 2.1: Percentage of young and elderly in relation to the total population in the United
States and Brazil ... 16
Table 2. 2: Local Education Expenditure on Tax Revenue + Total Transfers ... 23
Table 2. 3 – Averages and standard errors from aggregate variables by municipality ... 25
Table 2. 4: First-Stage Regression (IV) ... 28
Table 2.5: Per young expenditure estimations considering as instrument (IV) two variables: population aged between 55 and 64 years in previous census and the difference between daughters and sons ... 30
Table 3. 1– Average score in Enade 2007 for Freshman students and for Graduating student of Public and Private Education 41 Table 3.2 – Inputs based on declared information by students and separated by public and private institutions 44 Table 3.3 – Stochastic Frontier esteem with the score difference of graduating and freshmen students (inputs: characteristics of the HEI) 49 Table 3.4 – Stochastic Frontier esteem with the score difference of graduating and freshmen students (inputs: characteristics of the IES) 50 Table 4. 1 – Literacy Scores and characteristics of the 2nd grade students of Sertãozinho-São Paulo ... 63
Table 4. 2 – Description of the different groups of treated and untreated units used for the Propensity Score Matching procedure ... 70
Table 4. 3 – OLS estimates of the effects of Early Childhood Education on Provinha Brasil literacy scores conditioning on covariates ... 72
Table 4.4 – Estimates of the Average Treatment Effect on the treated for different groups of treated and control units ... 74
Table 4.5 – Tests of difference between the covariates of treated and control groups after Matching ... 77
Appendix 1stEssay:: Table A. 1– Results Dependent Variable: Per young education expenditure ... 93
Appendix1stEssay: Table A. 1– Results Dependent Variable: Per pupil education expenditure ... 94
Appendix Appendix 2ndEssay: Table A. 2 – Ouput and Input measures used in studies of efficiency in higher education ... 95
Appendix Appendix 2ndEssay: Table A. 3 – Ouput and Input measures used in studies of efficiency in higher education ... 96
1 Introduction
Admittedly the provision of quality education depends, in large part, on the family background of students, and little can be done to reverse a consolidated situation in which the family background is disadvantaged. Moreover, most of these families do not have the resources to invest in the education of their children, and there is not an appropriate credit system which facilitates this investment. According to Stiglitz (1999), this characteristic of the capital market represents a failure or an imperfection of the market, and by itself, would justify public intervention through investments in public education.
However, the situation of education in Brazil cannot be resolved simply by increasing spending. Resources are scarce, i.e., there is an overall budget constraint, and various interest groups compete for these resources. Therefore, it is interesting to try to better understand the competition for public resources and how to take maximum advantage of available resources to education. In other words, maximize educational outcomes for a given level of expenditure, identifying where the spending is more productive and if the private sector is actually more efficient than the public sector to provide education. Given this background, this paper seeks to examine three issues related to the scarcity of public resources for education in the form of three essays.
The first essay deals with the allocation of resources in education in the context of population aging, where there is a greater demand for resources targeted to the elderly and there is not a decrease in demand for resources for education.1 Consequently, the relevant question, facing these demographic changes and government constraint, is to which group should public resources be directed. This question reflects an intergenerational conflict. To this end, two hypotheses were tested for Brazilian municipalities on the relationship between the aging of the population and educational expenditure. The first hypothesis is that the increase of the share of elderly in the population reduces the educational expenditure, according to consensus of the recent empirical literature. The second hypothesis is that there should be reduction of competition for resources if there is a relationship of cohabitation
residence) between young and old, which is a common arrangement in Latin American countries. Thus, a greater share of elderly and youth living together should increase the expenditure in education. This last hypothesis is a new element that this essay tries to introduce to current literature. To test the hypothesis of this essay, a panel of data from Population Census (Brazilian Institute of Geography and Statistics) and from Finbra (National Treasury Office) was used to the years 1991 and 2000. The possibility of endogeneity was considered due to the Tiebout mechanism for individual’s location.2 To correct this problem the Fixed Effects method was used with instrumental variables. The econometric results indicated that an increase in the share of elderly in the population reduces the educational expenditure per youth, which supports the results of the main studies of the current literature. In addition, the results in this essay illustrate the reduction of intergenerational conflict in Brazil due family arrangement, i.e., an increase in the share of elderly co-residing with youth in the population raises the educational expenditure. Therefore, the results confirm the hypotheses of this essay and also emphasize the importance of family arrangements with elderly in determining the educational expenditure.
The second essay highlights the disparity of investments in different levels of education, especially in favor of higher education. Accordingly, high levels of investment realized at this level of education, compared to other levels, creates concerns regarding the allocative efficiency. 3An improvement in allocative efficiency would free resources to be used more productively by all levels of education. Thus, the second essay assesses the effectiveness of investments in higher education, comparing the results of performance on the National Student Achievement Assessment Test (ENADE) obtained from public and private universities. In this case, a Stochastic Production Function of Education for the Brazilian Higher Education Institutions (HEIs) is estimated based on information from the 2006 Census (Higher Education Census) and the 2007 ENADE. Using the difference between first-year and last-year students’ scores from Enade aggregated by HEI as a product in the Stochastic
2 The citizens choose to reside in a municipality based on the supply of public goods (Tiebout effect, 1956).
3
According to a study conducted by the National Institute of Educational Studies AnísioTeixeira (INEP / MEC),
Institute of Applied Economic Research (IPEA) and National Fund for Educational Development (ENDF), the ideal amount of spending per student in higher education should be three times the amount spent per pupil in basic education based on similar proportions and ratios observed in developed countries. The study showed that in 2002 Brazil spend 11 times more per student in higher education than basic education. In 2006, this proportion dropped to 6.7 due to increased investments made in basic education and increased enrollment in higher education.
Production Function, is possible to contribute with a new element in the literature aimed at estimating the production function of education. The results show that characteristics of institutions are the variables that best explain the performance of students, and that public institutions are more inefficient than the private ones.
2 Intergenerational conflict and public education expenditure when there is co-residence between the elderly and young (1st Essay)
Although Brazil’s population pyramid shows that its citizens are predominantly young, the number of elderly has been growing as a result of higher life expectancy and a lower birth rate.4 5 6 This distribution places Brazil in a peculiar situation regarding the intergenerational issue and has consequences for the budgets of subnational governments, given that the population still has too few years of schooling (median of four years; 2000 census data) and the elderly require more healthcare resources.7
As a consequence, an aging population can put pressure on the need for more public expenditure on health and it can change public budget allocations as well, leading to an intergenerational electoral competition for funds.8 If this competition exists in Brazil, it is still quite mild compared to that found in the United States, considering the differences in the population pyramids of these two nations, as shown in the table below:
The share of young people in the Brazilian population in the year 2000 (last census) is about seven times that of the elderly, while in the United States this ratio was about two and a half. However, population forecasts suggest narrowing of the age distributions in these two countries. In 2050, both nations should have one elderly for every young. Thus, if an aging population has a negative effect on education expenditure (Poterba,1997; Ladd & Murray, 2001), Brazil’s situation in the future may be much more worrisome than that of the United States.
4According to the United Nations population forecasts (2005), Brazil ranks among the 10 countries with the largest elderly population in the world.
5Berquó & Cavenaghi (2004) discussed the role of women’s insertion in the Brazilian job market and the effect of the increase in years of schooling on birth rate reduction.
6 The declining Brazilian birth rate should be observed more carefully, because it is not uniform for all income groups and consequently it does not reduce the availability of resources intended for the education of youth as one would expect (the birth rate is still high among the poor, as shown by Rios-Neto, 2005 and Berquó & Cavenagui, 2004).
7 Generally, the elderly have more health problems and lower income than they used to at other moments of their lives (Buttons, 1992).
Table 2.1: Percentage of young and elderly in relation to the total population in the United States and Brazil
Aging
Under 18 Over 65
Year USA Brazil USA Brazil
2000 28.5 40.2 12.4 5.4
2030a 26.2 28.6 19.6 12.1
2050a 26 24.1 20.7 18.8
Source: Census Bureau and IBGE. Note: a: projected
Although the existing literature has come to differing conclusions about intergenerational disputes regarding public education expenditure (Bergstrom, Rubinfeld & Shapiro, 1982; Richman & Stagner, 1986; Ladd & Murray, 1999; Harris, Evans & Schwab, 2000; and Brunner & Balsdon, 2004), we cannot ignore that the intergenerational conflict in the United States is at least exacerbated by a family arrangement in which the elderly live apart from their young. 9
Considering this possibility, the main objective of this study is to verify how the elderly population affects public education expenditures in different family arrangements. The current study was conducted with 2,054 Brazilian municipalities because the co-residence of the elderly with the young in Brazil (Camarano & Ghaouri, 2002) is higher than in the United States.
However, an investigation into this issue is not easy considering that there is the possibility of endogeneity bias between education expenditure and the elderly’s choice of their municipality of residence based on the supply of public goods (Tiebout effect, 1956). To correct this bias, it is necessary to estimate two-stage least squares (2SLS) models using instrumental variables (IV) in order to obtain consistent estimations (see Ladd & Murray, 1999 and Borge & Rattso, 2007). Following this recommendation, we employ three different variables as instruments for the elderly: the share of people aged 55 to 64 in the previous census (10 years before), the share of women aged 55 to 64 in the previous census (10 years before), and the share of women aged over 65 who had more daughters than sons. The first
instrumental variable was used by Ladd & Murray (1999), while the other ones are introduced in this study.
Our results show that an increase in the share of elderly reduces local public education expenditure, confirming the results found in previous studies (see Button, 1992; Poterba, 1997; Ladd & Murray, 1999; Brunner & Balsdon, 2004 and Borge & Rattso, 2007). Depending on the instrument used to correct the Tiebout effect, the increase of one point in the percentage of elderly in the total population reduces the per young education expenditure between -0.267 and -0.193 points. 10 However, we find evidence that the increase in the share of elderly living with the young also augments local public education expenditures. Depending on the instruments used to correct the Tiebout effect, the increase of one point in the percentage of elderly in the total population living with young people under 18 increases the per young education expenditure between 0.767 and 0.516 points.11 This second result shows the importance of family arrangements for the definition of public expenditure. Moreover, this contribution was not considered by the existing literature.
This essay is organized into four subsections, in addition to this introduction. Subsection 1 introduces the model used for the estimation and discusses the instrumental variables employed to correct the bias produced by the Tiebout effect. Subsection 2 shows the budgeting process for municipalities, resources for the education area, data sources, and key variables used in the estimations, while subsection 3 presents the empirical estimates. Finally, subsection 5 includes a summary of the main results.
2.1 The model
The specification used in the empirical part of this study follows the work of Poterba (1997), Ladd & Murray (1999), and Harris, Evans & Schwab (2000), who investigated the impact of the aging population on public education expenditure in the United States. We included only the possibility of individuals aged over 65 who co-reside with young
10 We considered the coefficients of the elderly variable in Table 2.5 (columns 5 and 7). These numbers in terms of elasticity are between -0.012 and -0.017.
(under 18) in the specification to verify whether intergenerational conflict is attenuated by a different family arrangement. The main equation is:
, ( 2.1)
where is the logarithm of per young education expenditure (under 18) in municipality i in year t; is the share of people aged over 65 in municipality i in year t;
is the share of people aged over 65 co-residing with young under 18 in
municipality i in year t; is a line vector of covariates of municipality i in year t; is a column vector of parameters; is the fixed effect of municipalities; is a time dummy to control for the census years (1991 and 2000); and is the random term with zero mean and a normal distribution.
Considering that Ladd & Murray (1999) and Borge & Rattso (2007) have shown the possibility of people over 65 choosing their place of residence according to the local supply of public goods (Tiebout effect, 1956), we use instrumental variables that enable us to estimate consistent coefficients for equation (2.1), i.e., those neither correlated with uit nor with errors of the first-stage equations.
2.2 Instrumental variables
If we really had a bias caused by the Tiebout effect (groups of different ages choose their municipality of residence according to the bundle of public goods supplied by the local government), we would have three endogenous variables to correct this effect: the elderly, the elderly co-residing with young and the young (over 18).
assumption is very strong for all workers in Brazil. However, this assumption is suitable for the elderly population, which, in general, lives on retirement income.
In our understanding, the elderly people choose to live in municipalities where public spending meets their preferences. Moreover, the mobility of the young is linked to their parents’ employment opportunities.12 This implies that only the variables (
) and ( ) are endogenous in model (2.1).
To avoid the bias of the variables associated with the elderly, we employ three different instrumental variables: the share of people aged 55 to 64 in the previous census (10 years before), the share of women aged 55 to 64 in the previous census (10 years before), and the share of women aged over 65 who had more daughters than sons.
Ladd & Murray (1999) used the share of people aged 55 to 64 from the previous census (10 years before), arguing that this variable is a suitable instrument because it is correlated with the current share of elderly (in t), but their preferences for public spending refer back to the previous census (t-10). Camarano & Pasinato (2007) pointed out that Brazilian women predominate in the elderly population because they have a higher life expectancy than men. The use of this variable as an instrument of the variables associated with the elderly can help us in the current study because if women live longer than men, they have more chances to co-reside with young. Living longer, they will probably require special care. In this case, we also have a higher probability of these women co-residing with their grandchildren. Thus, the choice of “share of women aged 55 to 64 in the previous census (10 years before)” can represent an interesting instrument. This variable can be used as an instrument both for the share of people aged over 65 as well as for the share of people aged over 65 who co-reside with those under 18. Since this variable is highly correlated with the variable used by Ladd and Murray (1999) - the share of people aged 55 to 64 in the previous census (10 years before) - we should not use these two variables together in the same first-stage equation to avoid collinearity problems. Bongaarts & Zimmer (2002) have shown that it is usual to see more daughters than sons living with elderly parents in Latin American countries. This observation produces our third instrument: the share of women aged over 65 who have more daughters than sons.13 In this case, the choice of having children took place in the past. Therefore, the choice is not affected by the bundle of public goods offered during
12 It is reasonable to assume that these parents are economically active and integrate the workforce. Thus, their mobility between municipalities is linked to employment opportunities rather than to higher local expenditure on education.
period t. Moreover, the gender of their children and the ratio of daughters and sons are totally random.
Considering that we have two endogenous variables, we need two instrumental variables, and as the two possible variables (“share of people aged 55 to 64 in the previous census” and “share of women aged 55 to 64 in the previous census”) are highly correlated, we decided to use two types of instruments:
( 2.2)
and
(2.3)
where is the share of people aged over 65 in municipality i in year t;
is the share of people aged over 65 who co-reside with young under 18 in
municipality i in year t; can be the share of people aged 55 to 64 or the share of women aged 55 to 64 in municipality i in the previous census (10 years before) t-10;
represents a line vector of covariates of each municipality i in year t; is the column
2.3 Budgeting process for municipalities, resources for the education area, data sources and key variables
The 1988 New Brazilian Constitution established that municipalities are an independent level of government like states and the federal government. Thus, each municipality has local executive and legislative members elected simultaneously for a four-year term. The local executive is elected based on the majority rule and each member of the legislative is elected by an open-list proportional system (voters can choose their candidates freely). Municipalities with over 200,000 inhabitants elect their executive members in two rounds if a candidate does not receive the majority of the votes in the first round (50% plus one). Legislative members represent the most important interest groups from a municipality (teachers, farmers, owners of private transportation companies, and groups with interest in different areas - public order and health – such as the elderly population, etc) which dispute budget resources. The municipalities have the transfers from state and federal government as their main source of revenue. They are regular (constitutional transfers) and their distribution is defined by law.14 Basically, the tax revenue is a small share of the total revenue budget representing 6.80% in 1991 and 5.17% in 2000 of total transfers received by the average of municipalities.
In this situation, the local budget (including the education budget) is formulated annually by the executive and submitted to the legislative for approval in year before its execution. In the case of education budget, it must respect a specific federal legislation. The main rule determined by the 1988 Constitution (article 212) imposes that each municipality must spend a minimum of 25% of their revenues on education (tax revenue and transfers from federal and state governments). Besides, these resources are targeted at specific policies: half of this amount must be used to eliminate adult illiteracy and the other half must be used to ensure access to education for the young (“universal policy”).
After 8 years (1996), the evaluation of federal government was that the allocated resources did not achieve the targets of universal policy because the realized expenditure did not help improve young people’s access to education (the legislation allows for different
interpretations of what type of expenditure should be used).15 Thus, although the federal government has maintained the limits of minimum revenue established by the 1988 Constitution, it imposes a set of legal changes to assure that new and existing resources from state and federal governments for educational purposes will be used effectively in the area.16 As a result of these changes, the Fund for the Maintenance and Development of Elementary Education and Valuation of Teaching - FUNDEF (law 9424)17 was created, and it was determined that 2/3 of the resources from the National Fund for the Development of Education – FNDE (referred to as education salary) must be distributed directly to municipalities (obeying the same law which created the FUNDEF).1819
So, considering the legal aspects of the education area, the final budgetary education expenditure is defined by the relationship between the executive and legislative branches. Table 2.2 shows the share of local education expenditure according to the established legislation.
15 Training of education administrative workers and payment of retired teachers are some cases mentioned as expenditure used for fulfill universalization. See Mendes (2004).
16 During political negotiation in the Brazilian Congress, it was clear that after eight years a share of the resources sent to comply with the universal policy was committed to expenditures that would not achieve this goal. Thus, the federal government established a new set of rules to guarantee that additional resources and the share of resources already committed to the policy would not be deviated from their purpose. Basically, the set of actions of universal policy was directed towards elementary education.
17 FUNDEF was created with 15% of resources from federal and state governments (specifically, resources from ICMS, IPI, FPE, and FPM – consumption taxes and funds). As a share of ICMS, FPM, and a share of IPI (resources from IPI are sending for FPM) was already transferred to municipalities, all municipalities had an
accounting reduction of these resources because they started to receive the same resources under FUNDEF’s
name. As the distribution of FUNDEF resources depends on the number of enrollments in each municipality, the final resources received by each municipality (considering the resources from FUNDEF) could be higher, lower than or the same as before. The law established also that if the revenue of FUNDEF divided by the number of enrollments in the state (local and state enrollments) did not achieve a minimum value, the federal government would have to complement this value with its own budget resources until this minimum could be reached. FUNDEF resources represented 34.5% of education expenditure in 2000 for the average of municipalities. Moreover, the resources from FUNDEF were directed towards elementary education and it was established that
60% of the resources received through this fund must be spent on teachers’ wages while the remaining share must be spent in the education area.
18 The education salary consists of resources from FNDE. The resources from FNDE are collected from the total payroll paid by firms (2.5%). Initially, the distribution of FNDE resources depended on individual projects
approved by the government’s education area. After the legislation changed (1996), 2/3 of the resources were sent directly to municipalities for expenditures with school transportation, food, and teaching material. The remaining 1/3 was maintained by FNDE and could be requested through individual projects. The education salary represented 3.08% of education expenditure in 2000 for the average of municipalities.
Table 2. 2: Local Education Expenditure on Tax Revenue + Total Transfers
Years Observations Percentage
1991 2882 0.36
2000 3721 0.36
Source: FINBRA (IPEADATA)
The first column shows the years used in our sample (1991 and 2000). The second column presents the number of observations used.20 The third column shows the average education expenditure on tax revenue plus total transfers received by municipalities. It is possible to ascertain that the average of municipalities spend more than the minimum established by the Constitution (25%): 36% for both years. The difference between the values established by law and the real ones makes it clear that the education area disputes local resources with other areas (transfers received and not related directly by law to education expenditure and tax revenue). Furthermore, it is important to observe that there are situations in which not even the minimum level of expenditure is obeyed: 11% of the municipalities in 1991 (325) are below the minimum level established by law. In 2000, this number fell to 7% (261 municipalities). 21
With specific regard to the primary databases, we used the demographic census conducted by the Brazilian Institute of Geography and Statistics (IBGE). In addition to the years of 1991 and 2000, we also employed data from the 1980 census to build the instrumental variables. Information relative to local public education expenditures for 1991 and 2000 was provided by the Brazil Finances (FINBRA), a database of the Brazilian National Treasury Department (STN).22 Fiscal variables were deflated using the IGP-DI index.23 However, it is necessary to describe the limitations imposed by the available data on longitudinal studies. It is especially important to point out that, from 1970 to 2000, the number of Brazilian municipalities grew considerably (1,556 new municipalities). Thus, to prevent an inconsistent intertemporal analysis, we use aggregated information according to
20 The number of observations used here is higher than that used in the econometric exercise. Our exercise has 2,054 observations in 1991 and 3,656 in 2000.
21 The city of São Paulo in 1996 did not use the minimum resources established by law. The judicial power accepted that this difference will be incorporated in the subsequent years. It is likely that other municipalities will follow in the same path (see municipal law 12.340/1997 in São Paulo).
22 In the FINBRA database, public education expenditures for 1991 and 2000 are aggregated with cultural expenditures. However, looking at the same database after 2002, we see that cultural expenditures represent a small share of this total and should not greatly influence our analysis.
minimum comparable areas (MCA).24 In addition, we considered only MCAs about which all municipalities had information, for a total of 2,054 MCAs in a universe of 3,659 MCAs existing from 1970 to 2000 (56.13 percent of the total). Whenever we refer to municipalities in this study, we are in fact referring to MCAs, which is the same thing in most cases, because municipalities that did not secede between 1970 and 2000 represent a single MCA.
The public education expenditure measure used in our estimations is per young expenditure considering individuals up to 18 years old. This age bracket is suitable for our study for two reasons. First, no data are available for different education levels. The second reason is less evident, though. Since education outlays in Brazilian municipalities focus on elementary schools, we should consider a fitting age bracket: 0 to 14 years. However, what we see in Brazil, especially during the period in question, is a considerably high rate of grade repetition.25 Thus, by considering the young aged up to 18, we minimize the overestimation of expenditures in municipalities where the share of grade repeaters is higher.
Looking at the descriptive statistics in Table 2.3, we observe that per young expenditure increased more than 400 percent between 1991 and 2000.
As the share of young aged under 18 in relation to the total population decreased by nearly six percentage points, this result is conditioned by institutional changes that occurred in 1996, as described previously (especially regarding transfers: FUNDEF and education salary). Per pupil expenditure is also very important in our study.26 Table 2.3 shows that this figure rose by 63.2 percent during the period in question. This increase is modest compared to per young expenditure, but it captures the actual change. The change in per pupil expenditure captures the changes in transfers received by municipalities and the overall increase in enrollment in local schools. However, per pupil expenditure should be viewed with caution in an econometric test in which this figure appears as a dependent variable. Poterba (1997) has pointed out that per pupil public expenditure could affect decisions on whether a student should attend public or private schools, and an econometric model that uses
24 Minimum comparable areas (MCA) consist of geographical areas built by the Brazilian Institute of Geography and Statistics (IBGE) that are not subject to the division and aggregation of municipalities. The municipality definition of MCA is the same and is constant over time.
25 The mean expected age for concluding elementary school (eight initial years of official study) was 16 years in 2000, while the ideal age would be 14. In several northern and northeastern Brazilian states, the mean age is even higher. Consequently, the use of the 0-18 age bracket seems quite reasonable in the case of Brazil.
this as a dependent variable could have endogeneity.27 Therefore, our estimations are based on a model whose dependent variable is per young expenditure, which does not lead to this problem.
Table 2. 3 – Averages and standard errors from aggregate variables by municipality
Variables/Year 1991 2000
Per young local education expenditure
(under 18) (2000 R$) (72.24) 89.64 (733.72) 460.87
Per pupil local education expenditure
(2000 R$) (6995.66) 1440.4 (6609.67) 2350.49
Elderly over 65 (share of population) (1.50) 5.7 (1.74) 6.99
Elderly over 65 who co-reside with
young under 18 (share of population) (0.82) 2.27 (0.85) 2.4
Young under 18 (share of population) (6.04) 45.58 (5.70) 39.93
Per capita income (2000 R$) (60.92) 91.02 (101.40) 164.36
Non-white (share of population) (26.26) 53.67 (22.66) 50.30
Urban population (share of population) (22.71) 57.13 (22.27) 62.83 Individual who migrated less than 5
years ago (share of population) (6.94) 11.99 (5.48) 11.6
Elderly who migrated less than 5 years
ago (share of population) (0.31) 0.36 (0.33) 0.45
Young black (share of black
population) - Elderly black (share of black population)
0.042
(0.074) (0.071) 0.044
Demographic density (number of
inhabitants per square kilometer) (702.27) 139.10 (811.28) 164.90
Population (number of inhabitants) (266108) 3941 (290823) 4496
Elderly women over 65 (share of
population) (0.85) 2.94 (0.99) 3.66
Population between 55 and 64 years in previous census (share of population)
4.95 (1.04)
5.67 (1.31) Population of women between 55 and
64 years in previous census (share of population)
2.40 (0.58)
2.91 (0.72) Elderly women with more daughters
than sons (share of population)
0.380 (0.103)
0.440 (0.114)
Source: The 1991 and 2000 Population Census (IBGE), and the 1991 and 2000 FINBRA (National Treasury). Standard errors are in parentheses.
It is somewhat difficult to build a variable which represents the proximity between the young and the elderly (Poterba, 1998). Brunner & Balsdon (2004) used the standard variables employed in population aging and education spending studies, and also employed a “voter having children in a public school” variable. Another way to build a proximity variable between the young and the elderly would be co-residence between these two groups. This variable is normally employed in studies that analyze new trends in family arrangements. According to De Vos & Holden (1988), when individuals co-reside they have a higher chance of sharing their incomes. However, this co-residence variable does have its limitations. It would probably not yield significant results in the United States because the share of elderly living with their children is quite small in comparison to Latin American and Asian countries (De Vos, op. cit). On the other hand, it is common to find family arrangements in which the elderly and the young co-reside in Brazil (Camarano & Ghaouri, 2002).28
We employ the following control variables that are expressed as a share of the total population: “young aged less than 18”, “non-white”, “individuals living in urban areas”, “individuals who migrated less than five years ago”, and “elderly who migrated less than five years ago”. Another variable employed is the “difference in the young black to elderly black ratio”, which shows the difference in the ratio of each group to the total number of individuals in a given age bracket and tries to capture any reductions in the intergenerational competition according to race. The other variables (in logarithm) considered are “per capita income”, “population”, and “demographic density.”29
2.4 Empirical estimates
As discussed above, Equation (2.1) cannot be estimated directly without dealing with the endogeneity observed in the key variables of our investigation. According to the specifications of Equations (2.2) and (2.3), we estimated the first stage using pooled ordinary
28 These social, economic, and demographic differences between countries are of crucial importance in developing applied research to a specific nation. Therefore, we must consider the possibility that something valid in one country might not be valid in another with distinct characteristics.
29 Considering that the most important fund transfers (FPM) to the municipalities were set in Brazil’s 1988
Constitution (a rule based on the municipality’s population and the inverse of its per capita income), including
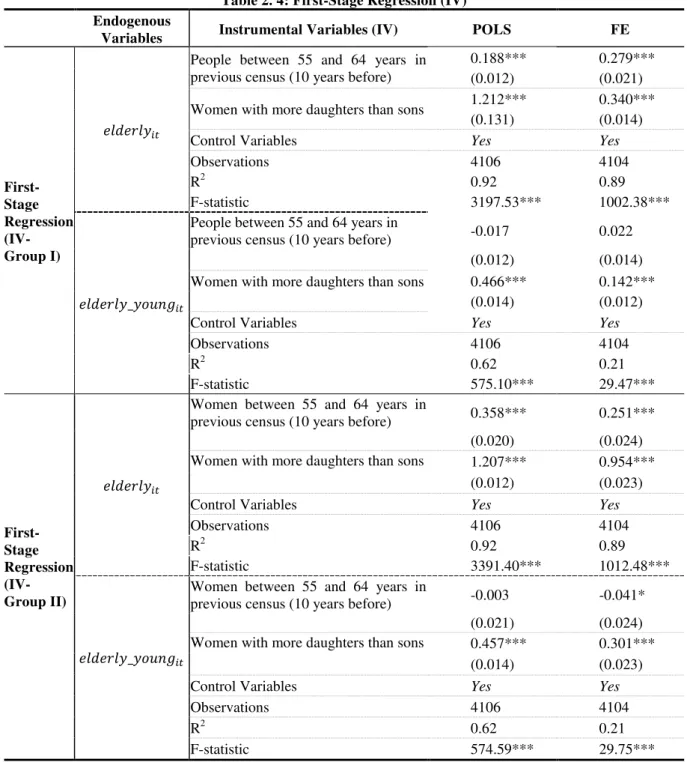
least squares (POLS) and fixed effects (FE) to verify the robustness of the results. Table 2.4 shows the results of the first stage considering two groups of instruments, since we cannot use the instruments together.
I. The share of people aged 55 to 64 in the previous census (10 years before) and the share of women aged over 65 who have more daughters than sons.
II. The share of women aged 55 to 64 in the previous census (10 years before) and the share of women aged over 65 who have more daughters than sons (same instrument used in Group I).
The results for Group I presented in Table 2.4 show that the “share of individuals aged 55 to 64 in the previous census (10 years before)” explains the “share of individuals aged over 65”. The signs were also as expected. The “share of women aged over 65 who have more daughters than sons” also showed significant and positive coefficients in the estimations using POLS and FE.30
In this same group, the results show that the “share of individuals aged 55 to 64 in the previous census (10 years before)” does not present any significance at any level in explaining the “share of individuals aged over 65 who co-reside with young under 18”. Only the “share of women aged over 65 who have more daughters than sons” is significant in explaining this variable, with a result quite similar to that of Bongaarts & Zimmer (2002): the greater the share of women aged over 65 who have more daughters than sons, the greater the share of individuals aged over 65 who co-reside with young under 18.
The results for Group II are similar, with the exception of the (negative) result for the “share of women aged 55 to 64 in the previous census (10 years before)”. If this share increases, we can expect a decrease in the percentage of elderly who co-reside with young.
Table 2. 4: First-Stage Regression (IV) Endogenous
Variables Instrumental Variables (IV) POLS FE
First-Stage Regression (IV- Group I)
People between 55 and 64 years in previous census (10 years before)
0.188*** 0.279***
(0.012) (0.021)
Women with more daughters than sons 1.212*** 0.340***
(0.131) (0.014)
Control Variables Yes Yes
Observations 4106 4104
R2 0.92 0.89
F-statistic 3197.53*** 1002.38***
People between 55 and 64 years in
previous census (10 years before) -0.017 0.022
(0.012) (0.014)
Women with more daughters than sons 0.466*** 0.142***
(0.014) (0.012)
Control Variables Yes Yes
Observations 4106 4104
R2 0.62 0.21
F-statistic 575.10*** 29.47***
First-Stage Regression (IV- Group II)
Women between 55 and 64 years in
previous census (10 years before) 0.358*** 0.251***
(0.020) (0.024)
Women with more daughters than sons 1.207*** 0.954***
(0.012) (0.023)
Control Variables Yes Yes
Observations 4106 4104
R2 0.92 0.89
F-statistic 3391.40*** 1012.48***
Women between 55 and 64 years in
previous census (10 years before) -0.003 -0.041*
(0.021) (0.024)
Women with more daughters than sons 0.457*** 0.301***
(0.014) (0.023)
Control Variables Yes Yes
Observations 4106 4104
R2 0.62 0.21
F-statistic 574.59*** 29.75***
Note: Robust standard deviations in parentheses. * Significance at 10%; ** Significance at 5%; *** Significance at 1%.
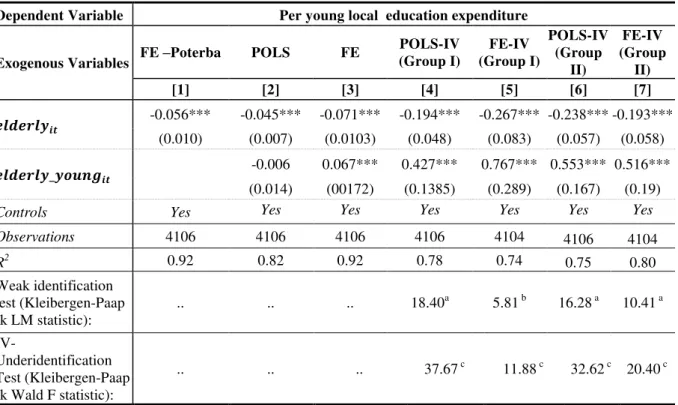
Table 2.5 shows the results of the second stage, seeking to answer whether there are elements that support the notion that a different family arrangement (co-residence of the elderly with the young) determines different public spending on education.
presented (FE - Poterba column) the same specification employed by Poterba (1997), using more disaggregated data.31 Our results were similar to those found by that author. The coefficient equal to -0.056 32 shows that an increase in the share of individuals aged over 65 (elderly) reduces public education expenditure. This result confirms the result shown in the literature: an aging population reduces per young public spending.
The results of the specifications in Table 2.5 help confirm the results of family arrangement by co-residence. As we can see, the estimation using POLS (second column), not using instruments, also has a negative coefficient (equal to –0.045), significant at the 1 percent level for the variable. This result shows that an increase in the share of
elderly reduces per young public spending. However, these estimations are inconsistent because they fail to consider the endogeneity resulting from the fixed effect correlated with the covariates and the possibility of the Tiebout bias. On the other hand, the
variable has a non-significant coefficient.
The estimation with fixed effects without the use of instruments (third column) presented significant coefficients at the 1 percent level, with greater magnitude and the expected signs. The fixed effect estimator is consistent, even when endogeneity is not considered and the covariates are not correlated. Therefore, when correcting endogeneity, which we can understand as being caused by omitted variables, we obtained more significant coefficients. The coefficients equal to –0.071 and 0.067, respectively, for the and
variables also support the notion that an increase in the ratio of elderly
reduces expenditures with the young, but an increase in the frequency of co-residence between the elderly and the young leads to higher expenditures.
Instrumentalizing the endogenous variables with the “share of people aged 55 to 64 in the previous census (10 years before)” ( ) and the “share of women aged over 65 who have more daughters than sons” ( ), we hope to
correct the Tiebout bias. The POLS-IV estimations shown in the fourth column of Table 2.5 do not consider the unobserved heterogeneity, but present a significant leap in magnitude. The coefficient of the variable, equal to -0.194, shows that the negative impact of the ratio of elderly on per young public education expenditure is even more intense. Similarly, the
coefficient, equal to 0.427, also suggests a greater effect. Additionally, the
tests for underidentification of instruments and weak identification validate our instruments at the strictest level.
Table 2.5: Per young expenditure estimations considering as instrument (IV) two variables: population aged between 55 and 64 years in previous census and the difference between daughters and sons
Dependent Variable Per young local education expenditure
Exogenous Variables FE –Poterba POLS FE
POLS-IV (Group I)
FE-IV (Group I)
POLS-IV (Group
II)
FE-IV (Group
II)
[1] [2] [3] [4] [5] [6] [7]
-0.056*** -0.045*** -0.071*** -0.194*** -0.267*** -0.238*** -0.193*** (0.010) (0.007) (0.0103) (0.048) (0.083) (0.057) (0.058)
-0.006 0.067*** 0.427*** 0.767*** 0.553*** 0.516*** (0.014) (00172) (0.1385) (0.289) (0.167) (0.19)
Controls Yes Yes Yes Yes Yes Yes Yes
Observations 4106 4106 4106 4106 4104 4106 4104
R2 0.92 0.82 0.92 0.78 0.74 0.75 0.80
Weak identification test (Kleibergen-Paap rk LM statistic):
.. .. .. 18.40a 5.81 b 16.28 a 10.41 a
IV-
Underidentification Test (Kleibergen-Paap rk Wald F statistic):
.. .. .. 37.67 c 11.88 c 32.62 c 20.40 c
a- Instruments are not weak at a more rigorous level (10%maximal IV size). b- Instruments are not weak at a less rigorous level (15%maximal IV size). c- Instruments are not overidentified at 1% level of significance.
Note: Robust standard deviations in parentheses. * Significance at 10%; ** Significance at 5%; *** Significance at 1%.
Last, the estimations using as instruments the “share of women aged 55 to 64 in the previous census (10 years before)” ( - ), and the “share of women aged over 65 who have more daughters than sons” ( ), which comprise
Group II, were all significant and featured the expected signs. In the sixth column, we see that the coefficients estimated for POLS show that an increase in the share of elderly reduces per young public education expenditure, while the ratio of elderly co-residing with the young increases this expenditure.
The estimations using these same instruments, but considering the panel characteristic (FE-IV, Group II) in the last column of Table 2.5, also show that the coefficients were significant and matched our expectations. The variable presented a coefficient equal to –0.193, while the variable presented a coefficient of 0.516. Moreover, the under - weak identification tests corroborated the validity of our instruments. Of all specifications presented in this study, the fixed effects with instrumental variables model (estimated in 2SLS) are the most suitable ones in the presence of the Tiebout bias and unobserved heterogeneity correlated with the covariates. Therefore, we should trust the results obtained by FE-IV (Group I) in the fifth column of Table 2.5, and by FE-IV (Group II) in the last column.
The results of Table 2.5 confirm that, to the extent that we employ consistent methods in the presence of endogeneity resulting from the correlation between fixed effects and the covariates, and use instruments for the endogenous variables given by the Tiebout effect, the coefficients become more significant and have a greater magnitude, further supporting our investigation. Finally, we dare say that our study was successful because the results of our estimations were validated by co-residence: co-residence between the young and the elderly results in higher demand for public education expenditure. Table A.2 of Appendix 1 shows the results of the estimations using “per pupil expenditure” as the dependent variable. Generally, the results also validate our main idea, but as we mentioned above, these results should be interpreted with some caution.
purpose of this variable to him is to check the presence of altruism among the elderly in relation to the young of the same origin (race) regarding public education expenditure. The author captures the effects that support the existence of altruism when young black and elderly black are in similar ratios within their age bracket. However, we found no evidence of this (Table A1 of Appendix 1). Regarding the ratio of young up to 18, we found that this ratio reduces per young expenditure. This result corroborates those of Poterba (op. cit), who argued that this effect is attributable to the size of the cohort phenomenon. Another argument in favor of this result is the fact that, among the young, it is more common to find those with a weaker socioeconomic situation and less political power. This means that their interests are underrepresented, which in part explains the fact that the higher the ratio of young in the municipality, the lower the expenditure (Poterba, 1998 and Preston, 1984). In regard to the other covariates presenting significant results, we see that an increase in the share of non-whites reduces per young expenditure. We also see this in relation to the increase in the population share. Finally, the ratio of individuals who have lived less than five years in their municipality has a positive effect on per young expenditure.
2.5 Final Remarks
This paper has shown how a group of elderly can choose not to reduce public spending on education provided that they co-reside with the young. This element is an innovation we have attempted to introduce in the literature dealing with the relation between the elderly and public education expenditure. Poterba (1997) and others have only shown that an increase in the share of elderly persons reduces per young public education expenditure.
In relation to the United States, for instance, these results may not be very significant because the share of elderly living with their children is much lower than in Latin American countries. On the other hand, in Brazil, it is common to find family arrangements where the elderly and young co-reside (Camarano & Ghaouri, 2002). Moreover, the social arrangement conditions the results.
3 Production Efficiency in Education: Evidence from the Brazilian Universities (2nd Essay)
The objective of this essay is to assess the determinants of performance from institutions of higher education in Brazil, taking particularly into account the relative efficiency of public and private institutions on the application of its resources. There has been a remarkable increase in the demand for Higher Education in Brazil in the past two decades. This reflects the response of the labor market demand for better qualified professionals, and also the requirement that candidates for public office must have Higher Education to sit for competition exams. In addition, in this same period, the percentage of individuals who finished High School education has increased, which eventually boosted the demand for Higher Education. 33 Moreover, the Federal Government influenced the supply of vacancies in two ways. The first concerns the Federal Government’s policy for the sector, which was apparently based on the supply of a larger number of vacancies through expansion of private organizations (PINTO, 2004). The second one is related to the “University Education for All” (ProUni), a program devised by the Brazilian Ministry of Education in 2004. This program grants low-income students from private Higher Education Institutions (HEI) full-tuition or half-tuition scholarships. 34
According to data of the 1987 and the 2007 Higher Education Census, the number of students enrolled in HEI more than tripled (a 231.9% increase). However, one should underscore that enrollments in private HEI were virtually three times greater than those in public institutions during the same period, increasing their share in the overall enrollment rate from 60.2 to 74.6% between 1987 and 2007. Regarding to the total HEI, the change observed in this period was 167.41%. Additionally, the number of public HEI rose only 3.75% between 1987 and 2007, compared to 231.48% in private HEI.
The empirical literature estimates production functions of K-12 and Higher Education developed independently from literature concerning the efficiency in the education provision. The methodology of Ordinary Least Squares (or any variant) was commonly used
to delineate a function through a series of points, and the waste did not receive special treatment. The concern was how the production structure parameters and not with individual deviations of estimated function. This shows that the average was considered more important than the best practice.
The availability of scores in standardized tests (ENADE – National Examination of Performance Evaluation of Student) for brazilian universities that provide a measure of output widely accepted and the possibility of direct estimation of education production function. Even qualitative indicators as occupation and remuneration in the long term could obtain better contribution of education for human capital, an intermediary result as the score in a standardized examination can be seen as basic elements in the accumulation of human capital35.
Thus, in this article estimates a production of stochastic function of education, in each university is confronted with its own production frontier, being this randomly frontier dependent of the full set from stochastic elements that are important but are out of universities control.
The empirical literature available on efficiency of higher education use largely DEA (date envelopment analysis) structure, being applied usually to the estimation of functions cost for universities in an individual country in which the dependent variable generally captures the number of students registered or its level (master, doctorate, receives financing, etc.). 36 Some recent references are Avkiran (2001) and Abbott and Doucouliagos (2003) for Australia, Salerno (2002) and Calhoun (2003) for the United States, Afonso and Santos (2004) for Portugal, Warning (2004) for Germany, Johnes (2005) for England, Jongbloed and Salerno (2003) and Chercye and Abeele (2005) for Holland and Castano and Cabanda (2007) for Philippines. Joumady and Ris (2004) represent an exception for working with a number of countries (Austria, Finland, France, Germany, Italy, Holland, Spain and the United Kingdom) .37 They also innovate to use as a measure of the output the competence
35 Sutherland, Price, Jourmad e Nicq (2007) follow to some extent the same direction, using as an intermediary result, the scores of PISA in four academic disciplines, to evaluate the provision efficiency of basic education in OECD countries.
36 Johnes, Oskrochi e Crouchley (2002) are an exception since using the Stochastic Frontier method to estimate a function cost to the higher education institutions of the United Kingdom.
gained during the graduation and competence required by current work, both obtained from a survey done with students from college38.
Ferrari and Laureti (2004) and Laureti (2008) estimate an output function of higher education in which the student is considered as the basic unit of production, using respectively a model of homocedastic (no explanation for the error terms) and heteroscedastic (some of the error terms are explained through other variables) Stochastic Frontier. As such work assesses a single university, average score in the exam gives the measure of output. However, as known the examinations made for the application in the classroom by professors are not standardized tests. A standardized test is a test, which is administered, which is corrected (given a score) and interpreted in a standardized way. The objective of standardization is to ensure that the test conditions are approximately the same for all individuals who are being submitted to the test. If this happens any student who was examined will have an advantage over others that can be attributed to the variance the administration procedures and so the results of evaluations shall be comparable. Therefore, considers that the ENADE consists of a better output measure because it consists of a standardized test.
This essay is organized in the following way. The first subsection discusses the output measure. As it is not aware of the standardized exams existence for higher education in other countries, presents carefully the evaluation system of brazilian universities since its implementation until today. The second subsection discusses briefly the inputs used. The third subsection presents the obtained results. The last subsection summarizes the main conclusions.