❊s❝♦❧❛ ❞❡
Pós✲●r❛❞✉❛çã♦
❡♠ ❊❝♦♥♦♠✐❛
❞❛ ❋✉♥❞❛çã♦
●❡t✉❧✐♦ ❱❛r❣❛s
◆◦ ✸✽✺ ■❙❙◆ ✵✶✵✹✲✽✾✶✵
❉②♥❛♠✐❝ ❊✛❡❝ts ❖❢ ▼❡r❝♦s✉r✿ ❆♥ ❆ss❡ss✲
♠❡♥t ❢♦r ❆r❣❡♥t✐♥❛
●❡r♠á♥ ❈❛❧❢❛t✱ ▼❛r✐❛ ❋❧♦r❡♥❝✐❛ ●r❛♥❛t♦✱ ❘❡♥❛t♦ ●❛❧✈ã♦ ❋❧ôr❡s ❏✉♥✐♦r
❏✉♥❤♦ ❞❡ ✷✵✵✵
❋✉♥❞❛çã♦ ●❡t✉❧✐♦ ❱❛r❣❛s✳
❊❙❈❖▲❆ ❉❊ PÓ❙✲●❘❆❉❯❆➬➹❖ ❊▼ ❊❈❖◆❖▼■❆ ❉✐r❡t♦r ●❡r❛❧✿ ❘❡♥❛t♦ ❋r❛❣❡❧❧✐ ❈❛r❞♦s♦
❉✐r❡t♦r ❞❡ ❊♥s✐♥♦✿ ▲✉✐s ❍❡♥r✐q✉❡ ❇❡rt♦❧✐♥♦ ❇r❛✐❞♦ ❉✐r❡t♦r ❞❡ P❡sq✉✐s❛✿ ❏♦ã♦ ❱✐❝t♦r ■ss❧❡r
❉✐r❡t♦r ❞❡ P✉❜❧✐❝❛çõ❡s ❈✐❡♥tí✜❝❛s✿ ❘✐❝❛r❞♦ ❞❡ ❖❧✐✈❡✐r❛ ❈❛✈❛❧❝❛♥t✐
❈❛❧❢❛t✱ ●❡r♠á♥
❉②♥❛♠✐❝ ❊❢❢❡❝ts ❖❢ ▼❡r❝♦s✉r✿ ❆♥ ❆ss❡ss♠❡♥t ❢♦r ❆r❣❡♥t✐♥❛✴ ●❡r♠á♥ ❈❛❧❢❛t✱ ▼❛r✐❛ ❋❧♦r❡♥❝✐❛ ●r❛♥❛t♦✱
❘❡♥❛t♦ ●❛❧✈ã♦ ❋❧ôr❡s ❏✉♥✐♦r ✕ ❘✐♦ ❞❡ ❏❛♥❡✐r♦ ✿ ❋●❱✱❊P●❊✱ ✷✵✶✵ ✭❊♥s❛✐♦s ❊❝♦♥ô♠✐❝♦s❀ ✸✽✺✮
■♥❝❧✉✐ ❜✐❜❧✐♦❣r❛❢✐❛✳
'
<1$0,&())(&762)
0(5&2685$
1$66(660(17
)25
$
5*(17,1$
*(50É1&$/)$75(1$72*)/Ñ5(6-5$1'0$5,$)/25(1&,$
*5$1$72
81,9(56,7<2)$17:(538)6,$%(/*,80
)81'$d®2*(78/,29$5*$6(3*(5,2'(-$1(,52%5$=,/
81,9(56,'$'1$&,21$/'(5,2&8$572$5*(17,1$
7+,69(56,210$<
$%675$&7
,1752'8&7,21
Regional integration agreements (RIAs) may not only provoke static, but also dynamic
effects on member countries. Theoretical and empirical results are however far from
conclusive as to which channels may give rise to either medium-term or long-term
growth effects. As a consequence, different and not necessarily compatible
methodologies have been applied to measure the growth effects of actual RIAs.
In the case of MERCOSUR, empirical studies of its dynamic effects on member
countries have not been accomplished yet, though they are certainly relevant, be it for
evaluating the countries’ experiences within the bloc or for helping designing the next
steps of the integration process.
This paper tries to measure the potential dynamic effects of MERCOSUR on the
Argentinean economy. Two approaches are applied: one used by Baldwin (1993) to
evaluate the dynamic impacts of the European Union, and another applied by Kehoe
(1994) to approximate the growth effects of NAFTA on Mexico. This allowed to
estimate both medium and long-run effects.
All estimations are carefully checked and have their magnitudes contrasted with
other figures derived from different sources. Besides, complementary empirical
assessments are made with the intention of providing additional insights on the
findings. The diverse empirical evidences support the existence, in the Argentinean
economy, of growth effects due to MERCOSUR.
The rest of the paper is organised as follows. Section 2 briefly summarises the
theoretical and empirical literature on the relationship between RIAs and growth,
are reported, analysed and contrasted, while Section 4 discusses the additional
evidences. The last Section concludes.
7+(25(7,&$/$1'0(7+2'2/2*,&$/,668(6
%DFNJURXQGFRQVLGHUDWLRQV
Following Baldwin (1993), static effects are here defined as those that lead to more
output from the same amount of inputs, where inputs include physical and human
capital, as well as knowledge capital (technology). In perfectly competitive models,
these static effects stem from changes in resource allocation and consumption
possibilities, while in models with imperfect competition gains may result from
increasing returns to scale as firms realise LQWHUQDO scale economies, and from
increased product and input variety. Dynamic effects are those that influence the
accumulation of factors and, consequently, affect the growth in per-capita income. As
far as the rate of capital accumulation depends on the costs and benefits of investing in
new human, physical and knowledge capital, for altering growth, RIAs must affect
these very costs and benefits.
Though different in nature, both effects are significantly connected. Static
efficiency gains are at the root of dynamic effects, resulting particularly important in
understanding them.1 One relationship between the two takes place through FRPPHUFH RI LQWHUPHGLDWH JRRGV. The production of capital of either form may involve traded
intermediates affected by trade barriers; hence the size of growth effects depends upon
how important partners’ exports are in the capital-sector’s cost function. The static and
dynamic sides are also linked by LQWHUVHFWRUDOH[SHQGLWXUHVKLIWV. If traded sectors are
relatively more capital-intensive than non-traded, RIAs, shifting expenditure to the
traded capital-intensive sector, boost the derived demand for capital, increasing capital
accumulation and growth. A third relationship relies on the fact that reciprocal
1
liberalisation may produce a SURFRPSHWLWLYH HIIHFW, changing prices in the capital
sector.
Dynamic or growth effects of RIAs are usually separated into medium-term and
long-term effects. Neoclassical growth literature provides the framework for thinking
about the former: liberalisation, through its static effects, may raise the return to
capital, giving place to higher investment levels, an increase in the steady-state level of
income explained by the presence of diminishing returns to accumulation and an
associated medium-term rise in growth rates. Endogenous growth theory provides the
framework to analyse the latter. Market integration may alter the rate of per-capita
GDP growth, by affecting either the present value of investing in new capital or the
cost of capital goods, as capital not facing diminishing returns on an economy-wide
basis does not cease to be accumulated.2
Endogenous growth models compared to neoclassical ones permit consideration
of a wider range of economic channels by which trade can affect growth. Grossman
and Helpman (1991), drawing attention to the role of research and development
activities, proposed that integration may lead to changes in income and growth through
four principal channels.3 First, economic integration, even in the absence of trade flows, may enhance international dissemination of knowledge (international
spillovers), allowing scientists in one country to learn more or faster from advances in
other countries. Second, trade can eliminate duplication of innovations. Third, trade
can expand effective market size for firms in each country boosting profits, as R&D
costs can be spread over a larger market, and also increase the degree of competition
facing domestic innovation. This pro-competitive effect may increase or decrease the
incentive to innovate. While the former is the most common result predicted by
endogenous growth models, the latter is also found in some, specially the
2
Schumpeterian ones. Finally, because of changes in relative factor prices, trade can
lead to changes in resource allocations, moving them to the R&D sector.4
Most empirical studies and surveys on the dynamic effects of RIAs -as Baldwin
and Seghezza (1996), USITC (1993), among others- agree on the lack of a
unanimously accepted methodology for measuring such effects. The empirical studies,
mainly carried on for the European case, can be placed into three different
methodological groups. The first, which includes works like Baldwin (1989, 1992 and
1993), Baldwin and Seghezza (1996 and 1998) and Kehoe (1994), basically applies
TXDQWLWDWLYHH[SORUDWLRQV. In order to capturethe mechanisms through which RIAs may
affect growth, they analyse indicators and their evolution (SULPD IDFLH HYLGHQFH) and
make tentative calculations roughly derived from theoretical models. As a result, they
qualify as approximations to the measurement of medium and long-run growth effects.
A second set of studies estimates simple growth regressions using either cross-section
data for a range of countries or time series data on individual countries. Examples are
Levine and Renelt (1992), Lee (1992 and 1994), De Long and Summers (1991), Barro
(1991), Coe and Helpman (1995), Backus et al. (1992), and, again, Baldwin and
Seghezza (1996). A third group applies computable general equilibrium (CGE) models
for estimating the growth effects of trade liberalisation. Though static CGE models are
being increasingly used, there are few applications considering dynamic settings, and
even less that incorporate endogenous growth mechanisms; two examples being
Rutherford and Tarr (1998) and Diao et al. (1999).
Each of the above categories presents well-known drawbacks. Within the first
group, there is few or nothing to tie the dynamic effects specifically to the RIA
enactment. Considering the econometric works, almost none derives the growth
regression from a theoretical model. Moreover, most use strong prior beliefs to choose
which variables are included in the equations, and incorporate investment as an
3 One important distinction among endogenous growth models is whether technological change results from the
development of new blueprints through R&D or whether it results from a more efficient use of existing blueprints through learning by doing.
exogenous variable, hence eliminating the possibility to capture investment creation.
Dynamic CGE models are poorly developed, and their empirical application to study
trade policy implications is only starting.
Attempts to measure MERCOSUR’s dynamic effects have not been made yet.
Studies on static effects do exist, examples being Calfat and Flôres (1996), Flôres
(1997) and Hinojosa et al. (1997). This paper is a first effort to measure dynamic
effects in the Argentinean economy. Different approaches, belonging to the first group
previously mentioned, are applied. In spite of their limitations, they were chosen for
two main reasons. Firstly, the estimation of growth regressions would have required
long time series data on Argentina which are not available due to MERCOSUR’s short
life; while building up a dynamic CGE model for Argentina as a member-country
would have been, though interesting and needed, an activity beyond the scope of this
work. Secondly, applying Baldwin’s and Kehoe’s approaches ensures, as shown below,
the consideration of both medium and long-term effects.
7KHPHWKRGVDGRSWHG
Baldwin (1989) presents three ways to compute the growth effects of EC92. One of
them WKH DJJUHJDWH *'3 DSSURDFK permits estimating medium-run growth
effects, and is used in this work. The other two, which compute long-run effects after
modifying and calibrating Romer (1987) and Krugman (1988) approaches,
respectively, seem even less robust than the former and are not applied here. The
aggregate GDP methodology, derived from a neoclassical framework, consists in
estimating the proportional rise in per-capita GDP (<$) due to regional integration by
the following equation:
^ ^ ^
1
< α β β α
= +
−
(1)
where β$ represents the static effects, and α is the capital-output elasticity. The second
increases in per-capita GDP due to the induced rise in the steady-state level of capital,
or medium-run effects.
For estimating the growth effects of EC92 on European countries, Baldwin (1989
and 1992) took the static gains from the &HFFKLQL5HSRUW, and a range of estimates for
the capital-output elasticity from different authors. Due to the fact that the size of αis
an unsettled empirical question, most were estimations of the capital’s share in income
(or one minus labour’s share in income). He concluded that the dynamic effect was
considerable, and not dependent on the new growth theory, as it is present even within
the Solow model.
Estimates from this approach are obviously rough, as its analytical framework has
many drawbacks. It does not account for the fact that integration will not affect all
sectors equally, and assumes, somewhat hopefully, that RIAs enhance physical capital
accumulation. Actually, Baldwin assumes that the real return on forgone consumption
(U) is decreasing with the level of trade barriers (τ); however, in more general terms, by
the Stolper-Samuelson theorem, U may be either increasing or decreasing in τ.
Kehoe (1994)’s methodology for studying long-run effects is based on Backus et
al. (1992), who established statistical regularities across countries, linking
intra-industry trade and inter-intra-industry specialisation with growth. More specifically, he uses
the changes in a specialisation index for exports and in the Grubel-Lloyd
(intra-industry trade) index to infer whether, within a RIA, an increase in the manufacturing
productivity growth rate may result. He assumes that, if a RIA leads to specialisation in
final output and, henceforth, to industry output increases, learning-by-doing may result
in continual productivity improvements leading to increased economic growth for the
economy as a whole. Thus, the specialisation index tries to capture the relationship
between trade, inter-industry specialisation, and economic growth. On the other hand,
specialised intermediate inputs, Kehoe interprets that an increase of the index indicates
that the country gains access to other countries’ experience, thereby raising its
productivity growth.
The JURZWKDFFRXQWLQJ equation below, based on Backus et al. (1992) and
derived after regressing the manufacturing productivity growth rate on the export
specialisation and Grubel-Lloyd indexes (as well as additional variables:
manufacturing output, per capita income and primary school enrolment) for a wide
range of countries, is used to estimate the dynamic gains for Mexico from the NAFTA:
J¶±J OQ(6¶(6OQ*/¶*/(2)
whereJ′andJare the new and old productivity growth rates,(6′and(6are the corresponding export specialisation indexes, and*/′and*/the Grubel-Lloyd indexes.
Potential dynamic effects are thus obtained by making very crude assumptions
regarding the integration impacts on the specialisation and Grubel-Lloyd indexes. Like
other TXDQWLWDWLYH H[SORUDWLRQV, Kehoe’s approach fails to explicitly link trade policy
with economic growth, and simply DVVXPHV that preferential trade liberalisation
enhances growth, by increasing specialisation and intra-industry trade, when this is just
a probable issue which should be proved.
0($685,1*0(5&2685'<1$0,&())(&76
0HGLXPWHUPHIIHFWV
Baldwin’s approach requires two values: an estimate of the static efficiency impact due
Three different estimates of static gains were considered (see Table 1). The first
was obtained by Flôres (1997), and corresponds to a long-run solution within a static
CGE model with imperfect competition and increasing returns to scale at firm level.
The author defined as ORQJUXQVROXWLRQV those resulting when there is free entry-exit
of firms and profits in traded sectors go to zero, and computed them for three different
scenarios. We chose a value related to the solution for scenario “A”, because it seems
closer to reality. The second estimate is from Hinojosa et al. (1997), who used their
NASAFTA model which incorporates, among other features, the possibility to capture
the potential dynamic externalities as a result of liberalisation. The last comes from
Calfat and Flôres (1996), who used a perfectly competitive set-up. It is worth
mentioning that these estimates are not exactly comparable; however, using the three
of them seems less arbitrary than choosing only one.
7$%/((VWLPDWHGVWDWLF&*(HIILFLHQF\LPSDFWVRI0(5&2685RQ$UJHQWLQD DVSHUFHQWDJHRI*'3
$XWKRU 6WDWLF,PSDFW
Flôres (1997) 1,80
Hinojosa, et al. (1997) 0,35 Calfat and Flôres (1996) 0,13
Capital-output elasticities, which are shown in Table 2, were taken from different
studies recently carried for Argentina. The estimations by Meloni (1998) come from
three different output regressions: one with a Cobb-Douglas specification, with
constant returns to scale and where production factors are TXDOLW\DGMXVWHG and two
others considering intensive forms of the production function, with quality-adjusted
and non-quality-adjusted production factors, respectively. In the case of Grosz (1998),
two output regressions were run for the traded sector, considering either a constant
convertibility. The last three values of the table correspond to estimations of capital’s
share of income.5
Given the above elasticities, a range of values going from 0,40 to 0,65 was
considered for the estimation. The resultant %DOGZLQPXOWLSOLHU 1
α α
− , which gives the
range of medium-run growth bonus, goes from 0,67 to 1,86. The estimated total
dynamic gains are presented in Table 3.
7$%/((VWLPDWHGFDSLWDORXWSXWHODVWLFLWLHVIRU$UJHQWLQD
$XWKRU &DSLWDORXWSXWHODVWLFLW\
Meloni (1998) 0,48 to 0,57 0,40 to 0,51
0,55 Grosz (1998) 0,52 to 0,58
0,56 to 0,61 Ministry of Economy (1998) a 0,4 De Gregorio (1998) a 0,3 to 0,4 Traa(1996) a,b 0,4 to 0,75
Notes: In the cases of Meloni and Grosz, the range of their multiple estimations (under different assumptions) was considered.
a
Values taken from Meloni (1998). b Traa reports studies of the World Bank.
7$%/((VWLPDWHG0(5&2685PHGLXPWHUPDQGWRWDOHIIHFWVLQ
6WDWLF,PSDFW 0HGLXPUXQHIIHFW 7RWDOHIIHFW
1,80 1,20 - 3,34 3,00 – 5,14 0,35 0,23 - 0,65 0,58 - 1,00 0,13 0,09 - 0,24 0,22 - 0,37
Notes: From equation (1), the first term is the 0HGLXPUXQ HIIHFW and<$is 7RWDO HIIHFW. The
values of 0HGLXPUXQ HIIHFW and 7RWDO HIIHFW on the right correspond to a capital-output elasticity of 0,65 , while those on the left correspond to a capital-output elasticity of 0,40.
It can be concluded as Baldwin did for EC92 that the dynamic effects may
be considerably greater than the static ones. However, Argentina might not have
5
benefited from the integration as much as certain European countries, basically due to
the magnitude of static gains. The difference between the Argentinean and the top
European cases may perhaps be explained by the level of integration established
through each programme: a VWDUWLQJ LQWHJUDWLRQ with MERCOSUR and a GHHSHU
LQWHJUDWLRQ through EC92.
As a way of evaluating how meaningful the above results are, one should
compare the estimated total effect with real data on per-capita output growth.
Nevertheless, two problems appear. First, the growth rate in per-capita GDP may be
explained by a number of different factors, being not possible to tie its actual
movements and trend to an isolated issue such as trade policy.6 Second, we do not know the speed at which the values in Table 3 will come true. Notwithstanding, a
tentative evaluation may be performed with the help of the neoclassical notion of VSHHG
RIFRQYHUJHQFH.
Following Romer (1996) and Baldwin (1993), the dynamics around the
steady-state is approximated by the following expression
(
)(
)
(
*)
/
1 ln ln W G< <
Q < <
GW = + +η δ −α − (3)
where Q is the rate of population growth, η the exogenous rate of technological
progress and δ is the depreciation rate. Under investment-led growth, considering year
rates, per-capita GDP closes λ=
(
Q+ +η δ)(
1−α)
percent of the gap between its currentlevel (<W) and the new steady-state level (<*) each year.
i) Meloni (1998)’s value for total factor productivity growth rate of 4,07% per annum,
over 1990-1997, corresponding to the case of non quality-adjusted production factors
(which is an internationally comparable method);
ii) an average yearly population growth of 1,33% , corresponding to the same period,
calculated using data in IMF (1999);
iii) a depreciation rate of 4% obtained from Reca (1998);
iv) the range of values for the capital-output elasticity already applied (0,40 to 0,65).
The resultant λ is between 3,76 and 6,11%, and implies that the convergence (or
accumulation) process has a half-life of about 18 or 11 years, respectively. Taking now
< to be the steady-state level implied by MERCOSUR’s total effect predicted in Table
3, and considering a five years horizon, the previous speeds imply that over 17 to 26%
of the total effect should have been achieved within the first five years after
MERCOSUR enactment. These values, for the different estimates obtained, appear in
Table 4.
7$%/( (VWLPDWHG SHUFHQWDJH YDULDWLRQV RI *'3 DIWHU ILYH \HDUV RI 0(5&2685
7RWDOHIIHFW (IIHFWDIWHUILYH\HDUV
3,00 - 4,50 0,51 - 1,18 0,58 - 0,88 0,10 - 0,23 0,22 - 0,33 0,04 - 0,09
Note: The values on the left, for both columns, correspond to a capital-output elasticity of 0,40 , and those on the right to a capital-output elasticity of 0,65.
The actual proportional change of Argentinean per-capita GDP between 1991 and
1996 was of 18,45%, and of 4,85% between 1993 and 1998, IMF (1999). The second
period covers years during which it is safer to HQVXUH that at least some static effects of
MERCOSUR had already taken place; notwithstanding, both largely support the results
obtained from Baldwin’s methodology.
6 For future research, it will be interesting to obtain MERCOSUR effects against a carefully designed
/RQJWHUPHIIHFWV
The data used for estimating the long-run effects correspond to manufacturing sectors
positions 500 to 899 of the Standard International Trade Classification (SITC),
revision 3, at the three-digit level i.e. same level as Kehoe’s - and were obtained
from the DATA INTAL database for the period 1986-1996. Values were converted
from US dollars to Argentinean pesos, and deflated by exchange rates and GDP
deflators published in IMF (1999). The period considered imposes an important
restriction on the analysis, given that MERCOSUR’s Customs Union was not fully
established until 1995. However, less ambitious forms of regional integration had been
pursued by MERCOSUR countries, through bilateral agreements, since the mid-1980s,
so that much of intra-regional trade had been already liberalised by 1994 (see
Blomström and Kokko (1997), for instance). Though obvious that it is somewhat early
to detect even the static effects on foreign investment, tentative conclusions may be
drawn from the region’s experience since the mid-eighties.
A few modifications were introduced in Kehoe’s methodology. One was to
ignore the export specialisation index, due to the impossibility to find the required
manufacturing output data. This means that one of the channels for endogenous
technical change, specialisation in final production and the subsequent
learning-by-doing process, was not analysed.7 Another change, or rather an improvement, was to calculate (and not, assume) the new values of the Grubel-Lloyd index (*/′), by dividing the data into pre- and post-MERCOSUR periods. The estimate of the change
in the growth rate of manufacturing productivity (J′ −J) thus results, at least partly, from the MERCOSUR enactment, reducing the lack of HPSLULFDOO\SURYHG linkages
between trade and growth in the approach.
Estimation was carried out in two different ways, according to how the
Grubel-Lloyd indexes were obtained: i) for specific years: one before, 1986, and another after
then compare these estimates with those from Baldwin’s approach.
7
MERCOSUR formation, 1996, or ii) as averages for the pre- and post-MERCOSUR
periods. In the second case, periods correspond to 1986-1988 and 1994-1996. This is
because 1989 and 1990 were recessive and hyper-inflationary -not QRUPDO- years;
while the selection of 1994-1996 aimed at capturing some of the actual integration
dynamics. The reason for using these two options, apart from Kehoe also doing the
same, was that, ex-ante, both seemed reasonable.
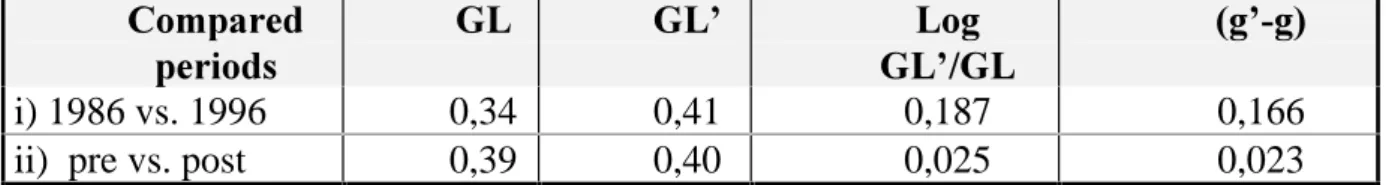
Table 5 shows the estimated changes in the average yearly manufacturing
productivity growth rate due to MERCOSUR’s likely impacts on intra-industry trade
flows. Results are very sensitive to the periods used, and show that integration, through
greater trade in specialised inputs, increased manufacturing productivity growth rate by
an additional range of 0,02 to 0,17% per year. After thirty years, the level of output per
worker in Argentina will be 0,60 to 5,23% higher than otherwise.
7$%/( (VWLPDWHG SHUFHQWDJH FKDQJH LQ PDQXIDFWXULQJ SURGXFWLYLW\ JURZWK UDWH
&RPSDUHG SHULRGV
*/ */¶ /RJ
*/¶*/
J¶J
i) 1986 vs. 1996 0,34 0,41 0,187 0,166 ii) pre vs. post 0,39 0,40 0,025 0,023
Computing again the changes for Mexico, when only the assumed change in the
Grubel-Lloyd index is considered, Mexican manufacturing productivity growth rate
would have increased by an additional 0,242% per year, so that, after thirty years, the
output per worker would be 7,52% higher than without NAFTA. Thus, the potential
effects of MERCOSUR look somewhat smaller. Perhaps, as Baldwin and Seghezza
(1998) proposed, R&D-based links, which give rise to trade-induced knowledge-led
growth, may, to some extent, be disconnected from the realities of the integration
among less developed countries, in contrast to the situation in which at least one
To evaluate the accuracy of the results, we tried to compare them with the actual
evolution of total factor productivity (TFP). However, the most suitable estimations of
TFP annual growth rate found for pre- and post-MERCOSUR periods -1,83 and
4,07% between, respectively, 1980-1989 and 1990-1997, Meloni (1998) cannot be
directly compared with the (J′ −J) estimates, as they correspond to crucially different periods, both in terms of trade policy and macroeconomic setting.
A further interesting issue is to compare the change in the manufacturing
productivity growth rate that would have been caused by Argentinean
intra-MERCOSUR trade on one side, and extra-intra-MERCOSUR trade on the other. This is
likely to reveal the main effect of MERCOSUR until 1996, which may have acted
through intra-zone rather than extra-zone trade liberalisation.8 Besides, it can help to isolate an effect exclusively explained by MERCOSUR formation, and not by the
Argentinean unilateral liberalisation, which had already started in 1988. For
accomplishing this, (J′ −J) was re-estimated twice: one using the change in the
Grubel-Lloyd index for intra-zone trade, and another employing the change in
extra-zone intra-industry trade. The results, for the same periods and years taken into account
before, are presented in Table 6. The change in trade flows among Argentina, Brazil,
Paraguay and Uruguay explains a greater increase in the manufacturing productivity
growth rate than the one due to the change in Argentinean extra-zone trade.
Nevertheless, specially in the (more robust) pre and post-MERCOSUR case, the
difference seems not so significant, perhaps because the dynamic impacts had not yet
taken place or perhaps due to the importance of the effects of Argentinean unilateral
trade liberalisation.
7$%/( (VWLPDWHG SHUFHQWDJH FKDQJH LQ PDQXIDFWXULQJ SURGXFWLYLW\ JURZWK UDWHGXHWRLQWUDDQGH[WUD]RQHWUDGHOLEHUDOLVDWLRQ
&RPSDUHG */ */¶ ORJ*/¶*/ J¶J
8
SHULRGV
,175$ i) 1986 vs 1996 0,44 0,63 0,359 0,319
=21( ii) pre vs post 0,39 0,66 0,518 0,461
(;75$ i) 1986 vs 1996 0,20 0,22 0,106 0,096
=21( ii) pre vs post 0,17 0,27 0,463 0,412
$'',7,21$/(9,'(1&(217+('<1$0,&())(&76
The empirical evidences found in the previous section suggest that, either from a
neoclassical or an endogenous growth perspective, regional integration might have
benefited the Argentinean economy by temporarily or permanently raising its growth
rates. The following analyses give an extra support to the argument.
5HPHDVXULQJWKHFKDQJHLQWUDGHIORZVRIVSHFLDOLVHGLQSXWV
Kehoe’s methodology, by considering the change in the Grubel-Lloyd (GL) index, may
not in fact address the change in intra-industry trade. Brülhart (1994) pointed out that
an observed increase in intra-industry trade levels e. g. in the GL index between
two periods could KLGH an uneven change in trade, concomitant with inter- rather than
intra-industry specialisation. Thus, for measuring the extent to which a country
becomes more or less open to trade in highly specialised inputs than in the past, a
G\QDPLF analysis of intra-industry trade is needed. In this direction, Brülhart proposed
the $ or marginal intra-industry trade (MIIT) index, which calculates the degree of
intra-industry trade in total QHZtrade by evaluating the marginal change in trade flows.
The $ index is defined as:
$ ; 0
; 0
W Q W Q
W Q W Q
= − − +
1 ∆ ∆ 4
∆ ∆
, ,
, ,
( )
where ∆;WQ = ;W -;WQ and ∆0WQ 0W0WQare, respectively, the differences between
the current values of exports and imports, and their values WQperiods before. Like the
industry to be completely of LQWHU-industry type, and 1 to be entirely of the LQWUD
-industry type, Brülhart (1994, page 605).
The $ index was calculated for each three-digit manufacturing sector, using the
same trade data as before, and considering the same two time options. They were then
summed across industries, by scaling for gross trade, generating a global measure of
MIIT. Three different JURVV WUDGHVFDOLQJ weights were considered: initial, final and
the average initial-final gross trade; the MIIT index for this last one seeming the most
directly comparable measure with the change in the Grubel-Lloyd indexes already
calculated.
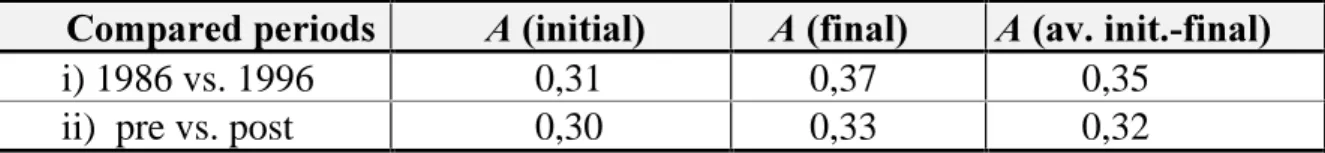
Table 7 presents the six global MIIT indexes obtained.All results indicate an
increase in the trade in specialised inputs, as was also the LQWHQWLRQ behind the use of
the change in the Grubel-Lloyd indexes in Kehoe’s methodology. However, compared
to the “changes” displayed in the third column of Table 5, the MIIT indexes suggest a
higher intra-industry specialisation than the previous analysis, thus providing stronger
support to potential knowledge-driven growth effects.
7$%/(0DUJLQDOLQWUDLQGXVWU\WUDGHLQGH[HV
&RPSDUHGSHULRGV $LQLWLDO $ILQDO $DYLQLWILQDO
i) 1986 vs. 1996 0,31 0,37 0,35 ii) pre vs. post 0,30 0,33 0,32
Note: All column values were obtained after summing across industries, scaling for initial, final and the average initial-final gross trade, respectively.
The MIIT indexes were also calculated for the intra- and extra-MERCOSUR
trade, with the objective of isolating effects that could be exclusively explained by the
integration. Table 8 shows that the long-run effects due to trade linkages among
members appear to be, as a likely implication of the results, more important than those
7$%/(0,,7LQGH[HVIRULQWUDDQGH[WUD0(5&2685WUDGH
&RPSDUHG SHULRGV
$LQLWLDO $ILQDO $DYLQLWLDO ILQDO
,175$ i) 1986 vs. 1996 0,42 0,60 0,57
=21( ii) pre vs. post 0,34 0,61 0,55
(;75$ i) 1986 vs. 1996 0,19 0,18 0,19
=21( ii) pre vs. post 0,04 0,22 0,04
Note: Same as in Table 7.
Finally, following Brülhart (1994) suggestions, we compared the evolution of
(marginal) intra-industry trade both before and after MERCOSUR formation, instead
of looking at its change between two separated periods. Hence, taking 1991 as a
breaking point, two global $indexes (using the “average initial-final” weights) were
calculated for each trade flow intra- or extra-zone, and total trade, one measuring
the change between 1986 and 1990 and the other that between 1992 and 1996.
All intra-industry trade flows in Table 9 have changed their evolution since 1991,
becoming much more dynamic after the formation of the bloc. Though the greatest
percentage change of MIIT has occurred for extra-zone trade (600%), the highest
index, 0,468 , has shown up for the intra flows and, indeed, within the
post-MERCOSUR period. This also supports the idea of post-MERCOSUR giving place to
growth effects.
7$%/( $ FRPSDULVRQ EHWZHHQ 0,,7 LQGH[HV IRU LQWUD DQG H[WUD 0(5&2685WUDGH
,QWUD]RQHWUDGH ([WUD]RQHWUDGH 7RWDOWUDGH
0,132 0,022 0,099
0,468 0,154 0,375
We analyse here SULPD IDFLH evidence for investment-led growth in Argentina.
Following Baldwin and Seghezza (1998), we search whether, in parallel with the
evolution of MERCOSUR: i) the ratio of aggregate investment to GDP has increased,
ii) net foreign direct investment (FDI) improved, and iii) the current account
deteriorated.9 As an attempt to deepen the study, beyond investment-led growth, we also address skill- and technology-led growth, by analysing investment in physical
capital, investigating the role played by FDI in the growth process and reviewing data
on the evolution and composition of the current account.
9 A fourth condition, the increase in stock market prices, was not used, as the Argentinian stock market does not
PRIMA FACIE EVIDENCE FOR INVESTMENT LED-GROWTH IN ARGENTINA (YROXWLRQRISHUFDSLWD*'3 2000 2100 2200 2300 2400 2500 2600 2700 2800 2900
76 78 80 82 84 86 88 90 92 94 96 98 <HDUV 0 LOO RQ V RI ,QYHVWPHQW*'3UDWLR 12% 14% 16% 18% 20% 22% 24% 26% 28%
76 78 80 82 84 86 88 90 92 94 96 98
<HDUV 3H UF HQ WD JH &XUUHQWDFFRXQW*'3UDWLR -5% -4% -3% -2% -1% 0% 1% 2% 3% 4%
76 78 80 82 84 86 88 90 92 94 96 98
<HDUV 3H UF HQ WD JH )',*'3UDWLR -0.5% 0.0% 0.5% 1.0% 1.5% 2.0% 2.5% 3.0%
76 78 80 82 84 86 88 90 92 94 96 98
<HDUV 3H UF HQ WD JH
Figure 1 shows that per-capita GDP picked up rapidly in 1990, just before
MERCOSUR enactment and simultaneously with Argentina’s comprehensive
programme of macroeconomic reforms (monetary and fiscal), tied to broad
deregulation and privatisation plans. A higher rate of physical capital formation is
behind this rapid growth; since 1990, after fourteen years of decline, the investment
rate has improved, achieving its past mid-1980s levels. This establishes the linkage
between trade and growth that may take place through the rise of national investment
rates (see Baldwin and Seghezza (1998)).
As a consequence of the positive investing behaviour, the stock of physical
capital has been continuously increasing, resulting, in 1996, 12% greater than in 1991
and beyond its 1980s levels; something true for the three series of physical capital we
observed (two from Martinez et al. (1998) and one built by Meloni (1998), on the basis
of the first two). Studies like Martinez et al. (1998) and Bisang and Gomez (1999)
indicate that the abrupt fall in the relative prices of capital goods around 20%
between 1990 and 1996 was a determinant factor for the accumulation process. This,
together with the greater proportion of imported goods in the total of investment goods
along the 1990s over 62% average annual participation, see Figure 2-, implies that
trade liberalisation may have been boosting accumulation. Nevertheless, as both
Martinez et al. (1998) and Bisang and Gomez (1999) suggest, the HQWLUH programme of
economic reforms may be explaining the movement in the relative prices of
capital-goods. Anyhow, the rising importance of imported investment goods in total
investment goods supports the probability of knowledge-led growth in Argentina a
point also analysed later on.
The right bottom panel in Figure 1 shows that MERCOSUR has been
accompanied by FDI inflows. The attractiveness of the country, enhanced since 1987,
did rapidly rise with MERCOSUR between 1993 and 1997. In spite that important
reforms of investment rules -which may explain at least some of the FDI
MERCOSUR, of a new regime to promote and protect investment in the region – of
which the Colonia and Buenos Aires Protocols are examples. If FDI inflows to
Argentina had taken place as a result of MERCOSUR which, as it has been
expressed, seems difficult to be fully proved there would appear another linkage
between regional integration and the Argentinean economic growth. Therefore, and
due to the fact that in Argentina most foreign investors come from developed,
WHFKQRORJLFDOO\DGYDQFHG economies (42% of the accumulated FDI flows, between
1992 and 1998, came from Europe, and 30% from North America, Ministry of
Economy (1999)), the role of FDI as a conduit for the international diffusion of
technology may be important.
),*85(
,PSRUWDQFHRILPSRUWHGLQYHVWPHQWJRRGV
Percentage of total invetment goods
15% 25% 35% 45% 55% 65% 75% 85%
80 81 82 83 84 85 86 87 88 89 90 91 92 93 94 95 96 97
<HDUV
3
H
UF
H
Q
WD
J
H
National investment goods
Imported investment goods
6RXUFH0DWLQH]HWDOEDVHGRQ0LQLVWU\RI(FRQRP\
The left bottom panel shows that the current account, after a short favourable
period, has been in deficit since MERCOSUR enactment. This indicates a positive
balance of the capital account and hence an entry of foreign capital into the country,
which might have helped investment-led growth. Nevertheless, only a more
potential growth effects. Accounting for this, some preliminary analyses of imports
were done.
During the 1980s, imports maintained an almost constant level that contrasts with
their positive trend in the 1990s (see Figure 3). Explaining most of this evolution, as
Figures 3 and 4 show, are intermediate and capital-good imports.10 In the case of intermediates, their increased trade could have boosted investment-led growth as far
as they are potentially used by the capital sector; this apart from the
knowledge-driven growth implications of increased trade in specialised intermediate inputs,
which was investigated in section 3.2. On the other hand, entry of foreign capital
goods, generally high-tech products, might have acted as a conduit for the
international diffusion of technology, and then as a propagator of knowledge-led
growth. Continuing with this type of analysis, it is interesting to look at changes in
the origin of imports of technology- and human capital-intensive manufactures.
Between 1986 and 1996, Argentinean imports of these goods were never less than
86% of total manufacturing imports, and they oscillated between 80,2 and 91,4% of
its total manufacturing imports from MERCOSUR.
Table 10 shows that the average annual proportion of intra-zone imports in the
total was, after MERCOSUR enactment, 3,4 points higher than before. Moreover,
while intra-zone imports changed from 16,3% to 18,4% of all manufacturing imports
as an average annual proportion before and after MERCOSUR formation,
respectively, extra-zone imports fell from 82,2% to 68,2% of that total (i.e.the sum
of human capital- and technology-intensive manufactures, natural resources-intensive
products and non-labour-intensive manufactures). Therefore, although intra-zone
imports of human capital- and technology-intensive manufactures have never
surpassed 23% of the total trade in these goods, MERCOSUR may be explaining most
of their rise during the period and, as a consequence, at least some skill- and
knowledge-led growth in Argentina during the last decade.
10 Traded intermediates include imported
Summing up, there is favourable SULPD IDFLH evidence on MERCOSUR-led
growth for Argentina.
),*85( ,PSRUWDQFHRIFDSLWDOJRRGDQGLQWHUPHGLDWH LPSRUWV 0 2000 4000 6000 8000 10000
80 82 84 86 88 90 92 94 96 98
<HDUV 0 LOO LR QV R IF RQ VW DQ W
T otal imps C-goods, interms & parts Others 6RXUFH0LQLVWU\RI(FRQRP\DQG ),*85( ,PSRUWVRIFDSLWDOJRRGVDQGLQWHUPHGLDWHV 0 2000 4000 6000 8000 10000
80 82 84 86 88 90 92 94 96 98 <HDUV 0 LOO LR QV R IF RQ VW DQ W Interms C-goods
Parts & accs.
C-goods, interms & parts
6RXUFH0LQLVWU\RI(FRQRP\DQG
7$%/( ,PSRUWDQFH RI KXPDQ FDSLWDO DQG WHFKQRORJ\LQWHQVLYH PDQXIDFWXULQJLPSRUWVLQ$UJHQWLQD
2ULJLQ
+FDSDQGWHFK Intra-zone trade 14,0 22,2 19,0 23,0 19,8 21,5
LQWHQVLYHJRRGV Extra-zone trade 86,0 77,8 81,0 77,0 80,2 78,5
7RWDO Intra-zone trade 12,7 20,3 17,1 20,0 17,5 18,5
Source: DATA INTAL (at 3-digit level SITC, rev. 3,). Values were converted from US dollars to Argentinean pesos and deflated using IMF (1999) exchange rates and GDP deflators. Classification of manufacturing imports was according to Intal (1997).
&21&/8',1*5(0$5.6
We conclude that both medium and long-run growth effects might have taken place in
Argentina, though they seem to be smaller than those for EC92, and perhaps for
Mexico in the NAFTA. In the case of the EC92, the level of integration attained
through each programme may mainly explain the difference: a VWDUWLQJ LQWHJUDWLRQ
with MERCOSUR and a GHHSHU LQWHJUDWLRQ through EC92. On the other side,
Mexico’s possible larger benefits may take place because the other NAFTA members,
WHFKQRORJLFDOO\DGYDQFHG economies, are actually able to induce knowledge-led
growth, while MERCOSUR’s other partners are not much more advanced than
Argentina.
The complementary analysis of MIIT indexes also supports the existence of
growth effects, by showing that intra-industry specialisation, central to endogenous
growth models, has risen and that its change has been indeed significant for
Argentinean intra-MERCOSUR trade.
The analysis of SULPD IDFLH evidence is coherent with MERCOSUR-induced
investment-led growth. Besides, there seems to be evidence of knowledge
dissemination through trade flows and FDI, which would imply induced
knowledge-led growth in Argentina. This analysis has also shown that the macroeconomic
situation of the country and the importance of its early 1990s reforms clearly
contributed to the evolution of GDP, investment, the current account and the FDI
flows. It is obviously difficult to disentangle these effects from those due to the
The present study naturally suffers from other methodological shortcomings.
Approaches that attempt at TXDQWLWDWLYH H[SORUDWLRQV ignore many important general
equilibrium interactions and disregard relevant dynamic issues. No discussion on the
welfare effects of MERCOSUR was made, a topic that is crucial for a more complete
evaluation of the agreement.
Further research on the dynamic implications of MERCOSUR is definitely
needed, applying other methodologies that may overcome some of the limitations
addressed in this paper. Though interesting possibilities exist, as Feenstra et al.
(1999)’s sectoral or “micro-based tests” of the determinants of growth, we believe that
the design and construction of a dynamic CGE model, incorporating endogenous
growth mechanisms, is foremost.
5()(5(1&(6
Backus, D. K., P. Kehoe and T. J. Kehoe (1992) In Search of Scale Effects in Trade and Growth. -RXUQDORI(FRQRPLF 7KHRU\ 58, pages 377-409.
Baldwin, R. (1989) The growth effects of 1992. (FRQRPLF3ROLF\ October, pages 247-281.
Baldwin, R. (1992) Measurable Dynamic Gains from Trade. -RXUQDORI3ROLWLFDO(FRQRP\ 100 (1), pages 162-174. Baldwin, R. (1993) On the Measurement of Dynamic Effects of Integration. (PSLULFD 20, pages 129-145.
Baldwin, R. and E. Seghezza (1996) Growth and European Integration: Towards an Empirical Assessment. &(35 'LVFXVVLRQ3DSHU, No1393.
Baldwin, R. and E. Seghezza (1998) Regional Integration and Growth in Developing Nations. -RXUQDO RI (FRQRPLF ,QWHJUDWLRQ 13 (3), pages 367-399.
Baldwin, R. and A. Venables (1995) Regional Economic Integration. +DQGERRN RI ,QWHUQDWLRQDO (FRQRPLFV, vol. III. (G. Grossman and K. Rogoff Eds.), pages 1597-1644.
Barro, R. (1991) Economic Growth in a Cross-section of Countries. 4XDUWHUO\ -RXUQDO RI (FRQRPLFV, CVI, 2, pages 407-443.
Bisang, R. and G. Gomez (1999) Las Inversiones en la Industria Argentina en la Década de los Años Noventa. &(3$/ 'RFXPHQWRGH7UDEDMR LC/BUE/R. 239, Buenos Aires.
Blomström, M. and A. Kokko (1997) Regional Integration and Foreign Direct Investment: A Conceptual Framework and Three Cases. 3ROLF\5HVHDUFK:RUNLQJ3DSHU 1750. The World Bank.
Borensztein, E., J. De Gregorio and J-W. Lee (1998) How does foreign direct investment affect economic growth?
Brülhart, M. (1994) Marginal Intra-Industry Trade: Measurement and Relevance for the Pattern of Industrial Adjustment. :HOWZLUWVFKDIWOLFKHV$UFKLY 130 (3), pages 600-613.
Calfat, G. and R. G. Flôres Jr. (1996) Latin American Option for the European Union. Integration and Specialization, Coimbra, pages 311-329.
Coe, D.T. and E. Helpman (1995) International R&D Spillovers. (XURSHDQ(FRQRPLF5HYLHZ. 39, 5, pages 859-887. Curi, G. N. (1999) Areas Comerciales Preferenciales: Evaluación Comercial del Mercosur. Online. Internet.
www.aaep.org.ar/espa/anales/98-99.htm#rosario.
Diao, X., T. Roe and E. Yeldan. (1999) Strategic policies and growth: an applied model of R & D-driven endogenous growth. -RXUQDORI'HYHORSPHQW(FRQRPLFV 60, pages 343-380.
De Long and L. Summers (1991) Equipment Investment and Economic Growth. 4XDUWHUO\-RXUQDORI(FRQRPLFVpages 445-502.
Feenstra, R., Dorsati M., Tzu-Han Y. and Chi-Yuang L. (1999) Testing endogenous growth in South Korea and Taiwan.
-RXUQDORI'HYHORSPHQW(FRQRPLFV 60, pages 317-341.
Flôres, R. G. Jr. (1997) The Gains From MERCOSUL: A general Equilibrium, Imperfect Competition Evaluation.
-RXUQDORI3ROLF\0RGHOLQJ 19 (1), pages 1-18.
Grossman, G. and E. Helpman (1991) ,QQRYDWLRQDQG*URZWKLQWKH*OREDO(FRQRP\. Cambridge, Mass. MIT Press. Grosz, F. A. (1998) Un estudio del crecimiento en el sector transable de la economía argentina: 1970-1997. Online.
Internet. www.aaep.org.ar/espa/anales/98-99.htm#rosario
Hinojosa, R., Lewis and S. Robinson (1997) Simon Bolivar Rides Again? Pathaways Toward Integration between NAFTA, MERCOSUR and the Greater Andean Region. ,QWHJUDWLRQDQG7UDGH January-April (1), pages 95-122. INTAL (1997) ,QIRUPH0(5&2685. Año 2, No 3. Julio-Diciembre. Buenos Aires.
International Monetary Fund (1999) ,QWHUQDWLRQDO)LQDQFLDO6WDWLVWLFV<HDUERRN. Vol. LII. Washington, D.C.
Izam, M (1998) Estructura y nivel del arancel externo del Mercado Comun del Sur (MERCOSUR). &(3$/'RFXPHQWR GH7UDEDMR LC/R. 1800, Santiago de Chile.
Kehoe, T. J. (1994) Assessing the Economic Impact of North American Free Trade. In 7KH1$)7$'HEDWH*UDSSOLQJ ZLWK 8QFRQYHQWLRQDO 7UDGH ,VVXHV (M. Delal Bayer and Sidney Weintraub Eds.), pages 3-33. Lynne Rienner Publishers, London.
Lee, J-W (1993) International Trade, Distortions and Long Run Growth. ,0)6WDII3DSHUV, 40, 2, pages 299-328
Lee J-W (1994) Capital Goods Imports and Long Run Growth. 1%(5:RUNLQJ3DSHU. N° 4725.
Levine R. and D. Renelt (1992) A Sensitivity Analysis of Cross-country Growth Regressions. $PHULFDQ (FRQRPLF 5HYLHZ82, 4, pages 942-963.
Martinez, R., P. Lavarello and D. Heymann (1998) Inversiones en la Argentina: Aspectos macroeconomicos y analisis de los equipos importados. Online. Internet. www.aaep.org.ar/espa/anales/98-99.htm#rosario
Meloni, O. (1998) Algunas Estimaciones del Producto Potencial de Argentina. Online. Internet. www.aaep.org.ar/espa/anales/98-99.htm#rosario
Ministry of Economy (1999) La Inversion Extranjera Directa en Argentina 1992-1998. Direccion Nacional de Cuentas Internacionales. Online. Internet. www.mecon.ar/cuentas/internacionales/default1.htm
Ministry of Economy (1999) Informe Economico. Año 8, Numero 30, Buenos Aires.
Ministry of Economy (1994) Informe Economico. Año 2, Numero 8, Buenos Aires.
Oliveras, J. and I. Terra (1997) Marginal Intra-Industry Trade Index: The Period and Aggregation Choice.
:HOWZLUWVFKDIWOLFKHV$UFKLY 133 (1), pages 170-178.
Reca, A. (1998) Acumulacion de Capital en un Modelo de Equilibrio General: Una Aplicación para Argentina. Online. Internet. www.aaep.org.ar/espa/anales/98-99.htm#rosario
Rivera-Batiz, L. and P. Romer (1991) Economic integration and endogenous growth. 4XDUWHUO\-RXUQDORI(FRQRPLFV. Vol. 106, pages 531-555.
Rutherford F. and Tarr D. (1998) Trade Liberalization and Endogenous Growth in a Small Open Economy 3ROLF\ 5HVHDUFK3DSHU, n° 1970, World Bank.
United States International Trade Commission (1993) 7KH'\QDPLF(IIHFWVRI7UDGH/LEHUDOL]DWLRQ$6XUYH\. USITC Publication 2608, Investigation No. 332-324. Washington.