KLEIBE DE MORAES SILVA
META-ANALYSIS OF DATA FROM QUANTITATIVE TRAIT LOCI MAPPING STUDIES ON PIG CHROMOSOME 4
Thesis presented to the Animal Science Graduate Program of the Federal University of Viçosa in partial fulfillment of the requirements for degree of Doctor Scientiae.
VIÇOSA
KLEIBE DE MORAES SILVA
META-ANALYSIS OF DATA FROM QUANTITATIVE TRAIT LOCI MAPPING STUDIES ON PIG CHROMOSOME 4
Thesis presented to the Animal Science Graduate Program of the Federal University of Viçosa in partial fulfillment of the requirements for degree of Doctor Scientiae.
“Great ambition and conquest without contribution is without significance. What will your contribution be?”
To
My wife Lívia
ACKNOWLEDGEMENTS
Firstly, I would like to thank God for the care and comfort in every moment and for giving me strength to finish this study.
Special thanks are also owed to:
National Research Council for Development (CNPq) and Foundation for the Coordination of High Education and Graduate Training (CAPES) for the financial support.
Federal University of Viçosa (UFV), in special to the Animal Science Department (DZO), for the opportunity of carrying out the course.
Wageningen University (WUR), through the Animal Breeding and Genomics Centre (ABGC) for receiving me, supporting and providing me with the necessary infrastructure for performing part of the analysis of this thesis during the Sandwich Program.
Professor Paulo Sávio Lopes, my adviser at Federal University of Viçosa (UFV), Brazil, for his excellent supervision, competence, teachings and friendship.
Professor Simone Eliza Facioni Guimarães, from Federal University of Viçosa (UFV), Brazil, for her valuable teachings, patience and friendship.
Professor Johan van Arendonk, my adviser at Wageningen University (WUR), The Netherlands, for his excellent suggestions and constructive criticism.
Post-Doc student John Bastiaansen, from Wageningen University (WUR), The Netherlands, for his experience and valuable help in every moment, contributing with many suggestions.
Evgeney Kamevar, from the Russian Research Institute of Veterinary Genetics and Selection, Russia, for his help in the analysis.
PigQTLdb for providing the necessary data to perform the meta-analysis. My colleagues Miguel, Nicola, André, Carlos, Lucas, Renata, Marcos, Débora, Bruna, Ana Paula, Príscila and Katiene, from LABTEC (Animal Biotechnology Laboratory), for their companionship, continuous knowledge and learning exchange, and for the laughter that made the workplace always pleasant.
My friends from ABU (International Christian Fellowship), for all good moments and for the support.
My parents, Ilton and Maura, and my brother Dérsio, for the encouragement and to believe in my capacity. Thank you for letting me find my own way and always supporting me. You are always there if I need you and that means a lot to me.
BIOGRAPHY
Kleibe de Moraes Silva, son of Ilton Rodrigues da Silva and Maura de Moraes Silva, was born on August 14th, 1978, in Dom Aquino, Mato Grosso State, Brazil.
In 1997, he entered the Federal University of Viçosa, graduating in Animal Science in August 2003.
In 2005, he got his Master’s Degree in Genetics and Breeding from Federal University of Viçosa.
In September 2005, he started his PhD course in Animal Science at Federal University of Viçosa. He worked for 12 months at Wageningen University (WUR), The Netherlands, in a Sandwich Program.
CONTENTS
RESUMO ………... viii
ABSTRACT ………... x
CHAPTER 1 - GENERAL INTRODUCTION ….………... 01
References ...……… 05
CHAPTER 2 - MAPPING QUANTITATIVE TRAIT LOCI ON PIG CHROMOSOME 4 ……… 07
Abstract ………. 07
Introduction ……….. 07
Material and Methods ………. 08
Results ……….. 11
Discussion ……… 13
References ...……… 18
CHAPTER 3 - META-ANALYSIS OF RESULTS FROM QUANTITATIVE TRAIT LOCI MAPPING STUDIES ON PIG CHROMOSOME 4 ………… 22
Abstract ………. 22
Introduction ……….. 22
Material and Methods ………. 24
Results ……….. 26
Discussion ……… 32
References ...……… 37
CHAPTER 4 - GENERAL DISCUSSION ..……… 44
RESUMO
SILVA, Kleibe de Moraes, D.Sc., Universidade Federal de Viçosa, novembro de 2009. Meta-análise de dados a partir de estudos de mapeamento de locos de características quantitativas no cromossomo 4 de suínos. Orientador: Paulo Sávio Lopes. Co-Orientadores: Simone Eliza Facioni Guimarães e Robledo de Almeida Torres.
ABSTRACT
SILVA, Kleibe de Moraes, D.Sc., Universidade Federal de Viçosa, November, 2009. Meta-Analysis of Data from Quantitative Trait Loci Mapping Studies on Pig Chromosome 4. Adviser: Paulo Sávio Lopes. Co-Advisers: Simone Eliza Facioni Guimarães and Robledo de Almeida Torres.
CHAPTER 1
General Introduction
Many traits of economical importance in livestock species are
quantitative. In quantitative traits, both genetic and environmental factors
contribute to the variation observed in animal populations. The genetic
component of variation has been widely modeled assuming a large number of
genes of small effect influenced by the environment (Anderson, 2001).
However, according to Lande (1981), some genes may account for a relatively
large proportion of the phenotypic variation. The identification of these genes
based only on conventional phenotype evaluation is not possible and the
development of genetic markers from the 1980s created opportunities for the
construction of linkage maps utilized for identifying chromosomal regions
controlling those quantitative traits. Such a chromosomal region harboring
genes that influence the variation is referred to as quantitative trait loci (QTL)
(Gelderman, 1975). Unlike qualitative traits, which the phenotypic values show
distinct classes, the quantitative traits are characterized by a continuous
variation of phenotypic values.
Advances in molecular biology techniques and the rapid development of
DNA markers facilitated the development of comprehensive linkage maps of
several livestock species. Genetic markers represent genetic differences
between individual organisms or species. Generally, they do not represent the
target genes themselves but act as ‘signs’ that are located in close proximity to
genes controlling the traits (Collard et al., 2005). Genes and markers that are
close together or tightly-linked will be transmitted together from parent to
progeny more frequently than genes and markers that are located further apart.
The crucial idea is that observed marker genotypes can be used to obtain
indirect information on the genotype at a target gene. By using molecular
markers it is possible to map the region with effects on the quantitative traits to
specific chromosomal segment in the genome by using a mapping population,
which maximizes the chance to have such genes segregating. However, the
diversity between the parental strains, heritability of the trait, the number of
animals in the population with genotypic and phenotypic information, and the
density of informative genetic markers (Kao and Zeng 1997). In general,
experimental populations for QTL mapping are comprised of intercrosses of
phenotypically divergent founders. In this type of population it is presumed that
the genes influencing the trait of interest are fixed enabling the identification of
QTL regions that explains the genetic differences between populations.
Otherwise, a large population is necessary to detect QTL with small effects, like
those present in commercial populations.
Several agricultural species have received great attention because of
potential benefits in detecting and identifying QTL and using them in
marker-assisted breeding programs. The pig is one of the most important livestock
species worldwide and information about genes involved in several traits of
economical importance could lead to an improvement in quantity and quality of
the meat produced. Since the first successful large QTL analysis in pigs
conducted by Andersson et al. (1994), a large number of studies has been
published with QTL for growth, carcass, meat quality, reproduction, disease
resistance and other traits (Bidanel and Rothschild, 2002).
In many cases, there are several studies where QTL have been identified
for the same trait on the same chromosome. Usually, the position of the
detected QTL on a region or a chromosome does not coincide among different
studies. In some cases, however, the QTL identified for a particular trait are
found in the same region and have overlapping confidence interval which could
indicate the existence of a common QTL or multiple tightly linked QTL. To find
the causative mutations underlying these QTL is a huge challenge because for
most detected QTL the identified chromosomal regions are still large and harbor
hundreds of genes. Typically, the QTL support interval ranges from 20 to 40 cM.
To narrow down these regions to the gene is necessary and investigators often
encounter difficulty in obtain better results. Adding markers is helpful but
resolution is fundamentally limited by the number of recombination events in the
cross population. As a result, only few QTL have been characterized at the
gene level and implemented in the pork industry (Dekkers, 2004). The reason
for low precise estimates is multicausal, but in general, large variation may
using small population size (Guo et al., 2006). In order to increase the power
and resolution in QTL detection it is necessary to increase the population size,
even though such measure is an expensive proposition.
Although increases the power in detecting QTL, most of time it is not
possible to obtain larger population size, mainly because most of the
populations used in QTL mapping studies no longer exist. As a result the
investigators have to use the data that already exist and an option is to pool the
data in a single study and perform the analysis. In the meta-analysis, the results
of detected QTL from a variety of mapping studies are combined in a single
study and re-analyzed.
Meta-Analysis Approach
Over the past decade, several resource populations have been
established to detect QTL for traits of economic importance in pigs using breed
crosses and, in some cases, commercial populations. Although each population
allows independent identification of QTL, they are often of limited size, which
restricts the statistical power and accuracy of QTL identification. It has been
suggested that the pooling of results across linkage studies allows for a more
precise estimation of QTL position, hence, such approach yields conclusions
that are stronger relative to those single studies with low statistical power
(Lander and Kruglyak, 1995). The approach to combine results from different
studies in a single one is termed meta-analysis and it is recommended in
situations where only summary information is available and not the data source.
Meta-analysis, first mentioned by Glass (1976), is a statistical analysis
combining results from many sources in a single study. This technique was
firstly used by researchers in medical, social and behavioral sciences, and
offers considerable potential to extract additional information from the combined
results. Meta-analysis can provide a more precise and consensual estimate of
the location of a QTL and its effects as compared with any individual study.
The meta-analysis approach combines relevant evidence of QTL
estimates from many studies in a single one. Meta-analysis adds a degree of
precision and significance to the final results, since only assumed true QTL are
detected QTL may represent a type I error which may reduce the accuracy of
the QTL estimates. However, the increasing availability of information can lead
to rejection of type I error, thus reducing the false discovery rate (Wacholder et
al., 2004). By using meta-analysis it is possible to check whether the detected
QTL represent several different QTL close linked or several estimates of the
same QTL. One of the great benefits of meta-analysis is to increase the sample
size, thus increasing the power in QTL detection. The larger the population, the
more accurate is the mapping study and the more likely is the detection of
smaller effects QTL (Haley and Andersson, 1997). This is really important, since
many genes of small effects are involved in complex traits. In addition,
meta-analysis can reduce the confidence interval of the detected QTL. The
confidence interval of a QTL is inversely proportional to population size and
QTL effects (Visscher et al., 1996; Darvasi and Soller, 1997; Roberts et al,
1999; Bennewitz et al., 2002), so large confidence interval occurs when a QTL
has a small gene effect or when small population size is used. In practice, the
confidence interval is important since it determines the potential for further
experiments to close on QTL, mainly because smaller confidence interval
increases the efficiency in selecting candidate genes.
Disadvantages of meta-analyses involve study heterogeneity, which can
include differences in marker density, linkage maps, sample sizes, experimental
designs, as well as statistical methods used. Environmental effects also make
meta-analysis more difficult. Although all studies are not identical, they show
some similarities that can be used to connect them. More recently, Etzel and
Guerra (2003) developed an approach to overcome the heterogeneity among
studies and to refine QTL location. This approach makes possible to combine
information from several studies to obtain a consensus linkage map since
several linkage maps have been produced to the same species. Such an
assessment may be used as a primary study in selecting candidate genes for
follow up investigations.
To perform a meta-analysis is necessary that some information needs to
be available on published papers. Information such as type of population
design, number of animals measured, genetic markers, phenotypic variances
References
Anderson L. 2001. Genetic dissection of phenotypic diversity in farm animals.
Nat Rev Genet 2, 130-138.
Andersson l., Haley C.S., Ellegren H., Knott S.A., Johansson M.K., Andersson
K., Andersson-Eklund l., Edfors-Lilja I., Fredholm M., Hansson I.,
Hakansson J., Lundström K. 1994. Genetic mapping of quantitative trait
loci for growth and fatness in pigs. Science 263, 1771-1774.
Bennewitz J., Reinsch N., Kalm E. 2002. Improved confidence intervals in
quantitative trait loci mapping by permutation bootstrapping. Genetics
160, 1673-1686.
Bidanel J.P. and Rothschild M. 2002. Current status of quantitative trait locus
mapping in pigs. Pig News Info23, 39-54.
Collard B.C.Y., Jahufer M.Z.Z., Brouwer J.B., Pang E.C.K. 2005. An
introduction to markers, quantitative trait loci (QTL) mapping and
marker-assisted selection for crop improvement: The basic concepts. Euphytica
142, 169-196.
Darvasi A. and Soller M. 1997. A simple method to calculate resolving power
and confidence interval of QTL map location. Behav Genet27, 125-132.
Dekkers J.C.M. 2004. Commercial application of marker- and gene-assisted
selection in livestock: Strategies and lessons. J Anim Sci82, E313-328.
Etzel C.J. and Guerra R. 2002. Meta-analysis of genetic-linkage analysis of
quantitative-trait loci. Am J Hum Genet71(1), 56-65.
Geldermann H. 1975. Investigations on inheritance on quantitative characters in
animals by gene markers. I. Methods. Theoretical and Applied
Genetics46, 319-330.
Glass G.V. 1976. Primary, secondary, and meta-analysis of research.
Guo B., Sleper D.A., Lu P., Shannon J.G., Nguyen H.T., Arelli P.R. 2006. QTLs
Associated with Resistance to Soybean Cyst Nematode in Soybean:
Meta-Analysis of QTL Locations. Crop Sci46, 595-602.
Haley C. and Andersson L. 1997. Linkage mapping of quantitative trait loci in
plants and animals, pp. 49-71. In: P. Dear (Ed.), Genome mapping: A
practical approach, Oxford University Press, New York.
Kao C.H. and Zeng Z.B. 1997. General formulae for obtaining the MLEs and the
asymptotic variance-covariance matrix in mapping quantitative trait loci
when using the EM-algorithm. Biometrics 53, 653-665.
Lande R. 1981. The minimum number of genes contributing to quantitative
variation between and within populations. Genetics121, 185-199.
Lander E.S. and Kruglyak L. 1995. Genetic dissection of complex traits:
guidelines for interpreting and reporting linkage results. Nat Genet 11,
241-247.
Roberts S.B., Maclean C.J., Neale M.C., Eaves L.J., Kendler K.S. 1999.
Replication of linkage studies of complex traits: An examination of
variation in location estimates. Am J Hum Genet65, 876-884.
Visscher P.M., Thompson R., Haley C.S. 1996. Confidence intervals in QTL
mapping by bootstrapping. Genetics143, 1013-1020.
Wacholder S., Chanock S., Garcia-Closas M., El Ghormli L., Rothman N. 2004.
Assessing the probability that a positive report is false: an approach for
CHAPTER 2
Mapping of quantitative trait loci on pig chromosome 4
Abstract – A three-generation resource family was developed by using two
Piau grand sires and 18 commercial grand dams to detect QTL for growth,
carcass and meat quality traits in pigs. A total of 627 F2 progeny from 66 F1
matings was produced. All F2 animals were phenotyped and genotyped for six
microsatellite markers covering the porcine chromosome 4. The data were
analyzed by multiple regressions developed for the analysis of crosses between
outbred lines using the QTL Express software. In total, three genome-wide
significant and eight chromosome-wide significant QTL were detected. Each
QTL explained from 1.3% to 7.7% of the phenotypic variance of the traits. Gene
action for most QTL was additive. For most detected QTL involved economical
traits, the Piau alleles had significant unfavorable effects on the phenotypic
values. The results show that there are genes on chromosome 4 with a
considerable effect on several economical important traits in pigs.
Introduction
Knowledge of the genome and the establishment of genetic maps are
fundamental for the isolation and characterization of genes of interest
(Rothschild and Plastow, 1999). Genetic markers spread across the animal
genome are used for the mapping of regions that influence important traits. An
appropriate population design is necessary for this purpose, such as the
crossing of two lines that differ in the trait studied. It is assumed that in this type
of population alternative alleles are fixed in the two lines. Adequate statistical
methods then permit the identification of the position and estimation of the effect
of the quantitative trait locus (QTL) on growth, carcass, meat quality and
reproductive traits (Bidanel and Rothschild, 2002).
The Brazilian native pig breed Piau is originated from breeds introduced
by Portuguese settlers in the XVI century and has also some influence of Dutch
animals are rusticity, adaptability to poor conditions of management and
feeding, and a great resistance to diseases. This pig breed is further
characterized by low performance, small litter size, and especially large
accumulation of subcutaneous fat (Guimarães and Lopes, 2001).
Pig is one the most extensively studied commercial species. Different
QTL have been mapped in several crosses of various breeds, and it is of
fundamental interest to know whether similar effects are present in other
crosses and, mainly, in commercial populations (Walling et al., 1998). Once the
genes and markers have been validated, these data can be used together with
traditional methods in marker-assisted selection to improve the efficiency of
breeding programs. Another possibility with a potential to improve breeding
programs is the introgression of genes of interest from different breeds. The
objective of the present study was to map QTL associated with growth, carcass,
carcass cut and internal organ traits on swine chromosome 4 in an F2
population obtained by crossing divergent lines.
Material and Methods
The three-generation resource family was developed at the Pig Breeding
Farm of the Department of Animal Science, Federal University of Viçosa (UFV),
Viçosa, Minas Gerais State, Brazil. A full description of the line cross
population, the phenotypes measurements and the DNA extraction procedures
can be found elsewhere (Band et al., 2005a and 2006b; Faria et al., 2006;
Peixoto et al., 2006).
The animals were genotyped using six microsatellite markers (SW489,
S0301, S0001, S0217, S0073 and SW58), whose description and specifications
are shown in Table 1. The PCR products were submitted to fragment analysis in
an ABI PRISM 310 automatic sequencer (Applied Biosystems) and the
amplified fragments were classified using the GENESCAN program (Applied
Biosystems). The expected heterozygosity and polymorphic information content
(PIC) were calculated with the CERVUS v.3.0 program (Marshall et al., 1998).
Multipoint linkage analyses were carried out for males, females and both sexes
units were then converted into map distances using the Haldane mapping
function. The linkage map was constructed using the “build” option.
Table 1 – Markers used for the mapping of swine chromosome 4.
Primer Position 1 Fluorophore T (ºC)2
SW489 0.0 HEX 55
S0301 31.8 FAN 58
S0001 59.1 HEX 50
S0217 102.8 FAN 62
S0073 123.4 HEX 56
SW58 161.9 TET 58
1
Position in cM; 2 Annealing Temperature in ºC. Reaction condition : Taq polimerase 1 U, dNTPs 0.2 mM, primers forward and reverse 0.2 M each, Tris-HCl pH 8.3 20mM, KCl 50 mM, MgCl2(2 to 4 mM), genomic DNA 25 ng/L. The final volume was 20 L. The PCR fragments were electrophoresed on 8% polyacrylamide gels.
QTL were mapped in the F2 population with the QTL Express program
(Seaton et al., 2002) (http://www.qtl.cap.ed.ac.uk) using the average map. The
statistical model assumed that the QTL is diallelic, with alternative alleles being
fixed in each parental breed (Haley et al., 1994). Genotype QQ was defined as the homozygous genotype of the naturalized Brazilian Piau breed, with effect
a, genotype qq was defined as the homozygous genotype of the commercial breed, with effect –a, and Qqwas defined as the heterozygous genotype, with effect d. The probability of each F2 individual showing each of the three QTL genotypes was calculated according to the genotypes of the markers at
intervals of 1 cM along the chromosome. The additive fraction of F2
phenotypic variance explained by a QTL was computed in each breed; i.e.,
2 2 2 2 / y Q a
h , as described by Pérez-Enciso et al. (2000).
The following statistical model was adopted:
ijkl d a ijkl k j i
ijkl S L H (C C)b c a c d e
y
where
Yijkl= phenotype;
Si= fixed effect of sex i, i = 1, 2;
Lj= fixed effect of batch j, j = 1, 2, 3, 4, 5;
b
C
C
ijkl)
(
= adjustment for covariables (carcass weight for carcasstraits, and cold right side weight for cut traits);
eijkl= residual errors.
Aditive (ca) and dominance (cd) coefficients for a QTL were calculated
from the genotypic probabilities under the assumption that two breeds were
fixed for alternative alleles as follows:
)
|
(
)
|
(
Mi
P
Mi
P
c
a
)
|
(
Mi
P
c
d
Where:
)
|
(
Mi
P
= conditional probability that the QTL are homozygous andoriginated from the Brazilian naturalized breed;
)
|
(
Mi
P
= conditional probability that the QTL are homozygous andoriginated from the commercial breed;
)
|
(
Mi
P
= conditional probability that the QTL are heterozygous.The previous model was fitted every centimorgan, regressing the
phenotypes onto the coefficients ca and cd. At each location an F ratio was
calculated comparing the model with a QTL to the equivalent model without
QTL. Estimates for a and d were calculated at the best estimated position with the highest F-ratio. The chromosome-wide significance levels (= 0.05 or 0.01)
were determined by a permutation test using the QTL Express software
(Churchill and Doerge, 1994), for a total of 10000 permutations for each trait.
Confidence intervals (CI) for QTL location were obtained as suggested by
Pérez-Enciso et al. (2000) using the chi-square drop approximation (equivalent
to the LOD score drop approximation). An F-statistic is equal to χ2P/p,
approximately, where p is the number of parameters estimated, here two, the
additive and dominance effects. The 95% threshold is χ22, 95 = 3.85. Thus, the
95% confidence interval limits were obtained at the chromosome locations
where the F-statistics decreased 3.85/2 = 1.92 units starting in both directions
from the position corresponding to the maximum F.
Genome-wide thresholds were obtained applying the Bonferroni
(2000). Suppose that a given value F corresponds to a chromosome
significance level Pc, the genome significance level associated is given by PG =
1- (1-Pc)19; 19 is the haploid number of pig chromosomes. This formula
assumes lengths and marker spacing in all chromosomes are identical so that
results are to be taken only as approximate.
Results
The distance covered by the linkage map of chromosome 4 using the six
markers was 161.9 cM on the sex averaged map. The spacing between
adjacent markers ranged from 20 to 43 cM, and the average marker interval
was approximately 32 cM. The size of the map agrees with those reported in
the literature, ranging from 130.1 cM (USDA-MARC.2; Rohrer et al., 1996) to
165.0 cM (PiGMaP.1; Archibald et al., 1995). No change in the order of the
markers was observed, in agreement with other studies (Walling et al., 1998;
Gerbens et al., 2000). Table 2 summarizes the characteristic of the
microsatellite markers used for the mapping of porcine chromosome 4. The PIC
calculated for the parental and F1 generations were low, a finding that might be
due to the small number of alleles segregating in this population. However,
Botstein et al. (1980) classified markers with a PIC of 0.25 to 0.5 as moderately
polymorphic (SW489, S0217 and SW58) and markers with a PIC higher than
0.5 as highly polymorphic (S030, S001 and S0073) and, therefore, both classes
are suitable for mapping.
Table 2 – Microsatellite markers used for the mapping of swine chromosome 4.
Marker Position 1 PIC 2 HExp.3 HObs.4 No. of alleles
SW489 0.0 0.32 0.58 0.68 3
S0301 31.8 0.50 0.52 0.56 3
S0001 59.1 0.50 0.60 0.60 3
S0217 102.8 0.41 0.57 0.73 3
S0073 123.4 0.64 0.71 0.75 6
SW58 161.9 0.42 0.56 0.69 4
1
All the QTL that exceeded the threshold for chromosome and
genome-wide significance in the analyses are reported. Most of them was identified
within an interval of approximately 90 to 135 cM on the chromosome. The
additive fraction of F2 phenotypic variance explained by a QTL ranged from 1.3
(HW) to 7.7% (W77). Table 3 shows the maximum likelihood ratios (Fmax) and
positions (cM) of the QTL found in the present study and the respective
estimates of additive and dominance effects. The chromosome-wide 5% and
1% significance threshold were 4.86 and 6.60, respectively. The 5% and 1%
genome-wide statistics were 8.06 and 9.46, respectively.
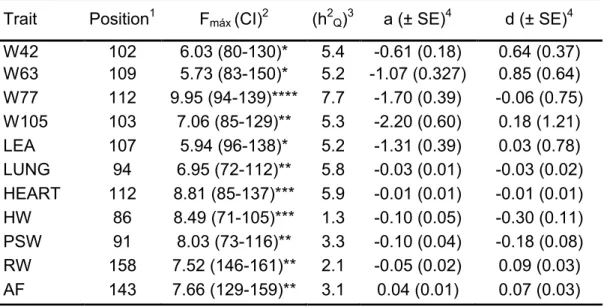
Table 3 – Summary of the QTL position (cM), maximum likelihood ratios (Fmax),
phenotypic variance in the F2 explained by the QTL (h2Q) in percentage and the
respective estimates of additive and dominance effects.
Trait Position1 Fmáx (CI)2 (h2Q)3 a (± SE)4 d (± SE)4
W42 102 6.03 (80-130)* 5.4 -0.61 (0.18) 0.64 (0.37)
W63 109 5.73 (83-150)* 5.2 -1.07 (0.327) 0.85 (0.64)
W77 112 9.95 (94-139)**** 7.7 -1.70 (0.39) -0.06 (0.75)
W105 103 7.06 (85-129)** 5.3 -2.20 (0.60) 0.18 (1.21)
LEA 107 5.94 (96-138)* 5.2 -1.31 (0.39) 0.03 (0.78)
LUNG 94 6.95 (72-112)** 5.8 -0.03 (0.01) -0.03 (0.02)
HEART 112 8.81 (85-137)*** 5.9 -0.01 (0.01) -0.01 (0.01)
HW 86 8.49 (71-105)*** 1.3 -0.10 (0.05) -0.30 (0.11)
PSW 91 8.03 (73-116)** 3.3 -0.10 (0.04) -0.18 (0.08)
RW 158 7.52 (146-161)** 2.1 -0.05 (0.02) 0.09 (0.03)
AF 143 7.66 (129-159)** 3.1 0.04 (0.01) 0.07 (0.03)
*p < 0.05 chromosome-wide significance; **p < 0.01 chromosome-wide significance; ***p < 0.05 genome-wide significance; ****p < 0.01 genome-wide significance; 1 QTL averaged position in centimorgan (cM);2 Confidence interval in centimorgan (cM); 3 Phenotypic variance explained by a QTL;4Standard Error; W42 – weight at 42 days of age (kg); W63 – weight at 63 days of age (kg); W77 – weight at 77 days of age (kg); W105 –weight at 105 days of age (kg); LEA – loin eye area; LUNG – lung weight; HEART –heart weight; HW – skinless and fatless ham weight (kg); PSW – skinless and fatless picnic shoulder weight (Kg) ; RW – Rib weight (kg); AF – abdominal fat (kg).
Four significant QTL were identified for growth traits (Table 3 and Figure
1), being P<0.05 wide for W42 and W63, P<0.01
carcass traits, being P<0.05 chromosome-wide LEA (Table 3 and Figure 2), and
P<0.01 chromosome-wide for PSW, RW and AF, and P<00.5 genome-wide for
HW (Table 3 and Figure 3). Regarding to internal organs traits, a QTL was
observed for HEART (P<0.05 genome-wide) and for LUNG (P<0.01
chromosome-wide) (Table 3 and Figure 3). A more detailed description of all
these QTL is provided on Table 3.
Figure 1 - Estimates of the F ratio for weight at 42 days of age (W42); weight at 63 days of age (W63); weight at 77 days of age (W77); weight at 105 days of age (W105) The horizontal lines indicate the levels of significance chromosome-wide (5% = continuous line, 1% = dashed line) and genome-chromosome-wide (5% = dotted line and 1% = dot-dashed line).
Discussion
The first genome scan in pigs for QTL used a Wild boar x Large White
cross (Anderson et al., 1994) and revealed significant effects of QTL on growth,
length of small intestine, average backfat depth and abdominal fat percentage
on chromosome 4. QTL for fat deposition and growth located on pig
chromosome 4 has also been found in other crosses e.g., Chinese Meishan vs.
Large White (Walling et al., 1998; Bidanel et al., 2001), Iberian vs. Landrace
(Perez-Enciso et al., 2000; Mercandé et al., 2005) as well as in crosses of
Furthermore, a joint analysis comprising almost 3000 animals from seven
different F2 crosses provided overwhelming statistical support for QTL affecting
fatness and growth on SSC4 (Walling et al., 2000). To a certain extent, the
results obtained in the present study agree with previous findings. For traits
related to growth, four QTL were detected in the region between markers S0217
and S0073 (figure 1). Although the growth measures were obtained in different
ages (42, 63, 77 and 105 days), the identified QTL were located in the same
region and they may constitute a single gene or a cluster of linked genes each
with similar mode of action on growth. Similar results were obtained by Bidanel
et al. (2001) that detected QTL for weight at 10, 13, 17 and 22 weeks. It is worth
to note that alleles inherited from the commercial breed were associated with
heavier pigs (Table 3), demonstrating the contribution of commercial alleles to
the development of these traits. These results were expected since Piau breed
is characterized by low performance, small litter size, and especially large
accumulation of subcutaneous fat (Guimarães and Lopes, 2001).
Favourable (i.e. positive) effects on growth are generally, but not
systematically associated with favourable (i.e. negative) effects on backfat
thickness (Bidanel et al., 2001). It is not surprising that evidence of a QTL on
chromosome 4 for backfat thickness was not detected in this study. The first
QTL reported in pigs was located in chromosome 4 (Andersson et al. 1994)
and, despite the high variability of QTL studies, the porcine chromosome 4 QTL
affecting fatness and/or growth stands as one of the most repeatable results. It
has been confirmed in most if not all successive studies (Knott et al. 1998;
Walling et al. 1998; Wang et al. 1998; Paszek et al. 1999; Pérez–Enciso et al.
2000; Walling et al. 2000; Bidanel et al. 2001; De Koning et al. 2001; Milan et al.
2002). The main effect reported initially was on fatness; this locus was named
FAT1 after Marklund et al. (1999), but other studies found that it affected mostly
growth (De Koning et al. 1999; Rattink et al., 2000). In this study we found
highly evidence for QTL affecting growth traits, but only one QTL related to
fatness (abdominal fat). The low association may indicate that locus affecting
fatness in the Piau breed did not differ from the commercial line, or the study
was not large enough to detect additional fat QTL.
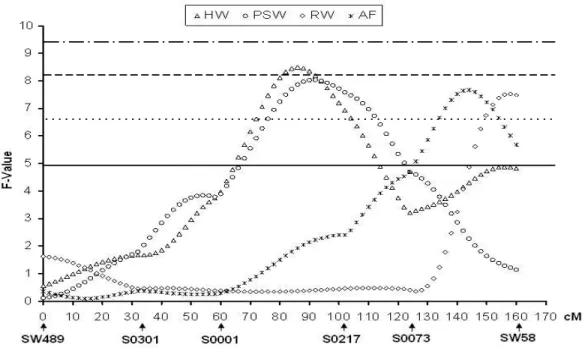
QTL for ham weight (HW) and picnic shoulder weight (PSW) (Figure 3)
were identified between the S0001 and S0217 markers, at the position 86 and
91 cM, respectively. Both detected QTL had similar effects and the allele
inherited from Piau breed was responsible for decrease the phenotypic values.
These QTL may represent either a common QTL with pleiotropic effects or
represent two or more linked QTL. The QTL for PSW was found in the same
region by Mercandé et al. (2005) and interesting result was that Estellé et al.
(2006) found a strong association of a single nucleotide polymorphism (SNP) on
FABP5 gene in shoulder weight and other traits. Geldermann et al. (2003)
observed the presence of QTL for HW and PSW at position 115 cM on SSC4 in
a cross between wild boar and Piétrain pigs. The QTL for HW and PSW were
responsible for 5.2% and 8.3% of the phenotypic variation. In our study the
alleles inherited from the naturalized Brazilian Piau breed were responsible for
Figure 3 – Estimates of the F ratio for loin eye (LEA), lung weight (LUNG) and heart weight (HEART). The horizontal lines indicate the levels of significance chromosome-wide (5% = continuous line, 1% = dashed line) and genome-wide (5% = dotted line and 1% = dot-dashed line).
A QTL was found to rib weight (RW) in the distal of the chromosome.
Only few studies have reported QTL for RW. On chromosome 4, Duthie et al.
(2008) identified a QTL when the imprinting effect was taken into consideration.
Other results have been found on chromosome 6 (Óvilo et al., 2005) and on
chromosome 8 (Vidal et al., 2005). Regarding to abdominal fat (AF), Walling et
al. (1994) detected a QTL in the proximal part of the chromosome 4, while in
this study the QTL to the same trait was located in the distal part of the
chromosome, at the position 143 cM (Figure 2). The estimate of the additive
effect for the AF 0.040 ± 0.01 and the QTL found was responsible for 3.1% of
the phenotypic variation, demonstrating the contribution of Piau alleles to the
phenotypic expression of this trait (Table 3).
QTL for LEA was identified between markers S0217 and S0073 at
position 107 cM (Figure 2). The additive effect of LEA was estimated to be -1.31
± 0.39, demonstrating that allele inherited by the Piau breed was associated
with a lower amount of muscling than the allele inherited from the commercial
lines. Pérez-Enciso et al. (2000) observed the presence of a QTL affecting loin
close to marker S0214, which is closely related to marker S0217, screened in
the present study. A suggestive QTL for eye muscle area in this region reported
by Wang et al. (1998) gives additional support to our results. LEA is a trait that
has been indirectly selected based on backfat thickness since a reduction in the
latter increases the former. However, we did not identified any QTL relate to
backfat thickness in this study.
Regarding to internal organ traits, a QTL for HEART was identified at 112
cM, and a QTL for LUNG was identified at 94 cM (Figure 3). Cepica et al.
(2003), studying various crosses, found a significant QTL for heart weight on
chromosome 4 at position 66 cM in animals originating from a cross between
wild European and Chinese Meishan pigs. It is hard to tell if these QTL are the
same, since the studies have used different markers, and even the average
map may show some differences.
The results of the present study show that most significant QTL are
present in common regions on swine chromosome 4, indicating that the same
gene (or genes) is controlling traits related to growth and carcass. The main
limitation was the poor precision of QTL mapping, with confidence intervals of
20-30 cM, complicating the identification of the causal mutation underlying the
QTL effect. Although further analyses and refining of QTL positions are in
progress, results of this study are useful in discovering potential QTL regions
and leading to further understanding of the role certain regions of the genome
have in determining phenotypic differences among potential parents for
selection of breeding animals. Our group keeps working on chromosome 4 and
on the other pig chromosomes to find more informative markers in such way
that a better association can be made to production traits. Further studies on
the QTL identified in this research need to be evaluated to determine if they
would be useful in commercial swine populations and to identify the genetic and
References
Andersson L., Haley C.S., Ellegren H., Knott S.A., Johansson M.K., Andersson K., Andersson-Eklund L., Edfors-Lilja I., Fredholm M., Hansson I., Hakansson J., Lundström K. 1994. Genetic mapping of quantitative trait loci for growth and fatness in pigs. Science263, 1771-1774.
Archibald A.L., Haley C.S., Brown J.F., Couperwhite S., Mcqueen H.A. 1995. The PiGMaP consortium linkage map of the pig (Sus scrofa). Mamm Genome6, 157-175.
Band G.O., Guimarães S.E.F., Lopes P.S., Peixoto J.O., Faria A.F., Pires A.V., Figueiredo F.C., Nascimento C.S., Gomide L.A.M. 2005a. Relationship between the Porcine Stress Syndrome gene and carcass and performance trait in F2 pigs resulting from divergent crosses. Genet Mol Biol 28, 92-96.
Band G.O., Guimarães S.E.F., Lopes P.S., Schierholt A.S., Silva K.M., Pires A.V., Benevenuto Júnior A.A., Gomide L.A.M. 2005b. Relationship between the Porcine Stress Syndrome gene and pork quality trait in F2 pigs resulting from divergent crosses. Genet Mol Biol28, 88-91.
Bidanel J.P. and Rothschild M. 2002. Current status of quantitative trait locus mapping in pigs. Pig news and Information23, 39-54.
Bidanel J.P., Milan D., Iannuccelli N., Amigues Y., Boscher M.Y., Bourgeois F., Caritez J.C., Gruand J., Le Roy P., Lagant H., Quintanilla R., Renard C., Gellin J., Ollivier L., Chevalet C. 2001. Detection of quantitative trait loci for growth and fatness in pigs. Genet Sel Evol33(3), 289-309.
Botstein D., White R.L., Skolnick M., Davis R.W. 1980. Construction of genetic linkage map in man using restriction fragment length polymorphisms. Am Jour Hum Genet 32, 314-331.
Cepica S., Stratil A., Kopecny M., Blaskova P., Schroffel J., Davoli R., Fontanesi L., Reiner G., Bartenschlager H., Moser G., Geldermann H. 2003. Linkage and QTL mapping for Sus Scrofa chromosome 4.J Anim Breed Genet 120, 28-37.
Churchill G.A. and Doerge R.W. 1994. Empirical threshold values for quantitative trait mapping. Genetics 138, 963-971.
De Koning D.J., Janss L.L., Rattink A.P., van Oers P.A., de Vries B.J., Groenen M.A.M., van der Poel J.J., de Groot P.N., Brascamp E.W., van Arendonk J.A.M. 1999. Detection of quantitative trait loci for back fat thickness and intramuscular fat content in pigs (Sus scrofa). Genetics152, 1679-1690.
quantitative trait loci for meat quality traits in pigs. J Anim Sci 79, 2812-2819.
Duthie C., Simm G., Doeschl-Wilson A., Kalm E., Knap P.W., Roehe R. 2008. Quantitative trait loci for chemical body composition traits in pigs and their positional associations with body tissues, growth and feed intake. Animal Genetics39, 130-140.
Estellé J., Pérez-Enciso M., Mercadé A., Varona L., Alves E., Sánchez A., Folch J.M. 2006. Characterization of the porcine FABP5 gene and its association with the FAT1 QTL in an Iberian by Landrace cross. Animal Genetics37, 589-591.
Evans G.J., Giuffra E., Sanchez A., Kerje S., Davalos G., Vidal O., Illan S., Noguera J.L., Varona L., Velander I., Southwood O.I., de Koning D.J., Haley C.S., Plastow G.S., Andersson L. 2003. Identification of quantitative trait loci for production traits in commercial pig populations. Genetics164(2), 621-627.
Faria D.A., Guimarães S.E.F., Lopes P.S., Pires A.V., Paiva S.R., Sollero B.P., Wenceslau A.A. 2006. Association between G316A growth hormone polymorphism and economic traits in pigs. Genet Mol Biol 29, 634-640.
Geldermann H., Muller E., Moser G., Reiner G., Artenschlager S., Cepica S., Stratil A., Kuryl J., Moran C., Davoli R., Brunsch C. 2003. Genome-wide linkage and QTL mapping in porcine F2 families generated from Piétrain, Meishan and Wild Boar crosses. J Anim Breed Genet120, 363-393.
Gerbens F., de Koning D.J., Harders F.L., Meuwissen T.H., Janss L.L., Groenen M.A.M., Veerkamp J.H., van Arendonk J.A.M., Te Pas M.F. 2000. The effect of adipocyte and heart fatty acid-binding protein genes on intramuscular fat and backfat content in Meishan crossbred pigs. J Anim Sci78(3), 552-559.
Green P., Falls K., Crooks S. 1990. Documentation for CRIMAP, St. Louis, Mo.: Washington Univ. School of Medicine.
Guimarães S.E.F. and Lopes P.S. 2001. Uso de Recursos Genéticos Nativos no Mapeamento Genético de Suínos. Ação Ambiental15(III), 27-28.
Haley C.S., Knott S.A., Elsen J.M. 1994. Mapping quantitative trait loci in crosses between outbred lines using least squares. Genetics 36, 1195-1207.
Marklund L., Nystrom P.E., Stren S., Andersson L. 1999. Confirmed quantitative trait loci for fatness and growth on pig chromosome 4. Heredity82, 134-141.
Marshall T.C., Slate J., Kruuk L., Pemberton J.M. 1998. Statistical confidence for likelihood-based paternity inference in natural populations. Molecular Ecology7, 639-655.
Mercade A., Estelle J., Noguera J.L., Folch J.M., Varona L., Silio L., Sanchez A., Perez-Enciso M. 2005. On growth, fatness, and form: a further look at porcine chromosome 4 in an Iberian x Landrace cross. Mamm Genome 16(5), 374-382.
Milan D., Bidanel J.P., Iannuccelli N., Riquet J., Amigues Y., Gruand J., Le Roy P., Renard C., Chevalet C. 2002. Detection of quantitative trait loci for carcass composition traits in pigs. Genet Sel Evol34, 705-728.
Nagamine Y., Haley C.S., Sewalem A., Visscher P.M. 2003. Quantitative trait loci variation for growth and obesity between and within lines of pigs (Sus scrofa). Genetics 164(2), 629-635.
Óvilo C., Fernández A., Noguera J.L., Barragán C., Letón R., Rodríguez C., Mercadé A., Alves E., Folch J.M., Varona L., Toro M. 2005. Fine mapping of porcine chromosome 6 QTL and LEPR effects on body composition in multiple generations of an Iberian by Landrace intercross. Genet Res Camb85, 57-67.
Paszek A.A., Wilkie P.J., Flickinger G.H., Rohrer G.A., Alexander L.J. Beattie C.W., Schook L.B. 1999. Interval mapping of growth in divergent swine cross. Mamm Genome10, 117.122.
Peixoto J.O., Guimarães S.E.F., Lopes P.S., Soares M.A.M., Pires A.V., Barbosa M.V.G., Torres R.A., Silva M.A. 2006. Associations of leptin gene polymorphisms with production traits in pigs. J Anim Breed Genet 123, 378-383.
Pérez-Enciso M., Clop A., Noguera J.L., Óvilo C., Coll A., Folch J.M., Babot D., Estany J., Oliver M.A., Díaz I., Sánchez A. 2000. A QTL on pig chromosome 4 affects fatty acid metabolism: Evidence from an Iberian by Landrace intercross. J Anim Sci78, 2525-2531.
Rattink A.P., De Koning D.J., Faivre M., Harlizius B., van Arendonk J.A.M, Groenen M.A.M. 2000. Fine mapping and imprinting analysis for fatness trait QTLs in pigs. Mamm Genome11, 656-661.
Rohrer G.A., Alexander L.J., Hu Z., Smith T.P., Keele J.W., Beattie C.W. 1996. A comprehensive map of the porcine genome. Genome Res6, 371-391.
Seaton G., Haley C.S., Knott S.A., Kearsey M., Visscher P.M. 2002. QTL express: mapping quantitative trait loci in simple and complex pedigrees. Bioinformatics 18(2), 339-340. Available at: <http://qtl.cap.ed.ac.uk>. Accessed between January 3 and 15, 2008.
Vianna A.T. 1985. Os Suínos. 14ª ed. Editora Nobel, São Paulo, 384 pp.
Vidal O., Noguera J.L., Amills M., Varona L., Gil M., Jiménez N., Dávalos G., Folch J.M., Sánchez A. 2005. Identification of carcass and meat quality quantitative trait loci in a Landrace pig. J Anim Sci83, 293-300.
Walling G.A., Archibald A.L., Cattermole J.A., Downing A.C., Finlayson H.A., Nicholson D., Visscher P.M., Walker C.A., Haley C.S. 1998. Mapping of quantitative trait loci on porcine chromosome 4. Anim Genet 29(6), 415-424.
Walling G.A., Visscher P.M., Andersson L. Rothschild M.F., Wang L., Moser G., Groenen M.A., Bidanel J.P, Cepica S., Archibald A.L., Geldermann H., de Koning D.J., Milan D., Haley C.S. 2000. Combined analyses of data from quantitative trait loci mapping studies. Chromosome 4 effects on porcine growth and fatness. Genetics 155, 1369-1378.
CHAPTER 3
Meta-Analysis of Results from Quantitative Trait Loci Mapping
Studies on Pig Chromosome 4
Abstract - Meta-analysis of results from multiple studies could lead to more
precise quantitative trait loci (QTL) position estimates compared to the
individual experiments. In this study we performed a meta-analysis of QTL on
chromosome 4 in pigs, using data from 25 separate experiments. First, a
meta-analysis was performed for individual traits: average daily gain and backfat
thickness. Second, a meta-analysis was performed for the QTL of three traits
affecting loin yield: loin eye area, carcass length, and loin meat weight. Finally,
78 QTL were selected from 20 traits that could be assigned to one of three
broad categories: carcass, fatness, or growth traits. Meta-QTL related to growth
and fatness were found in the same region as the FAT1 gene. For each
analysis the number of identified meta-QTL was smaller than the number of
initial QTL. In addition, the meta-analysis narrowed down the QTL confidence
intervals compared to individual QTL estimates. Results suggest that the
meta-analysis is an efficient strategy to estimate the number and positions of QTL
using information from multiple populations and experiments. This strategy can
be used as a guide for further studies with the aim to select candidate genes
related to trait variation.
Introduction
Genome mapping projects have been performed for all main livestock
animals over the last two decades. Pigs have been a focus of particular
attention because of the potential benefits of detecting and identifying
quantitative trait loci (QTL) and using them in breeding programs (Rothschild
and Plastow, 2007). The first successful large QTL analysis in pigs was
conducted by Andersson et al. (1994) using Wild Boar and Large White in a
three-generation cross, and revealed major QTL on chromosome 4 affecting
of studies have been published with QTL for growth, carcass, meat quality,
reproduction, disease resistance, and other traits (Bidanel and Rothschild,
2002).
Multiple studies have successfully identified QTL for the same trait on
the same chromosome (Walling et al., 1998). However, there is variation in the
estimated chromosomal positions of QTL detected by individual studies. In
addition, QTL identified from individual mapping studies usually have large
confidence intervals, such that distinction between one or more tightly linked
QTL cannot be made. The confidence interval of a QTL is inversely proportional
to population size and QTL effects (Visscher et al., 1996; Darvasi and Soller,
1997; Roberts et al, 1999; Bennewitz et al., 2002), so a large confidence
interval occurs when a QTL has a small gene effect or when a small population
size is used. In practice, the confidence interval is important because it
determines the potential for further experiments to close in on QTL. A smaller
confidence interval would increase the efficiency in selecting candidate genes.
Results from independent pig studies are available online in a QTL
database (http://www.animalgenome.org/QTLdb/pig.html, Hu et al., 2005). In
pigs, the highest density of QTL has been found on chromosome 4 (Rothschild
et al, 2007). Pig chromosome 4 presents a large number of similar results
among various QTL studies (Andersson et., 1994; Knott et al., 1998; Milan et
al., 1998; Moser et al., 1998; Walling et al., 1998; Wang et al., 1998; de Koning
et al., 1999; Marklund et al., 1999; Gelderman et al., 2003; Cepica et al., 2003).
It would be useful to determine from all of these results whether QTL detected
in independent experiments and located in the same region of a particular
chromosome are multiple discoveries of the position of a single QTL or reflect
the involvement of more than one QTL among different populations.
Meta-analysis, first mentioned by Glass (1976), is a statistical analysis
combining results from different sources in a single study. This technique was
first used by researchers in medical, social, and behavioral sciences, and offers
considerable potential to extract additional information from the combined
results. Combining results from different experiments and populations could
also provide an idea of how many different QTL exist for a specific trait, and
Reports of QTL studies in pigs have been based on an individual
population or, in a few cases, on a combined analysis using raw data from a
small number of studies (Walling et al., 2000; Kim et al., 2005; Guo, et al.,
2008). To our knowledge, this is the first report on a meta-analysis in pigs using
QTL results from separately reported studies. Some studies have reported
results from meta-analysis in plants (Chardon et al., 2004; Wang et al, 2006;
Guo et al., 2006). In the present study, the aim was to investigate the benefits of
using meta-analysis to identify QTL underlying economic traits in pigs. We also
aimed to refine the estimated positions of underlying QTL on chromosome 4
and narrow down their confidence intervals. Chromosome 4 was chosen
because data from a large number of independent studies was available.
Materials and Methods
MetaQTL program: The purpose of the meta-QTL analysis is to evaluate,
for a given trait, the degree of congruency of the QTL detected in independent
mapping experiments. The MetaQTL program was developed by Veyrieras et
al. (2007) (available on http://www.bioinformatics.org/mqtl). The program
estimates the number and positions of the underlying QTL that best explain the
observed distribution of QTL positions in the mapping experiments. The
program uses a general database containing an experimental table, trait
ontology table, and marker dictionary table, plus two sub-databases: the genetic
linkage map database and the QTL database. The method assumes that each
experiment was performed on an independent population sample.
Recombination is modeled to be independent in each marker interval. The
genetic maps are assumed to be connected when there are at least two
common markers between them. The MetaQTL program builds a consensus
genetic marker map that takes into account the statistical properties of genetic
distance estimates using a Weighted Least Squares (WLS) strategy. The
individual QTL locations are then projected onto the consensus map.
To identify the number of underlying QTL, the program uses a clustering
algorithm based on a Gaussian mixture model as suggested by Goffinet and
Gerber (2000). This approach provides decision rules based on the Akaike
given chromosome. It also groups QTL detected in independent experiments
into sets that correspond to the same QTL and provides an estimation of the
underlying QTL positions.
To perform the meta-analysis, the MetaQTL program requires the
following information: population type (F2, backcross, etc.), population size, QTL
position, QTL confidence interval or R2 (proportion of variance explained by
each QTL), and QTL additive effects. When the confidence interval for the QTL
position was not available, a 95% confidence interval was estimated by the
MetaQTL program with the approach proposed by Darvasi and Soller (1997), as
C.I. = 530/NxR2, where R2 is the proportion of variance explained by each QTL
and Nis the size of the population.
Data: Data from identified QTL on SSC4 were received from PigQTLdb
(http://www.animalgenome.org/QTLdb/pig.html, Hu et al., 2005) and from three
additional populations (van Wijk et al., 2006; Slawinska et al., 2008; Silva et al.,
2008). From the PigQTLdb, all QTL on chromosome 4 were used for which
information was complete. From the additional populations, all QTL on
chromosome 4 were used that were reported as significant (P<0.05).
First, the potential of meta-analysis was explored by choosing traits
which have a large number of QTL in the dataset. These traits were backfat
thickness and average daily gain. Second, three traits for which pleiotropic QTL
effects could be expected were chosen for analysis. The chosen traits were loin
eye area, carcass length, and loin meat weight. The three traits were analyzed
individually, and combined into one single analysis, as well. Third, all QTL were
used that could be assigned to one of the three categories of carcass, fatness,
and growth, and meta-analyses were performed on QTL in each of these three
categories.
Genetic map: The MetaQTL program uses different genetic maps that
share some common markers to build a consensus map. The map locations for
the QTL obtained from PigQTLdb were already interpolated to form a single
map for each chromosome (Hu et al. 2005) using the comparative framework of
ArkDB (Hu et al. 2001). Our study used the same genetic map file of
analysis in a single population as an “experiment”. For the additional
populations we used their own genetic map, which was built using the CRIMAP
program (Green et al., 1990); details can be found elsewhere (van Wijk et al.,
2006; Slawinska et al., 2008; Silva et al., 2008).
In order to study the congruency between the individual QTL, the
MetaQTL program projects the meta-QTL onto a reference map. In this case we
used a reference map on SSC4 that was obtained from the website
(http://www.marc.usda.gov/genome/swine/swine.html), and contains 87 markers
on a map size of 131 cM.
Results
At the time of analysis, the PigQTLdb contained 1831 QTL covering all
18 pig autosomes and the X and Y chromosomes. QTL were obtained from 113
publications and represented 316 different traits. There were 234 QTL on SSC4
for a large variety of traits. Most QTL were identified in F2 populations between
commercial breeds and exotic breeds, such as Chinese Meishan, Wild Boar,
and Iberian pigs. There are also a few results from commercial breed crosses,
as well as some use of other population designs, such as backcrosses and
half-sib populations. For this study, results were collected from 25 experiments from
which all required data was available to perform the meta-analysis. The source
of each population, its size, type of cross, and selected traits for each
experiment are summarized in Table 1.
analysis of backfat thickness and average daily gain –
Meta-analyses for backfat thickness and average daily gain were performed using
results from seven and nine experiments, respectively. Two meta-QTL were
found underlying each trait on chromosome 4 (Figure 1). For backfat thickness,
two distant meta-QTL were found: backfat thickness meta-QTL1 at 79 cM and
backfat thickness QTL2 at 118 cM. For average daily gain, the two
meta-QTL were found closer together: average daily gain meta-meta-QTL1 at 74 cM and
another QTL, average daily QTL2, at 99 cM. The number of
Table 1 - Summary of selected studies to perform the meta-analysis for traits related to
fat, carcass, and growth.
QTL studies Parents Type of
population
Population
size Traits
Bidanel Large white x Meishan F2 1103 ADG
Cepica1 Meishan x Piétrain F2 316 BF10thRIB, BFWT, CCWT ,CRCL ,DRESS ,HAMWT, LEA, LNWT
Cepica2 Wild Boar x Piétrain F2 315 CRCL, DRESS, FATP, HAMWT, LRIBBF, LEA, LEAN, LNWT, SHO
Cepica3 Wild Boar x Meishan F2 335 ADG, CCWT, CRCL, ENDWT, FATP, HAMWT, LEA, LNWT, SHOMT
Murani Berlin x Dutch F2 438 BFT, ADG, CRCL, LEA
Edwards1 Duroc x Piétrain F2 510 BF10thRIB, LEA, LEAN
Edwards2 Duroc x Piétrain F2 510 ENDWT
1Gelderman1 Meishan x Piétrain F2 316 BFWT, CRCL, CCWT, HAMWT, LNWT
1Gelderman2 Wild Boar x Piétrain F2 315 BFWT, DRESS, SHOMTWT
1Gelderman3 Wild Boar x Meishan F2 335 LNWT
Silva Piau x Commercial Line2 F2 617 AF, HAMWT, LEA, SHOMTWT, WT
Knott Wild Boar x Large White F2 199 AF, ADG, BFT
De Koning Meishan x Dutch F2 350 IMF
Andersson Wild Boar x Large White F2 200 ADG
Malek Berkshire x Yorkshire F2 525 ADG, CCWT, LUMBF, LRIBBF, LEA
Marklund Wild Boar x Meishan BC 85 AF, ADG, CRCL
Milan Meishan x Large White F2 488 BFWT, LRIBBF
Pazek Meishan x Yorkshire F2 298 BIRTHWT
Perez Iberian x Landrace F2 250 BFT, BFWT, CCWT, LEA
Rattink Meishan x Dutch F2 619 IMF
Sanshez Large White x Meishan F2 1103 ADG, BFWT, BIRTHWT, LUMBF
Slawinska Piétrain/Large White x Commercial3 F1 306 BFT, HAMWT
Su1 Large White x Meishan F2 81 BFT, FATP
Su2 Large White x Meishan F2 140 IMF
Varona Iberian x landrace F2 577 BFT, CRCL, LRIBBF, LEA
Walling Meishan x Large White F2 390 ADG, BFT
Wijk Piétrain/Large White x Commercial3 F1 1855 HAMWT
Wimmers Berlin x Dutch F2 438 BFT, CRCL, LEA
Although a meta-QTL analysis using QTL data from pigs was not found
in the literature, the results were in agreement with results reported from
combined analysis. Guo et al. (2008) carried out a whole genome combined
analysis using raw data from two F2 crosses between Large White and Chinese
Meishan pigs. On chromosome 4, they found three QTL: one QTL for fat at
mid-back (MBF), one for body weight at the end of the test (ETW), and one for teat
number (TN). The QTL for MBF was found at 80 cM (CI, 23-121 cM) and the
QTL for ETW was found at 61 cM (CI, 29.5-112 cM). Both meta-QTL for
average daily gain found in this study (meta-QTL1 and meta-QTL2) were
located within the confidence interval of the ETW QTL from the combined
analysis. However, only one meta-QTL for backfat thickness (backfat thickness
meta-QTL1) was found within the confidence interval of the BFT QTL. TN was
not analyzed in this study.
In another combined analysis, Walling et al. (2000) combined data from
six different F2 populations between commercial breeds and exotic breeds,
such as Meishan and Wild boar. A combined analysis was performed for three
traits: birth weight (BWT), growth rate from birth to the end of test (GRE), and
subcutaneous fat depth at the end of test (FAT). Five out of the six populations
that were used by Walling et al. (2000) were also included in our study. Walling
et al. (2000) found one QTL for BWT at 85 cM (CI not provided by authors), one
QTL for GRE at 81 cM (CI, 63-97 cM) and one QTL for FAT at 86 cM (CI not
provided by authors). In that study, the QTL for BWT and GRE were identified
at nearby positions and may represent a common QTL. It is worth noting that
average daily gain meta-QTL1, the QTL for ETW found by Guo et al. (2008),
and the QTL for GRE found by Walling et al. (2000) are all located in the same
region on pig chromosome 4 with overlapping confidence intervals for QTL
position.
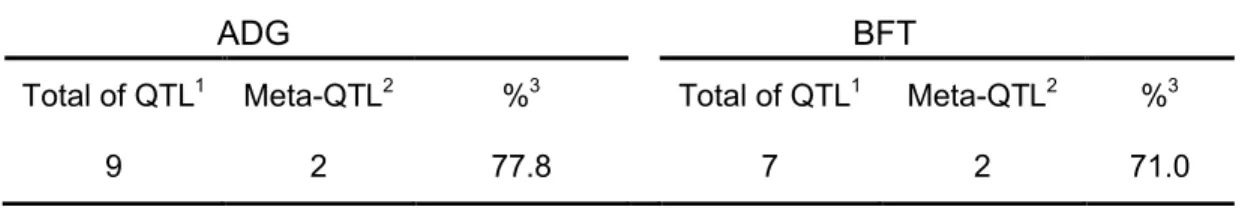
Table 2 – Total number of individual QTL used in the meta-analysis for each trait,
and number of meta-QTL found for each trait.
ADG BFT
Total of QTL1 Meta-QTL2 %3 Total of QTL1 Meta-QTL2 %3
9 2 77.8 7 2 71.0
1
Total number of QTL used to perform the meta-analysis. 2Number of Meta-QTL observed in the meta-analysis. 3Percentage decrease comparing the total number of individual QTL in each category to the total of meta-QTL.
Meta-analysis of loin traits – Three traits that are related to loin yield were
chosen to perform meta-analysis: loin eye area, carcass length, and loin meat
weight. These traits were analyzed individually and also pooled into a single
analysis (Figure 2). The most commercially relevant trait is loin weight.
However, observations are generally more easily available for loin eye area and
carcass length. We performed the meta-analysis for loin eye area and carcass
length separately from the meta-analysis for loin weight, assuming that loin
weight is a mathematical function of loin eye area and carcass length. By using
meta-analysis, the separate QTL for loin eye area (10 QTL), carcass length
meta-QTL, respectively. The combined analysis of all 20 QTL across the three
traits revealed four meta-QTL. The QTL found for loin eye area and for carcass
length fit nicely with the three meta-QTL found for loin weight. Combining all
data splits the middle group of QTL into two meta-QTL, while a single meta-QTL
was concluded from analysis on loin weight alone (Figure 2, Table 3). If animal
total weight gain is considered as skeletal gain and increase in muscling and fat
reserves, then these same QTL positions could be expected in the analysis of
gain in Figure 3. The results from analysis of gain match quite nicely. We found
a QTL for muscling (loin eye area) at 75.07 (Table 3), which is found in the
analysis of gain at 73.7 (Table 6), and a QTL for skeletal development at 89.02
(Table 3), which relates to a QTL at 86.4 for gain (Table 6).
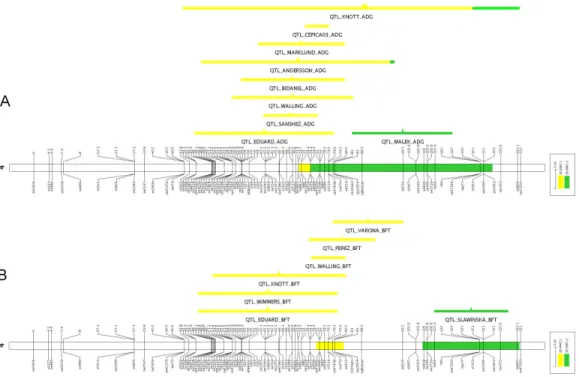
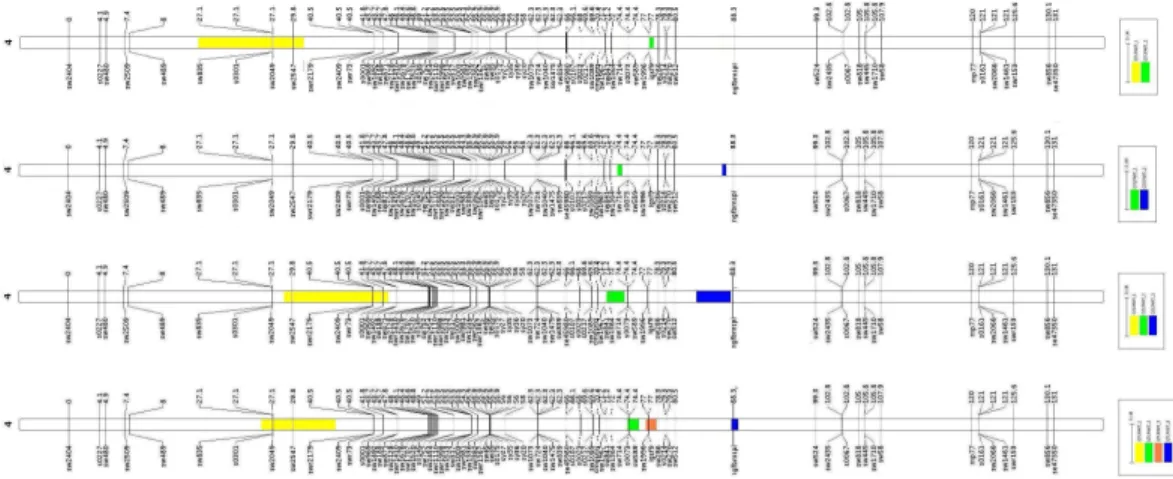
Figure 2 - Visualization of the QTL meta-analysis result on pig SSC4 for each
trait (from top to bottom): loin eye area – LEA, carcass length (CRCL), loin
weight (LNWT), and all traits pooled (ALL). Each colored bar represents an
individual meta-QTL and its length represents the confidence interval.
Meta-analysis of carcass, fatness and growth categories – In the final
analysis, QTL were selected for 20 traits that could be sorted into three
categories: fatness, growth, and carcass. These three categories were chosen
for meta-analysis because they are the most frequently represented categories
among the QTL identified on SSC4. Traits were sorted into categories