Plasma Metabolomic Profiling of Patients
with Diabetes-Associated Cognitive Decline
Lin Zhang1☯, Meng Li1☯, Libin Zhan2,1*, Xiaoguang Lu3*, Lina Liang1, Benli Su4, Hua Sui1, Zhengnan Gao5, Yuzhong Li6, Ying Liu7, Benhui Wu7, Qigui Liu8
1Academy of Integrative Medicine, Dalian Medical University, Dalian, Liaoning, China,2Department of Traditional Chinese Medicine, the Second Affiliated Hospital, Dalian Medical University, Dalian, Liaoning, China,3Department of Emergency Medicine, Zhongshan Hospital, Dalian University, Dalian, Liaoning, China,4Department of endocrinology, the Second Affiliated Hospital, Dalian Medical University, Dalian, Liaoning, China,5Department of endocrinology, Dalian Municipal Central Hospital Affillated of Dalian Medical University, Dalian, Liaoning, China,6Examination Department, the Second Affiliated Hospital, Dalian Medical University, Dalian, Liaoning, China,7Medical Examination Center, the Second Affiliated Hospital, Dalian Medical University, Dalian, Liaoning, China,8Public Health, Dalian Medical University, Dalian, Liaoning, China
☯These authors contributed equally to this work. *[email protected](LZ);[email protected](XL)
Abstract
Diabetes related cognitive dysfunction (DACD), one of the chronic complications of diabe-tes, seriously affect the quality of life in patients and increase family burden. Although the initial stage of DACD can lead to metabolic alterations or potential pathological changes, DACD is difficult to diagnose accurately. Moreover, the details of the molecular mechanism of DACD remain somewhat elusive. To understand the pathophysiological changes that un-derpin the development and progression of DACD, we carried out a global analysis of meta-bolic alterations in response to DACD. The metameta-bolic alterations associated with DACD were first investigated in humans, using plasma metabonomics based on high-performance liquid chromatography coupled with quadrupole time-of-flight tandem mass spectrometry and multivariate statistical analysis. The related pathway of each metabolite of interest was searched in database online. The network diagrams were established KEGGSOAP soft-ware package. Receiver operating characteristic (ROC) analysis was used to evaluate diag-nostic accuracy of metabolites. This is the first report of reliable biomarkers of DACD, which were identified using an integrated strategy. The identified biomarkers give new insights into the pathophysiological changes and molecular mechanisms of DACD. The disorders of sphingolipids metabolism, bile acids metabolism, and uric acid metabolism pathway were found in T2DM and DACD. On the other hand, differentially expressed plasma metabolites offer unique metabolic signatures for T2DM and DACD patients. These are potential bio-markers for disease monitoring and personalized medication complementary to the existing clinical modalities.
OPEN ACCESS
Citation:Zhang L, Li M, Zhan L, Lu X, Liang L, Su B, et al. (2015) Plasma Metabolomic Profiling of Patients with Diabetes-Associated Cognitive Decline. PLoS ONE 10(5): e0126952. doi:10.1371/journal. pone.0126952
Academic Editor:Petras Dzeja, Mayo Clinic, UNITED STATES
Received:October 23, 2014
Accepted:April 9, 2015
Published:May 14, 2015
Copyright:© 2015 Zhang et al. This is an open access article distributed under the terms of the Creative Commons Attribution License, which permits unrestricted use, distribution, and reproduction in any medium, provided the original author and source are credited.
Data Availability Statement:All relevant data are within the paper and its Supporting Information files.
Funding:This work was supported in part by the Key Project of National Natural Science Foundation of China (no. 81230084), by the Research Fund for the Doctoral Program of Higher Education of China (no. 20112105110006), by the Program for Professor of Special Appointment in Liaoning Province, and by the Program for Liaoning Innovative Research Team in University (no. LT2014018).
Introduction
Type 2 diabetes (T2DM) is a chronic metabolic disorder characterized by hyperglycaemia
re-sulting from insulin resistance and insufficiency [1]. Diabetes has been linked to a 50%
in-creased risk of dementia [2,3], and disease onset in midlife has been associated with an
increased long—term risk of dementia [2]. With an occurrence of T2DM in 12–25% of people
aged 65 and up [4,5], approximately one in ten to one in fifteen dementia cases worldwide can
be attributed to T2DM (population attributable risk). If pre-diabetes is also taken into account,
these estimates increase to one in seven to one in ten dementia cases [4]. Efforts to understand
the pathophysiological changes that underpin the development and progression of diabetes— related cognitive dysfunction (DACD) are of vital importance in the development of treat-ments to reverse or prevent these cognitive complications.
Metabolomics, the global assessment of endogenous small molecule metabolites within a
bi-ological system [6], provides a powerful platform for identifying biomarkers and
understand-ing biochemical pathways to improve diagnosis, prognosis, and treatment of disease [7,8]. It
has been successfully utilized in diabetes for metabolomic profiling using either human or ani-mal model of diabetes mellitus (DM) biofluids (obese Zucker rat, db/db mouse, ddY-H mouse
and streptozotocin (STZ) rat) [9–15]. Data from metabolomic analyses of DM indicate that
al-terations in sugar metabolites, amino acids, and choline-containing phospholipids, are
associ-ated early on with a higher risk of T2DM [16–18].
However, there have been no reports of metabolomic studies on DACD. Consequently, this study was designed to provide a comprehensive evaluation and comparison of the metabolome of patients with DACD and T2DM. HPLC-Q-TOF-MS was used in combination with pattern recognition methods and pathway analysis, to look for diversity in the metabolic phenotype, explore the diagnostic possibilities, define new potential biomarkers, and generate a better un-derstanding of the pathophysiology.
Materials and Methods
Materials
The metabolite standards used in this study were purchased from Toronto Research Chemicals Inc. (Toronto, Canada). The organic solvents and internal standards used in this study were purchased from Wako Pure Chemical Industries, Ltd (Osaka, Japan).
Study Subjects and Plasma Collection
Plasma samples from 24 diabetic patients, 24 patients with DACD, and 24 healthy controls were collected from the Endocrine wards and Health examination center of the Second Hospi-tal of Dalian Medical University (Dalian, China) between September, 2011 and September, 2012 without hypertension, renal or liver dysfunction. The study protocol was in accordance with the Helsinki declaration and approved by the ethics committee of Dalian Medical Univer-sity with written informed consent from all participants. To focus on the objectives of this study and exclude the effects of age, gender, and obesity, a total of 200 age-, gender-, and body mass index (BMI)-matched persons were selected and divided into three groups (health
con-trol, T2DM, DACD,p<0.05) according to WHO criteria of diagnosis of diabetes, MMSE and
MoCA. Among the T2DM and DACD groups, patients were all newly diagnosed thus without any treatments. The demographic and clinical chemistry characteristics of enrolled subjects are
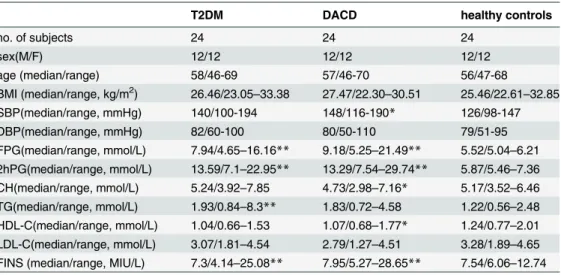
shown inTable 1. The subjects fasted for at least 12 hours before blood draw. The blood sample
tubes. Plasma samples were immediately prepared by centrifugation (3000 rpm for10 min) and
stored at−80°C until use for metabonomics analysis.
Sample Preparation and Pretreatment
Prior to LC/MS analysis, plasma samples were thawed at room temperature for 15 min,
vor-texed vigorously for 5s, and then 300μL of HPLC grade methanol (Fisher) was added to
100μL of the plasma samples and vortexed vigorously for another 30s. The sample mixture
was allowed to stand for 20 min at 4°C and centrifuged at 12,000 rpm for 15 min at 4°C. The
supernatant (200μL) was transferred to afresh tube then evaporated to dryness by nitrogen
blowing, then 200μL of 80% methanol were added and vortex-mixed. This resolublized
solu-tion was recentrifuged once again, and the supernatant was then transferred to a high perfor-mance liquid chromatograph (HPLC) autosampler injection vial for LC/MS analysis. To ensure the stability and repeatability of the HPLC-Q-TOF systems, pooled quality control
(QC) samples were prepared from 10μl of each sample and staggered with the other samples
(after every ten samples).
HPLC-QTOF/MS analysis
HPLC-QTOF/MS analysis was performed on 5μL aliquot of the pretreated plasma samples using
a C18 (2.1 mm×100 mm×1.8μm) column (Agilent Technologies, Santa Clara, CA, USA) held at
40°C using an Agilent 1260 Infinity LC System (Agilent Technologies). The metabolites were
eluted with a gradient of 2% B for 0−2min, 2−95% B for 2−17 min, and kept 95% B for 17−19
min. For positive ion mode (ES+) where A = water with 0.1% formic acid, B = acetonitrile with 0.1% formic acid, while A = water and B = acetonitrile for negative ion mode (ES-). The flow rate was 0.4 mL/min, and samples were maintained at 4°C during the analysis.
Mass spectrometry was performed using an Agilent 6530 UHD and Accurate-Mass Q-TOF (Agilent Technologies) equipped with an electrospray ionization source operating in either positive or negative ion mode. The source temperature was set at 100°C with a cone gas flow rate of 50 L/h. The desolvation gas temperature was 350°C with a flow rate of 600 L/h. The Table 1. Demographic and Clinical Chemistry Characteristics of T2DM, and DACD and healthy control.
T2DM DACD healthy controls
no. of subjects 24 24 24
sex(M/F) 12/12 12/12 12/12
age (median/range) 58/46-69 57/46-70 56/47-68
BMI (median/range, kg/m2) 26.46/23.05
–33.38 27.47/22.30–30.51 25.46/22.61–32.85 SBP(median/range, mmHg) 140/100-194 148/116-190* 126/98-147
DBP(median/range, mmHg) 82/60-100 80/50-110 79/51-95
FPG(median/range, mmol/L) 7.94/4.65–16.16** 9.18/5.25–21.49** 5.52/5.04–6.21 2hPG(median/range, mmol/L) 13.59/7.1–22.95** 13.29/7.54–29.74** 5.87/5.46–7.36 CH(median/range, mmol/L) 5.24/3.92–7.85 4.73/2.98–7.16* 5.17/3.52–6.46 TG(median/range, mmol/L) 1.93/0.84–8.3** 1.83/0.72–4.58 1.22/0.56–2.48 HDL-C(median/range, mmol/L) 1.04/0.66–1.53 1.07/0.68–1.77* 1.24/0.77–2.01 LDL-C(median/range, mmol/L) 3.07/1.81–4.54 2.79/1.27–4.51 3.28/1.89–4.65 FINS (median/range, MIU/L) 7.3/4.14–25.08** 7.95/5.27–28.65** 7.54/6.06–12.74
*P<0.05
**P<0.01 compared with healthy control
capillary voltage and the cone voltage were set to 4 kV and 35 V, respectively. Centroid data were collected from 50 to 1000 m/z with a scan time of 0.03 s, and an interscan delay of 0.02 s. All analyses were acquired using the lock spray feature to ensure accuracy and reproducibility. Leucine-enkephalin was used as the lock mass (m/z 556.2771 in ES+ and 554.2615 in ES-).
Data Preprocessing and Annotation
The raw HPLC-QTOF/MS ESI data were converted tomz format data by MassHunter(Agilent), and the files then imported to the XCMS package (R program) for preprocessing, including
non-linear retention time (RT) alignment, matched filtration, peak detection, and peak matching [19].
Finally, the output data was manually searched and edited in EXCEL2007 software, includ-ing the elimination of impurity peaks and duplicate identifications. The final results were changed to 2 D data matrix, including variance (Rt/mz), observed quantity and peak intensities.
Statistical Analysis
The two data sets resulting from HPLC-QTOF/MS ES+ and ES- were mean centered, unit var-iance scaled and combined before uni- and multivariate statistical analysis in SIMCA-p 11.0 Software package (Umetrics AB, Umea, Sweden), SPSS (v19, IBM, New York, NY), and Matlab. Both the unsupervised method (principal component analysis, PCA) and the super-vised method (Orthogonal partial least-squares discriminantanalysis, OPLS-DA) were em-ployed to reveal the global metabolic changes between T2DM and DACD, T2DM and healthy controls, and DACD and healthy controls using SIMCA-p 11.0 (Umetrics AB, Umea, Swe-den). The corresponding variable importance in the projection (VIP values) was calculated in the OPLS-DA model as well. A validation plot was used to assess the validity of the OPLS-DA model by comparing the goodness of fit of the OPLS-DA models with the goodness of fit of 100 Y-permutated models. On the basis of a VIP threshold of 1, from the 7-fold cross-validat-ed OPLS-DA model, a number of metabolites leading to the difference in the metabolic pro-files of diseased individuals and healthy controls were obtained. The differential metabolites were uncovered based on p value of bilateral asymptotic significance (Mann—Whitney U test,
p<0.05). The corresponding fold change shows how these selected differential metabolites
varied between the T2DM and healthy control groups, DACD and healthy control groups and T2DM and DACD.
The goodness-of-fit parameters for the OPLS model, R2X, R2Yand Q2Y, were calculated which varied from 0 to 1. R2X and R2Y represent the fraction of the variance of the x and y var-iable explained by the model, while Q2Y suggests the predictive performance of the model. For internal validation of the OPLS models, a permutation test (100 permutations) was performed. This evaluated whether the OPLS models, built with the groups, was significantly better than any other OPLS model obtained by randomly permuting the original group attributes.
Statistical analysis was performed using the R platform [20], with the exception of PCA and
Identification of Plasma Biomarkers
For the identification of potential biomarkers, some available biochemical databases, such as
HMDB (http://www.hmdb.ca/), KEGG (http://www.genome.jp/kegg/), METLIN (http://
metlin.scripps.edu/), LIPIDMAPS (http://www.lipidmaps.org/) and Chemspider (http://www. chemspider.com) were used by comparing the accurate mass within 10 ppm, fragments infor-mation and MS/MS data obtained from HPLC-Q-TOF/MS. The list of metabolites after
data-base matching is shown inS1 Table. Moreover, nine potential biomarkers among them were
further identified by comparing with reference standards. The interactions between metabolites of interest were analyzed by the KEGGSOAP software package, and the network diagrams in which parameter were set within 5-step reactions was established by Cytoscape.
Results
Metabolic Profiles ofT2DM, DACD and Healthy Controls
The typical HPLC-QTOF/MS chromatograms are shown inS1 Fig. The final data table
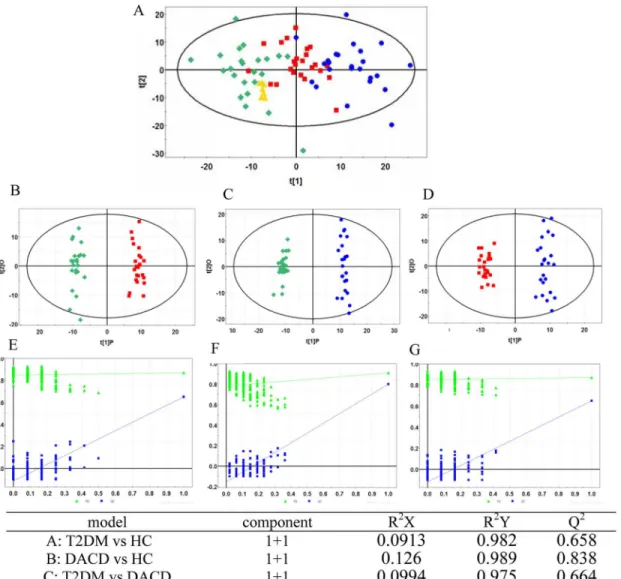
con-tained 1639 variables (chromatographic peaks). A principal component analysis (PCA) was
first performed to show a trend of intergroup separation on the scores plot (Fig 1A), in which
T2DM and DACD patients were clearly separated from healthy controls. This method also en-abled detection and exclusion of any outliers, defined as observations located outside the 95% confidence region of the model. The OPLS-DA models indicate clear separations between T2DM (red dots) and health control (green dots) groups (R2X = 0.09, R2Y = 0.98, Q2 = 0.66,
Fig 1B), DACD (blue dots) and health control (green dots) groups (R2X = 0.13, R2Y = 0.99,
Q2 = 0.84,Fig 1C), T2DM (red dots) and DACD (blue dots) groups (R2X = 0.10, R2Y = 0.98,
Q2 = 0.66,Fig 1D).
Discovery and Identification of Metabolic Biomarkers
The OPLS-DA S-plots were shown inS3 Fig, and potential markers were extracted based on
their contribution to the variations and correlation within the dataset. A total of 97 significantly
altered plasma features with a VIP threshold (VIP>1) from the aforementioned OPLS-DA
model as well as the FDR values based on two-sided p-values calculated from nonparametric
Kruskal-Wallis rank sum test (FDR<0.05) were selected and their variations are summarized in
S1 Table. These 97 metabolites were identified through MS/MS and online databases: 56 metab-olites for T2DM vs health control, 67 metabmetab-olites for DACD vs health control and 33metabo-lites for T2DM vs DACD. Nine of them, including glycerophosphocholine, phytosphingosine, glycocholic acid, sphingosine-1-phosphate, sphinganine-phosphate, pyroglutamic acid, hypo-xanthine, cholic acid and linoleic acid were additionally verified by external reference standards (S2 Tableand the identification of glycocholic acid was shown inS2 Fig). The % RSD of these 97 metabolites from plasma QC samples varied from 2.4 to 19.3% with a median of 7.2%, which indicated the robustness of our metabolic profiling platform, and this robustness could be sug-gested by the PCA scores plot comprising T2DM, DACD, healthy control, and the QCs as well.
Metabolic profile of T2DM and DACD compared with healthy controls
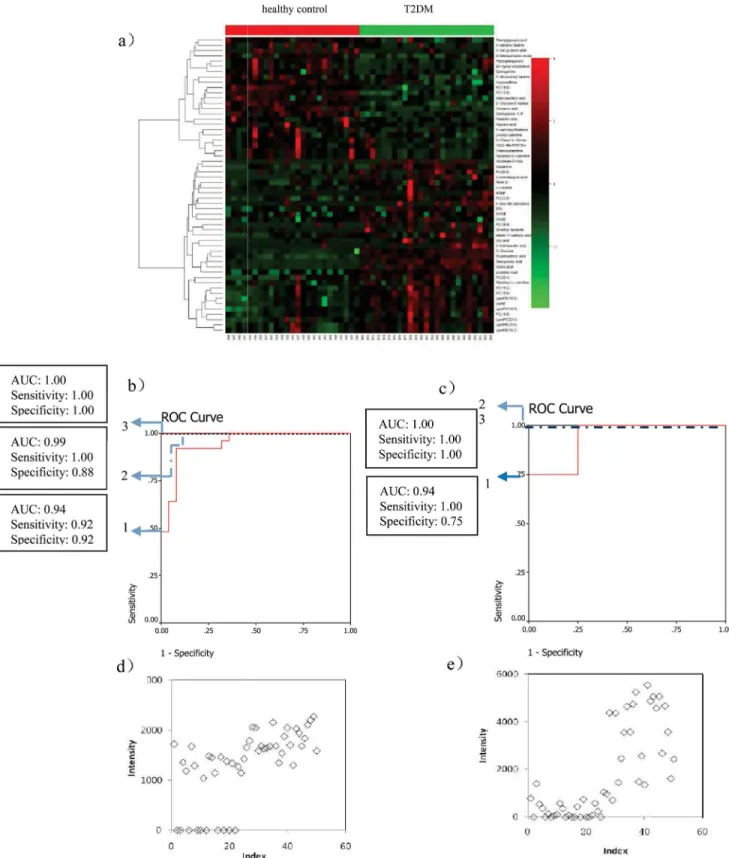
From the 56 metabolites differentiating T2DM patients from the healthy control group
(heat-map displayed inFig 2a), 8 metabolites (deoxycholic acid, cholic acid, 25-hydroxy-cholesterol,
cinnamic acid, 3-Indolebutyric acid, uric acid, PA(39:5), Linolenic Acid) were selected by two steps, first, ranking the separating capacity (in descending order) of the annotated metabolites
by their VIP,p-value and absolute fold change, respectively, and three lists were built. Secondly,
patients in each group were selected as a training set, with the remaining patients forming the test set. Linolenic acid and deoxycholic acid which were significantly contributed to the diagno-sis of T2DM, were selected by the binary logistic regression analydiagno-sis. Their combination can cor-rectly predict 100% patients with the corresponding AUC equal to 1.00 in the training set and can correctly predict 100% patients with the corresponding AUC equal to 1.00 in the test set (Fig
2band2c). The scatter plots of linolenic acid and deoxycholic acid are shown in Fig2dand2e.
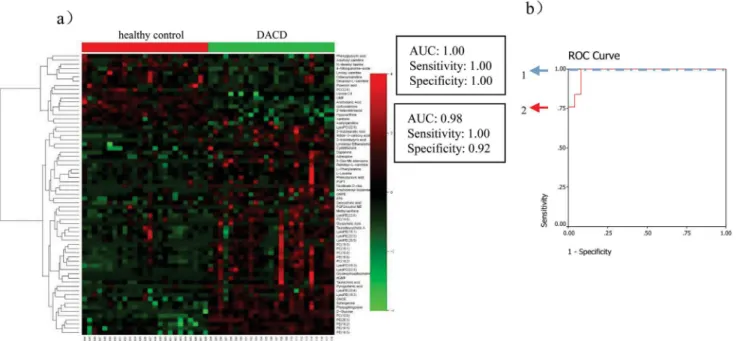
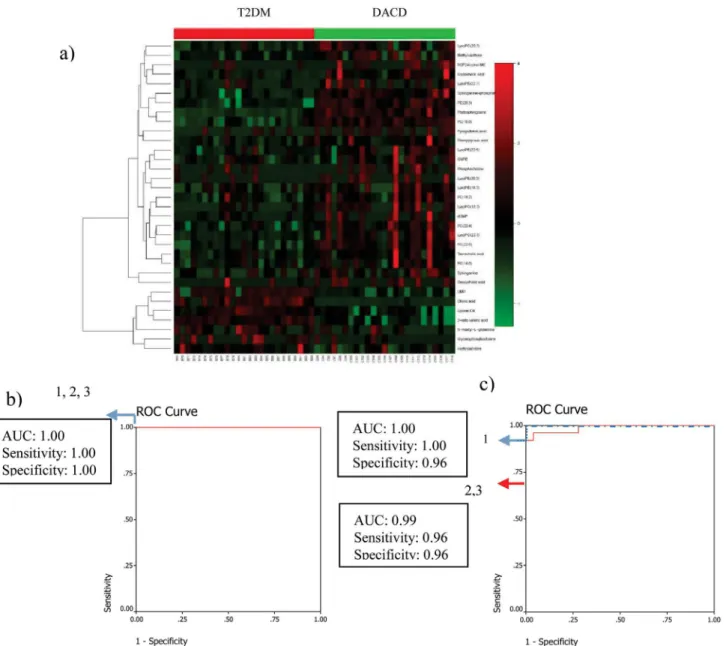
Among the 67 metabolites differentiating DACD patients from the healthy control group
(heat-map as shown inFig 3a), 10 metabolites (Glycerophosphocholine,
5'-Deoxy-5'-(methylthio)adenosine, PC(18:3), Pyroglutamic acid, LysoPE(18:3), 3-Methylxanthine/ 7-Methylxanthine/1-Methylxanthine, Phytosphingosine, LysoPC(22:5), PC(14:0), 2-keto vale-ric acid) were selected as mentioned above. Only phytosphingosine which was significantly contributed to the diagnosis of DACD, was selected by the binary logistic regression analysis. Phytosphingosine can correctly predict 100% patients with the corresponding AUC equal to Fig 1. PCA model and OPLS-DA models with corresponding values of R2X, R2Y, and Q2.(A) PCA score plot of healthy controls (green diamond), T2DM patients (red square), DACD patients (blue circle) and QC samples (yellow triangle); (B) OPLS-DA score plot of healthy controls (green diamond) vs T2DM patients (red square); (C) OPLS-DA score plot of healthy controls (green diamond) vs DACD patients (blue circle); (D) OPLS-DA score plot of T2DM patients (red square) vs DACD patients (blue circle); (E, F, G) Validation plot obtained from 100 tests, respectively.
Fig 2. Comparison of metabolomic profiles from T2DM patients vs healthy controls.(a) Heat-map of fold change of 56 differential metabolites; (b) Discrimination of T2DM in the training set using Linolenic Acid (1), deoxycholic acid (2), and the combination of them (3). (c) Discrimination of T2DM in the test set using Linolenic Acid (1), deoxycholic acid (2), and the combination of them (3); (d) Scatter plot of Linolenic Acid; (e) Scatter plot of deoxycholic acid.
1.00 in the training set and can correctly predict 92% patients with the corresponding AUC
equal to 0.98 in the test set (Fig 3b).
Metabolite Markers Identified between T2DM and DACD, for
Classification of the Two Conditions
Similarly, 9 metabolites (Phytosphingosine, PC(22:6), PE(20:3), 2-keto valericacid, Sphinganine-phosphate, Cholic acid, Deoxycholic acid,
3-Methylxanthine/7-Methylxanthine/1-Methylxan-thine, Uridine monophosphate) were selected from 33 metabolites (heat-map displayed inFig
4a) between T2DM and DACD patients. Phytosphingosine and sphinganine-phosphate which
were significantly contributed to distinguish DACD from T2DM, were selected by the binary lo-gistic regression analysis. Phytosphingosine and sphinganine-phosphate can correctly predict
100% patients with the corresponding AUC equal to 1.00 in the training set (Fig 4b) and can
cor-rectly predict 99% patients with the corresponding AUC equal to 0.99 in the test set (Fig 4c).
Discussion
Emerging evidence suggests that diabetes increases the incidence of dementia to develop to
DACD [21–26]. DACD is one of chronic complications in diabetic patients, which was
diag-nosed by using TCD, rheoencephalogram, brain CT scan, nuclear magnetic resonance spectrum, MoCA and MMSE for cognitive dysfunction, and clinical manifestation and serum indexes for diabetes mellitus. However, none of these methods is suitable for the clinically exclusive diagno-sis of DACD at an early stage. Therefore, a non-invasive method and sufficiently sensitive and specific biomarkers are urgently needed for assessing the presence and progression of DACD. Plasma metabonomics based on HPLC/Q-TOF MS has been of great value in the discovery of
biomarkers and the elucidation of the pathogenesis of various diseases [27–29]. There were a lot
of researches on the metabonomics study of T2DM, and most of differential metabolites
identi-fied in our studies were reported before [30]. However, there has been no report on plasma
Fig 3. Comparison of metabolomic profiles from DACD patients vs healthy controls.(a) Heat-map of fold change of 66 differential metabolites; (b) Discrimination of DACD in the training set (1) and in the test set (2) using phytosphingosine.
metabonomics study of DACD patients. Therefore, this unbiased global plasma metabonomics study based on HPLC/Q-TOF MS coupled with multivariate statistical analysis is the first to identify potential biomarkers and unravel the molecular mechanisms of DACD.
To gain insight into the metabolic mechanism of DACD and to provide accurate treatment informations of DACD, altered metabolic pathway and the network relationship associated with DACD has been further investigated. Therefore, we developed a research approach con-sisting of the following steps. First, the related pathway of each metabolite of interest was searched in the database. Second, the interactions between metabolites of interest were ana-lyzed by the KEGGSOAP software package. Third, the network diagrams in which parameter were set within 5-step reactions was established by Cytoscape. Fourth, the metabolic mecha-nism was presumed by network analysis.
Fig 4. Comparison of metabolomic profiles from T2DM vs DACD patients.(a) Heat-map of fold change of 33 differential metabolites; (b) Discrimination T2DM from DACD in the training set using phytosphingosine (1), sphinganine-phosphate (2), and the combination of them (3). (c) Discrimination T2DM from DACD in the test set using phytosphingosine (1), sphinganine-phosphate (2), and the combination of them (3).
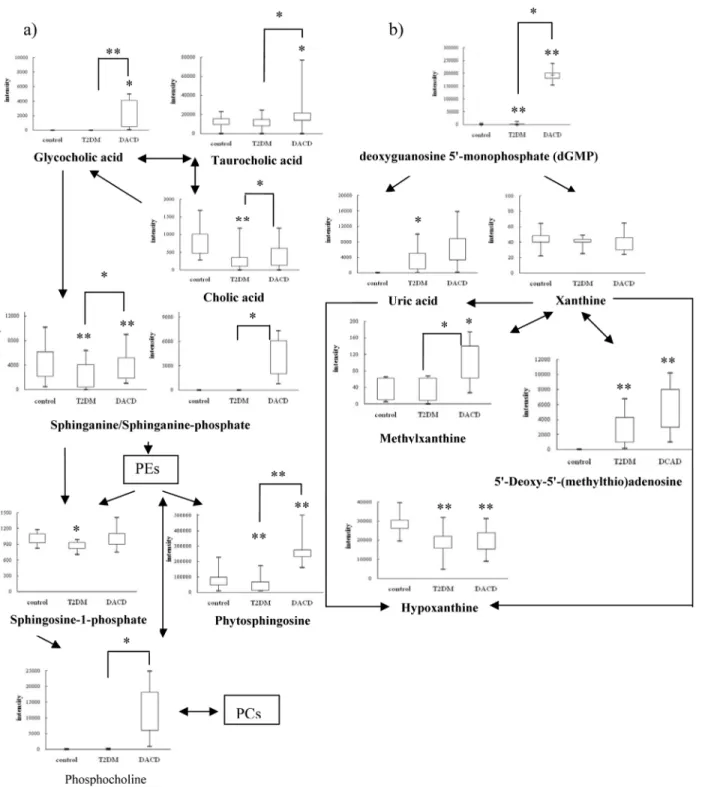
Sphingolipids metabolism
Sphingolipids are essential lipids consisting of a sphingoid backbone that is N-acylated with various fatty acids to form many ceramide species, which can have hundreds of distinct head
groups [31]. Sphingolipids have a rapid turnover and their levels are controlled by the balance
between synthesis and degradation in multiple compartments [32]. Their metabolism could
af-fect cell growth, differentiation and behavior. Previous studies have shown that sphingolipids
contribute to insulin resistance, diabetes, Alzheimer’s disease and other diseases [33–35].
Inter-estingly, we saw a significant decrease in levels of phytosphingosine, sphinganine and sphingo-sine-1-phosphate in T2DM patients, however, levels of phytosphingosine and sphinganine
were elevated in DACD patients (Fig 5a), which is consistent with the reported changing
ten-dency of sphingolipids metabolism in the plasma of T2DM patients [36], and there was no
re-port about that in the plasma or other body fluid of DACD patients. But the sphingolipids were found to be elevated in the plasma of patients with mild cognitive impairment and alzheimer's
disease, which possessed some correlation with our results [29].
Bile acids metabolism
Bile acids have long been known to be essential in dietary lipid absorption and cholesterol ca-tabolism, and have a role in regulating thyroid hormone signaling and energy homeostasis
[37]. In healthy individuals, only small quantities of bile acids are found in peripheral
circula-tion and plasma. However, in patients with hepatobiliary and intestinal disease, disturbances of synthesis, metabolism, and clearance by the liver and absorption by the intestine affect the con-centration and profile of bile acids in various compartments (plasma, liver, gallbladder, urine
and feces) [38]. In our study, increased cholic acid level was observed in T2DM patients,
simi-larly with that in the urine of streptozotocin-induced diabetic rats [39,40]. Increased levels of
glycocholic acid and taurocholic acid were observed in DACD patient, which was consistent
with that in the plasma of MCI and AD patients [40].
Uric acid metabolism
Uric acid produced by hypoxanthine and xanthine under the catalysis of xanthine oxidase, is the end product of purine metabolism in humans. Although uric acid is a potent antioxidant in the extracellular environment, when uric acid enters cells via specific organic anion transport-ers, it induces an oxidative burst in vascular smooth muscle cells, endothelial cells, adipocytes,
islet cells, and hepatocytes, which may increase the risk for metabolic syndrome [41–44]. In
our study, decreased hypoxanthine and xanthine levels, and increased uric acid levels were
ob-served in T2DM and DACD patients as shown inFig 5b, although, eliminating uric acid in
DACD and xanthine in T2DM after FDR corrections, which was consistent with that in T2DM
and vascular dementia patients, as reported previously [45,46]. Therefore, an elevated serum
uric acid was reported to be one of the best independent predictors of diabetes and commonly
precedes the development of diabetes [44]. Similarly, an increase in xanthine oxidase activity
has also been observed in the plasma of T2DM patients, which may be the reason of the
upre-gulation of uric acid and downreupre-gulation of hypoxanthine and xanthine [47]. Other research
groups have also shown that increased uric acid levels in plasma result in an elevated risk of
cognitive impairment [48,49]. Furthermore, upregulation of deoxyguanosine
but also should pay attention to the risk factor of hyperuricemia and give relative intervention measures in a timely fashion.
There were some limitations to our studies. Clearly our observations need to be replicated and verified in other larger cohorts, and more informations should be got from muti-methods Fig 5. Metabolic network of the significantly changed metabolites within 5 steps by cytoscape software package.The normalized contents are shown under the chemical name. All the p values were calculated using Student t test.,*p<0.05,**p<0.01.
for example HILIC column, GC-MS, NMR and so on. This issue is currently being examined in follow-up studies. In particular it will be important to evaluate the additional value of meta-bolomic measurements compared to established clinical pathology data if the metabolites ob-served here associated with DACD are to be considered as valuable biomarkers in the future. We are further investigating the expression of proteins involved in the identified pathways in
T2DM and DACD patients to further validate these potential biomarkers.[21][26]
Supporting Information
S1 Fig. The HPLC-MS TICs of plasma samples from three groups as technical replicates.
(TIF)
S2 Fig. The [M+H]+, [M-H]-and MS/MS spectrum of glycocholic acid.
(TIF)
S3 Fig. The results of S-plots of OPLS-DA models.(A) T2DM vs Health control. (B) DACD vs Health control. (C) DACD vs T2DM.
(TIF)
S1 Table. Statistical analysis result of differential metabolites.
(PDF)
S2 Table. The informations of reference standards.
(PDF)
S3 Table. The detailed results from the pathway analysis.
(PDF)
Acknowledgments
This work was supported in part by the Key Project of National Natural Science Foundation of China (no. 81230084), by the Research Fund for the Doctoral Program of Higher Education of China (no. 20112105110006), by the Program for Professor of Special Appointment in Liao-ning Province, and by the Program for LiaoLiao-ning Innovative Research Team in University (no. LT2014018). The authors also thank Hua-Zong Zeng at Sensichip Tech@infor Co. Ltd. For the assistance in bio-information analysis.
Author Contributions
Conceived and designed the experiments: L. Zhan XL. Performed the experiments: ML LL ZG BW. Analyzed the data: L. Zhang BS Y. Li QL. Contributed reagents/materials/analysis tools: HS Y. Liu. Wrote the paper: L. Zhang. Modified the grammatical errors in the manuscript: L. Zhan.
References
1. McCrimmon RJ, Ryan CM, Frier BM. Diabetes and cognitive dysfunction. Lancet. 2012; 379: 2291–
2299. doi:10.1016/S0140-6736(12)60360-2PMID:22683129
2. Biessels GJ, Staekenborg S, Brunne E, Brayne C, Scheltens P. Risk of dementia in diabetes mellitus: a systematic review. Lancet Neurol. 2006; 5: 64–74. PMID:16361024
4. Exalto LG, Whitmer R, Kappele LJ, Biessels GJ. An update on type 2 diabetes, vascular dementia and Alzheimer's disease. Exp Gerontol. 2012; 47: 858–864. doi:10.1016/j.exger.2012.07.014PMID: 22884853
5. Wild S, Roglic G, Green A, Sicree R, King H. Global prevalence of diabetes: estimates for the year 2000 and projections for 2030. Diabetes Care. 2004; 27: 1047–1053. PMID:15111519
6. Nicholson JK, Lindon JC. Systems biology: Metabonomics. Nature. 2008; 455: 1054–1056. doi:10. 1038/4551054aPMID:18948945
7. Leichtle AB, Ceglarek U, Weinert P, Nakas CT, Nuoffer JM, Kase J, et al. Pancreatic carcinoma, pan-creatitis, and healthy controls: metabolite models in a three-class diagnostic dilemma. Metabolomics. 2013; 9: 677–687. PMID:23678345
8. Xia J, Broadhurst DI, Wilson M, Wishart DS. Translational biomarker discovery in clinical metabolo-mics: an introductory tutorial. Metabolomics. 2013; 9: 280–299. PMID:23543913
9. Oresic M, Simell S, Sysi-Aho M, Nanto-Salonen K, Seppanen-Laakso T, Parikka V, et al. Dysregulation of lipid and aminoacid metabolism precedes islet autoimmunity in children who laterprogress to type 1 diabetes. J Exp Med. 2008; 205: 2975–2984. doi:10.1084/jem.20081800PMID:19075291
10. Wang TJ, Larson MG, Vasan RS, Cheng S, Rhee EP, McCabe E, et al. Metabolite profiles and the risk of developing diabetes. Nat Med. 2011; 17: 448–453. doi:10.1038/nm.2307PMID:21423183
11. Gika HG, Theodoridis EJ, Extance J, Edge AM, Wilson ID. High temperature-ultra performance liquid chromatography-mass spectrometry for the metabonomic analysis of Zucker rat urine. J Chromatogr B Analyt Technol Biomed Life Sci. 2008; 871: 279–287. doi:10.1016/j.jchromb.2008.04.020PMID: 18485837
12. Connor SC, Hansen MK, Corner A, Smith RF, Ryan TE. Integration of metabolomics and transcrip-tomics data to aid biomarker discovery intype 2 diabetes. Mol Biosyst. 2010; 6: 909–921. doi:10.1039/ b914182kPMID:20567778
13. Katyare SS, Satav JG. Effect of streptozotocin-induced diabetes onoxidative energy metabolism in rat kidney mitochondria. A comparative study of early and late effects. Diabetes Obes Metab. 2005; 7: 555–562. PMID:16050948
14. Zhao L, Gao H, ZhaoY, LinD. Metabonomic analysis of the therapeutic effect of Zhibai Dihuang Pill in treatment of streptozotocin-induced diabetic nephropathy. J Ethnopharmacol. 2012; 142: 647–56. doi: 10.1016/j.jep.2012.05.031PMID:22687255
15. Blachnio-Zabielska A, Zabielski P, Baranowski M, Gorski J. Effects ofstreptozotocin-induced diabetes and elevation of plasma FFA onceramide metabolism in rat skeletal muscle. Horm Metab Res. 2009; 42: 1–7. doi:10.1055/s-0029-1238322PMID:19753513
16. Padberg I, Peter E, González-Maldonado S, Witt H, Mueller M, Weis T, et al. A new metabolomic signa-ture in type-2 diabetes mellitus and its pathophysiology. PLoS One, 2014; 9: e85082. doi:10.1371/ journal.pone.0085082PMID:24465478
17. Bentley-Lewis R, Xiong G, Lee H, Yang A, Huynh J, Kim C, et al. Metabolomic Analysis Reveals Amino Acid Responses to an Oral Glucose Tolerance Test in Women with Prior History of Gestational Diabe-tes Mellitus. J Clin Transl Endocrinol. 2014; 1: 38–43. PMID:24932438
18. Floegel A, Stefan N, Yu Z, Mühlenbruch K, Drogan D, Joost HG, et al. Identification of serum metabo-lites associated with risk of type 2 diabetes using a targeted metabolomic approach. Diabetes. 2013; 62: 639–48. doi:10.2337/db12-0495PMID:23043162
19. Smith C, Want EJO'Maille G, Abagyan R,Siuzdak G. XCMS: processing mass spectrometry data for metabolite profiling using nonlinear peak alignment, matching, and identification. Anal Chem. 2006; 78: 779–787. PMID:16448051
20. R Development Core Team. R: A language and environment for statistical computing. R Foundation for Statistical Computing, Vienna, Austria. ISBN 3-900051-07-0. 2008; Available:http://www.R-project. org.
21. Roberts RO, Knopman DS, Przybelski SA, Mielke MM, Kantarci K, Preboske GM, et al. Association of type 2 diabetes with brain atrophy and cognitive impairment. Neurology. 2014; 82: 1132–1141. doi:10. 1212/WNL.0000000000000269PMID:24647028
22. Morris JK, Vidoni ED, Honea RA, Burns JM. Impaired glycemia increases disease progression in mild cognitive impairment. Neurobiol Aging. 2014; 35: 585–589. doi:10.1016/j.neurobiolaging.2013.09.033 PMID:24411018
23. Maher PA, Schubert DR. ()Metabolic links between diabetes and Alzheimer’s disease. Expert Rev Neu-rother. 2009; 9: 617–630. doi:10.1586/ern.09.18PMID:19402773
25. Ott A, Stolk RP, van Harskamp F, Pols HA, Hofman A, Breteler MM, et al. Diabetes mellitus and the risk of dementia: the Rotterdam study. Neurology. 1999; 53: 1937–1942. PMID:10599761
26. Matsuzaki T, Sasaki K, Tanizaki Y, Hata J, Fujimi K, Matsui Y, et al. Insulin resistance is associated with the pathology of Alzheimer disease: the Hisayama study. Neurology, 2010; 75: 764–770. doi:10. 1212/WNL.0b013e3181eee25fPMID:20739649
27. Liu R, Bi K, Jia Y, Wang Q, Yin R, Li Q. Determination of polyamines in human plasma by high-perfor-mance liquid chromatography coupled with Q-TOF mass spectrometry. J Mass Spectrom, 2012; 47: 1341–1346. doi:10.1002/jms.3084PMID:23019166
28. Shang J, Liu J, He M, Shang E, Zhang L, Shan M, et al. () UHPLC/Q-TOF MS-based plasma metabolic profiling analysis of the bleeding mechanism in a rat model of yeast and ethanol-induced blood heat and hemorrhage syndrome. J Pharm Biomed Anal. 2014; 92: 26–34. doi:10.1016/j.jpba.2013.12.019 PMID:24469093
29. Trushina E, Dutta T, Persson XM, Mielke MM, Petersen RC. () Identification of altered metabolic path-ways in plasma and CSF in mild cognitive impairment and Alzheimer’s disease using metabolomics. PLoS One. 2013; 8: e63644. doi:10.1371/journal.pone.0063644PMID:23700429
30. Galazis N, Iacovou C, Haoula Z, Atiomo W. () Metabolomic biomarkers of impaired glucose tolerance and type 2 diabetesmellitus with a potential for risk stratification in women with polycystic ovarysyn-drome. Eur J Obstet Gynecol Reprod Biol. 2012; 160: 121–130. doi:10.1016/j.ejogrb.2011.11.005 PMID:22136882
31. Michael M, Sarah S. () Sphingolipid metabolites in inflammatory disease. Nature. 2014; 510: 58–67. doi:10.1038/nature13475PMID:24899305
32. Hannun YA, Obeid LM. () Principles of bioactive lipid signalling: lessons from sphingolipids. Nat Rev Mol Cell Biol. 2008; 9: 139–150. doi:10.1038/nrm2329PMID:18216770
33. Holland W, Summers S. Sphingolipids, insulin resistance, and metabolic disease: new insights from in vivo manipulation of sphingolipid metabolism. Endocr Rev. 2008; 29: 381–402. doi: 10.1210/er.2007-0025PMID:18451260
34. Lipina C, Hundal HS. Sphingolipids: agents provocateurs in the pathogenesis of insulin resistance. Dia-betologia. 2011; 54: 1596–1607. doi:10.1007/s00125-011-2127-3PMID:21468641
35. Van Echten-Deckert G, Walter J. Sphingolipids: critical players in Alzheimer's disease. Prog Lipid Res. 2012; 51: 378–393. doi:10.1016/j.plipres.2012.07.001PMID:22835784
36. Zhang J, Yan L, Chen W, Lin L, Song X, Yan X, et al. Metabonomics research of diabetic nephropathy and type 2 diabetes mellitus based on UPLC—QTOF-MS system. Anal Chim Acta. 2009; 650: 16–22. doi:10.1016/j.aca.2009.02.027PMID:19720167
37. Watanabe M, Houten SM, Mataki C, Christoffolete MA, Kim BW, Sato H, et al. Bile acids induce energy expenditure by promoting intracellular thyroid hormone activation. Nature. 2006; 439: 484–489. PMID: 16400329
38. Plaa GL, Hewitt WR. Toxicology of the Liver, 2 nd ed. Abingdon: Taylor & Francis; 1998: 347. 39. Cai S,Huo T, Xu J, Lu X, Zheng S, Li F. Effect of mitiglinide on Streptozotocin-induced experimental
type 2 diabetic rats: A urinary metabonomics study based on ultra-performance liquid chromatography
—tandem mass spectrometry. J Chromatogr B Analyt Technol Biomed Life Sci. 2009; 877: 3619–
3624. doi:10.1016/j.jchromb.2009.08.044PMID:19748326
40. Li H, Ni Y, Su M, Qiu Y, Zhou M, Qiu M, et al. Pharmacometabonomic phenotyping reveals different re-sponses to xenobiotic intervention in rats. J Proteome Res. 2007; 6: 1364–1370. PMID:17311441
41. Sautin YY, Nakagawa T, Zharikov S, Johnson RJ. Adverse effects of the classic antioxidant uric acid in adipocytes: NADPH oxidase-mediated oxidative/nitrosative stress. Am J Physiol cell Physiol, 2007; 293: C584–C596. PMID:17428837
42. Yu MA, Sánchez-Lozada LG, Johnson RJ, Kang DH. Oxidative stress with an activation of the renin-an-giotensin system in human vascular endothelial cells as a novel mechanism of uric acid-induced endo-thelial dysfunction. J Hypertens. 2010; 28: 1234–1242. PMID:20486275
43. Corry DB, Eslami P, Yamamoto K, Nyby MD, Makino H, Tuck ML Uric acid stimulates vascular smooth muscle cell proliferation and oxidative stress via the vascular renin-angiotensin system. J Hypertens. 2008; 26: 269–275. doi:10.1097/HJH.0b013e3282f240bfPMID:18192841
44. Johnson RJ, Nakagawa T, Sanchez-Lozada LG, Shafiu M, Sundaram S, Le M, et al. Sugar, uric acid, and the etiology of diabetes and obesity. Diabetes. 2013; 62: 3307–3315. doi:10.2337/db12-1814 PMID:24065788
46. Bao Y, Zhao T, Wang X, Qiu Y, Su M, Jia W, et al. Metabonomic variations in the drug-treated type 2 di-abetes mellitus patients and healthy volunteers. J Proteome Res. 2009; 8: 1623–1630. doi:10.1021/ pr800643wPMID:19714868
47. Miric DJ, Kisic BB, Zoric LD, Mitic RV, Miric BM, Dragojevic IM, et al. Xanthine oxidase and lens oxida-tive stress markers in diabetic and senile cataract patients. J Diabetes Complications. 2013; 27: 171–
176. doi:10.1016/j.jdiacomp.2012.09.005PMID:23142692
48. Schretlen DJ, Inscore AB, Jinnah HA, Rao V, Gordon B, Pearlson GD, et al. Serum uric acid and cogni-tive function in community-dwelling older adults. Neuropsychology. 2007; 21: 136–140. PMID: 17201536