Conservative Tests under Satisficing Models
of Publication Bias
Justin McCrary1,2‡, Garret Christensen3,4*, Daniele Fanelli5
1School of Law, University of California, Berkeley, California, United States of America,2National Bureau of Economic Research (NBER), Cambridge, Massachusetts, United States of America,3Berkeley Initiative for Transparency in the Social Sciences (BITSS), University of California, Berkeley, California, United States of America,4Berkeley Institute for Data Science (BIDS), University of California, Berkeley, California, United States of America,5Meta-Research Innovation Center at Stanford (METRICS), Stanford University, Stanford, California, United States of America
‡This author is the primary author of this work. *[email protected]
Abstract
Publication bias leads consumers of research to observe a selected sample of statistical estimates calculated by producers of research. We calculate critical values for statistical significance that could help to adjust after the fact for the distortions created by this selection effect, assuming that the only source of publication bias is file drawer bias. These adjusted critical values are easy to calculate and differ from unadjusted critical values by approxi-mately 50%—rather than rejecting a null hypothesis when the t-ratio exceeds 2, the analysis suggests rejecting a null hypothesis when the t-ratio exceeds 3. Samples of published social science research indicate that on average, across research fields, approximately 30% of published t-statistics fall between the standard and adjusted cutoffs.
Introduction
A natural tendency in scientific work is for statistically significant results to be reported with greater likelihood than insignificant results.
In fields like economics or psychology, where hypothesis testing plays an important role in establishing the robustness of estimated effects, this tendency may result in a systematic selec-tion effect, whereby published estimates are more extreme than the underlying populaselec-tion effects. Rosenthal famously notes that in the“extreme view of this problem, the‘file drawer problem,’. . .the journals are filled with the 5% of the studies that show type I errors, while the file drawers back at the lab are filled with the 95% of the studies that show nonsignificant . . .results.”(See p. 638 in [1].) This fundamental problem has been widely acknowledged and appreciated in economics [2–13]. In recent years the issue has received renewed attention in finance [14–18], in statistics [19–22], in political science [23,24], in psychology [1,25–27], in medicine [28–30], and in other fields. Publication bias in medicine is a sufficiently serious con-cern that the U.S. Congress first mandated trial registration in 1997, the clinicaltrials.gov trial a11111
OPEN ACCESS
Citation:McCrary J, Christensen G, Fanelli D (2016) Conservative Tests under Satisficing Models of Publication Bias. PLoS ONE 11(2): e0149590. doi:10.1371/journal.pone.0149590
Editor:Daniele Marinazzo, Universiteit Gent, BELGIUM
Received:October 13, 2015
Accepted:February 1, 2016
Published:February 22, 2016
Copyright:© 2016 McCrary et al. This is an open access article distributed under the terms of the
Creative Commons Attribution License, which permits unrestricted use, distribution, and reproduction in any medium, provided the original author and source are credited.
Data Availability Statement:All data used in the paper is collected from secondary publications (there was no original data collection), and all data is presented directly in the figure in the full text. Data from [13] is available athttps://www.aeaweb.org/aej/ app/data/2015-0044_data.zipData from [39–45] were obtained directly from figures or tables in the publications themselves.
Funding:The authors have no support or funding to report.
registry was created in 2000, expanded in 2007, and the NIH recently sought public comment on a further expansion of the requirements of trial results reporting [31].
If a file drawer bias leads statistically significant results to be more prevalent in the published literature than they would be in the absence of this bias, then the threshold for the results of sta-tistical tests to be significant should be higher than it otherwise would be to maintain the desired type I error rate. This intuitive idea motivates the analysis of this paper. We show that if a finding’s conditional publication probability given the result of a statistical test is a step function, with step occurring at the conventional critical value for the test—in other words, a satisficing model of publication bias—then an adjustment to conventional critical values restores the intended type I error rate (significance level) of the test among the sample of pub-lished papers. These adjusted critical values are simple to calculate and require only access to a table of the values of the original test statistic.
We give examples of adjusted critical values for various test statistics under conventional levels of significance. These adjusted critical values are an average of 49% larger than the corre-sponding unadjusted critical values. For example, if authors use two-tailed t-tests to gauge the robustness of their findings, and only submit findings with t-test values above 1.96 in absolute value, then 5 percent of the t-tests observed by the editor will exceed 3.02 in absolute value. An editor seeking to counteract the selection effect created by authors’behavior, then, would use a critical value of 3.02. Further, suppose a literature contains independent estimates of the same quantity, with authors testing the same null hypothesis using the t-test, and that 95 percent of the t-statistics in the literature are between 2 and 3 in absolute value, with the remainder above. Despite this (hypothetical) literature of significant results, there would in fact be little evidence against the null hypothesis, if file drawer bias prevented the submission of insignificant esti-mates. (Naturally, this game between authors and editors can be interpreted to apply equally to editors and readers, with readers (editors) playing the role of the editors (authors).)
The approach taken here in addressing publication bias is to restore the intended type I error rate of hypothesis tests by adjusting the critical value. The approach we propose might help to assess the reliability of an existing literature, and could complement current methods to assess and correct retrospectively for publication bias. Current approaches typically apply to meta-analysis and make use of funnel plots and related meta-regression techniques aimed at estimating the possible presence of file-drawer effects and recovering point estimates for the population average of the underlying estimates [32–34]. These latter methods are relatively narrow in scope and are sensitive to deviations from their underlying assumptions, for example by requiring large sample sizes and low heterogeneity [35].
Researchers have addressed the issue of hypothesis testing in the context of publication bias [15], but have focused on selection rules, such as specification searching and data mining, that are more pernicious than satisficing models. For the problems created by file drawer bias, a satisficing model may be realistic. Other types of publication bias may not be consistent with satisficing models, and the results of this paper do not apply to such problems. One way to understand the contribution of the present paper is that it clarifies that a researcher who insists on truly decisive rejections of null hypotheses (e.g., t-tests greater than 5 in absolute value) must implicitly believe in more troublesome forms of publication bias than simple file drawer bias (setting aside issues regarding inappropriate standard error calculation).
Methods
Suppose authors calculate a test statistic,T, and plan to reject at the 1−αpercent level a given
zero ifTexceedsc0.95= 1.962. Let the distribution function ofTunder the null hypothesis be
denotedF() and letF−1() denote the corresponding quantile function. (Throughout, we will assume that the quantile function is uniquely defined, i.e.,F() is strictly monotonic. We also assume the null hypothesis is true, though this is also the case with all regularly calculated p-values and test statistics.) The critical valuec1−αis given byF
−1(1
−α), because then the
proba-bility of false rejection isP(T>c1−α) = 1−F(F−1(1−α)) =α.
Throughout, we assume that authors submit statistically insignificant results with probabil-ityπ0, but submit statistically significant results with probabilityπ1. Formally, we state
ASSUMPTION1.
PðD¼1jTÞ ¼p01ðTc1
aÞ þp11ðT>c1 aÞ
whereDequals one if a study is submitted and equals zero otherwise. Thus, the conditional probability of submission is a step function, with step occurring atc1−αand with step heightπ1
−π0. A few remarks are in order. First, Assumption 1 would be unreasonable if different
indi-viduals had differing views regarding the significance level at which tests should be conducted. However, as there is a clear default ofα= 0.05, the assumption seems reasonable. Second, while
Assumption 1 simplifies the analysis, it is not the only condition under which the results derived in the next section obtain. In particular, it is not important that the conditional proba-bility be constant to the left ofc1−α. However, it is important that it be constant to the right of c1−α. That the submission probability be constant to the right ofc1−αis in fact the essence of a satisficing model of publication bias: there exists a threshold at which an estimate becomes sta-tistically significant, and authors are just as likely to submit a paper with a test statistic ofT=c1
−α+aas they are to submit a paper with a test statistic ofT=c1−α+b, forb>a>0.
Results
Under Assumption 1, the distribution function of submitted test statistics is given by
GðtÞ ¼
(p0
pFðtÞ iftc1 a
1 p1 pð
1 FðtÞÞ ift>c
1 a
ð1Þ
whereπis the unconditional probability of submission:π=απ1+ (1−α)π0. The calculation is a straightforward application of Bayes’rule, as follows: defineG(t) =P(Tt|D= 1). Bayes’rule impliesGðtÞ ¼PðD¼1jTtÞPðTtÞ
PðD¼1Þ . In thefirst case,fixtc1−α. Substituting, wefindGðtÞ ¼
p0
pFðtÞ:
In the second case,fixt>c1−α.G(t) = 1−P(T>t|D= 1). Bayes implies
1 PðT>tjD¼1Þ ¼1 PðD¼1jT>tÞPðT>tÞ
PðD¼1Þ . Substituting, we haveGðtÞ ¼1
p1
pð
1 FðtÞÞ, as
above. Note thatEq (1)implies a test of Assumption 1 that is implementable using meta-ana-lytic data, as by Card and Krueger [8].
By invertingG(), we can derive a formula for critical values that adjust for type I error rate distortions induced by file drawer bias.
LEMMA.G−1(1
−α) =F−1(1−απ/π1) =c1 −απ/π1
PROOF. For everyt,G(t)F(t). Therefore,G−1(1
−α)c1−α, and we have
1 a¼Gðd
1 aÞ ¼1 p
1
p
1 F d
1 a
ð Þ
ð Þ , Fðd1 aÞ ¼1 ap=p1
whered1−αG −1(1
−α).
the null hypothesis and Assumption 1, such a procedure will guarantee a testing procedure with type I error rateα. (One could choose any type I error rate here, not justα, as this refers to
only the type I error rate among the submitted test statistics, which is clearly a selected sample. We chooseαfor its intuitive appeal, keeping the level of false positives identical across the
entire universe of tests and the selected sample of submitted tests.)
This conclusion would seem to be of little practical consequence, since neitherπ1norπ0are known. However, it is straightforward to derive bounds under a worst-case scenario.
PROPOSITION. Under the null hypothesis and Assumption 1, a test with type I error rate no more thanαis obtained by utilizing a critical value ofF−1(1
−α2).
PROOF. SinceG() is increasing inπ0, an upper bound on the critical value is obtained by set-tingπ0= 0. SinceG−1(1−α)>F−1(1
−α), we have
1 a¼Gðd
1 aÞ ¼1
1
a
1 F d
1 a
, Fðd
1 aÞ ¼1 a
2
whered
1 a supp0;p1G
1
ð1 aÞ.
Examples
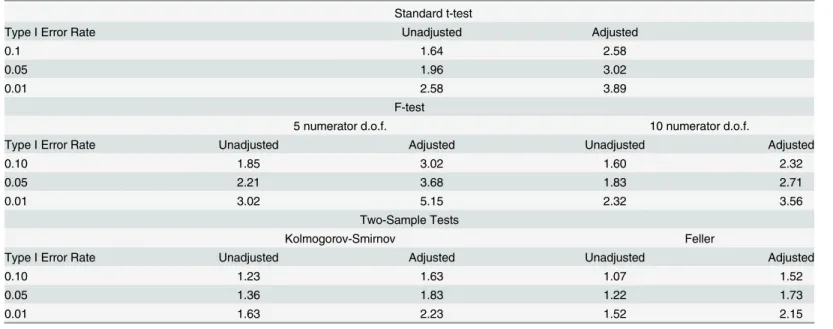
Table 1lists unadjusted and adjusted critical values for selected tests, where the adjusted critical
values are those of the proposition. As discussed, under a satisficing model of publication bias, use of these critical values guarantees that the tests have type I error rate of at most 5 percent. The tests considered are two-tailed t-tests, F-tests with 5 and 10 numerator degrees of freedom and a large denominator degrees of freedom, and two types of nonparametric two-sample tests (Kolmogorov-Smirnov and Feller). All tests are of the form“reject ifT>c1−α,”for someTand somec1−α.
Table 1. Unadjusted and Adjusted Critical Values, Selected Testing Procedures.
Standard t-test
Type I Error Rate Unadjusted Adjusted
0.1 1.64 2.58
0.05 1.96 3.02
0.01 2.58 3.89
F-test
5 numerator d.o.f. 10 numerator d.o.f.
Type I Error Rate Unadjusted Adjusted Unadjusted Adjusted
0.10 1.85 3.02 1.60 2.32
0.05 2.21 3.68 1.83 2.71
0.01 3.02 5.15 2.32 3.56
Two-Sample Tests
Kolmogorov-Smirnov Feller
Type I Error Rate Unadjusted Adjusted Unadjusted Adjusted
0.10 1.23 1.63 1.07 1.52
0.05 1.36 1.83 1.22 1.73
0.01 1.63 2.23 1.52 2.15
Note: Table reports critical values, unadjusted and adjusted, for selected commonly utilized testing procedures. Entries for t-test are absolute values of critical values. Entries for F-test are for denominator degrees of freedom equal to 100,000 See text for details.
The t- and F-test distributions are standard [36] and critical values are calculated using sta-tistical software. The Kolmogorov-Smirnov two-sample test statistic is given byT¼
ffiffiffi n
p
supxjH^
1ðxÞ
^
H2ðxÞjwhere
^
H1ðxÞand
^
H2ðxÞare the empirical distribution functions for
two independent samples of sizesn1andn2drawn, under the null hypothesis, from the same
distribution, and wheren=n1n2/(n1+n2). Under the null, the distribution function forT
con-verges tot7!1 2P1
j¼1ð 1Þ
j 1
expð j2
t2
Þ(critical values for this distribution are taken from the tabulation in [37]). The Feller two-sample test statistic isT¼pffiffiffinsup
xfH^1ðxÞ
^
H2ðxÞg,
with limiting distribution function oft7!1−exp(−2t2) (Theorem 4, [38]). Critical values for
this distribution are calculated directly.
Looking overTable 1, it is apparent that the adjusted critical values for the tests considered are 30 to 70 percent larger than the corresponding unadjusted critical values. For example, the adjusted critical values for the common t-test are about 50 percent larger than their unadjusted counterparts. For a test of 5 percent type I error rate, we reject the null hypothesis if the abso-lute value of the t-ratio exceeds 1.96. Adjusting for file drawer bias, we reject if it exceeds 3.02. Adjusted critical values for the F-test with 10 numerator degrees of freedom are similarly about 50 percent larger than their unadjusted counterparts, while those for the F-test with 5 numera-tor degrees of freedom are 60-70 percent bigger.
Statistics from Published Papers
To gauge the practical difference in published research between standard and adjusted cutoffs, we probed the literature for data on the distribution of t-statistics to be compared to the adjusted and unadjusted cutoffs for two-tailed tests at theα= .05 level. Our search yielded
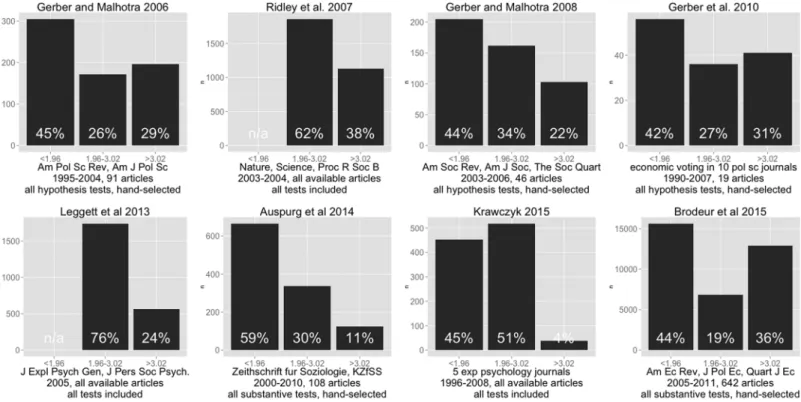
eight studies with publicly available data (or data available in the original figures themselves) in the behavioral and social sciences and one from biology that assessed the prevalence of the file-drawer problem by examining the distribution of t-values or equivalent statistics [13,39–45]. These studies differed widely in key methodological choices including: discipline, sampling strategy (e.g. some surveyed specific journals, others specific topics), sample size, historical period considered, and in whether they had extracted all available statistics or hand-selected substantive ones. This heterogeneity precludes the calculation of a meta-analytical summary. Nonetheless, this collection of published results yields a relatively coherent picture by suggest-ing that, in the behavioral and social sciences, on average across studies 31% of all test statistics might lie between the adjusted and unadjusted cutoffs (N studies = 6, excluding two studies which lacked data for t-statistics below 1.96) and 22% lie above the adjusted cutoff (N = 6, range: 4%-36%). Looking only at the fraction of test statistics above the standard threshold, across studies an average of 62% lie between the adjusted and unadjusted cutoffs (N = 8) and an average of 38% lie above the adjusted cutoff (N = 8, range: 7%-65%) (Fig 1).
Discussion
Intuitively, the results reported here are due to the narrow tails of the asymptotic distribution of most test statistics. For example, most econometric test statistics are asymptotically normal. The tails of the normal distribution decline so rapidly that, even if only significant results are observed, the chances are still quite good that a randomly chosen draw above the critical value will be close to the critical value. Thus, adjustments for the types of publication bias discussed in this paper may be small.
testing is common and where we have been able to find reasonably sized samples of published research. We conjecture that our method would make a modest difference in fields that typi-cally work with large data, whilst it might have a significant impact in fields in which small sample sizes and low signal-to-noise ratios are common. This conjecture is supported by the data we have gauged from the literature: t-statistic distributions from psychology—a discipline that is believed to have relatively low reproducibility rates (see [46])—tend to have a higher concentration in the 1.96-3.02 range compared to other social sciences.
The results obtained in this paper are highly specific in at least a few other regards. First, the results in this paper do not apply to settings whereF() fails to be the distribution function of the test statistic in question. This would occur, for example, in settings where regression stan-dard errors are calculated incorrectly [47–49].
Second, they do not pertain to specification searching. For example, suppose we model spec-ification searching in the following way. Imagine that authors estimateJindependent models, where the discrepancy betweenJand the true number of estimated models summarizes the dependence between the estimates, and that authors report only the specification with the most significant results. In that case, the critical value that would undo the selection effect of the specification searching would beF 1
ð ffiffiffiffiffiffiffiffiffiffiffi
1 a
J p
Þ, whereF() is the distribution function for the test statistic in question. This critical value is only bounded if it is possible to boundJ. This gives rise to the emphasis by Sullivan, Timmermann, and White [16] on the ability of the ana-lyst to specify theuniverseof tests conducted by a single researcher, or afield of researchers [6]. Fig 1. Distribution of t-statistics in Research Literature.Figure shows the distribution of t-statistics, as reported in the literature, that would lie below, between, or above the non-adjusted and adjusted threshold. Data were obtained from independent publications, which are referenced above each graph, and were either provided by the original authors or were re-digitized from histograms provided in the texts. Below each graph are indicated the following key methodological characteristics: study sampling strategy (i.e. specific journals or specific field), year range, number of articles included, and selection strategy for the statistics (i.e. whether, from each of the included articles, the authors had taken all available statistics, only those referring to explicit hypotheses, or only a subsample of“substantive”results selected by human coders).
Third, a related point is the interpretation of any individual test statistic within a paper or within a literature. While a literature may collectively be biased by non-publication of null results, each individual test that is published may still show unbiased results on its own. In this case, our method in some sense requires a stricter test (lower type I error rate, and lower power) than intended. However, given the evidence that even individual papers with multiple experiments suffer from publication bias within the individual papers, we believe our method is still useful. (See the test for excess significance, developed in [50] and applied in [51] and [52].)
Fourth, as mentioned previously, one could modify our method and develop a different modified cutoff by choosing a different type I error rate among the selected sample of pub-lished results, not just the sameαthat is used in submission/publication to generate the
satisifi-cing model of publication bias. The reason we useαis for its intuitive appeal, keeping the level
of false positives identical across the entire universe of tests and the selected sample of submit-ted tests, restoring the originally intended type I error rate.
Finally, we believe that our approach could be of use in fields where file-drawer effects are believed to be pervasive, by offering a simple rule of thumb to adjust after the fact for the rate of false positives. However, this method is unlikely to represent an active remedy to the prob-lem of publication bias, as it may encourage a“t-ratio arms race,”whereby authors understand that editors are suspicious of t-ratios just above 2, and adjust their submission behavior accord-ingly. Authors would become ever more selective in their submissions as editors became ever more critical,ad infinitum. In light of these considerations, perhaps the best way to understand the result described above is as a useful rule of thumb to employ, assuming that few other peo-ple deviate from standard practice.
Conclusion
In this paper, we have outlined a simple method for restoring the intended type I error rate of tests used by consumers of research (e.g., editors, readers) when producers of research (e.g., authors, editors) select results based on the statistical significance of tests, and where the selec-tion follows a satisficing rule. The analysis shows that this selecselec-tion effect in fact distorts the size of test statistics by approximately 50% and may be eliminated using adjusted critical values. These adjusted critical values are particularly simple to implement and require only a (detailed) table giving the distribution of the (unselected) test statistic under the null hypothesis. A lead-ing example of the application of this result is two-tailed t-tests, where a test with type I error rate of 5 percent involves a critical value of 1.96. Distortions created by file drawer bias are adjusted for by using an adjusted critical value of 3.02. Samples of published social science research indicate that on average, across research fields approximately 30% of t-statistics are between the standard and adjusted critical values, and might thus be affected by the proposed method.
Author Contributions
Conceived and designed the experiments: JM. Performed the experiments: JM. Analyzed the data: GC DF. Contributed reagents/materials/analysis tools: JM GC DF. Wrote the paper: JM GC DF.
References
2. Leamer EE. Specification Searches: Ad Hoc Inference with Nonexperimental Data. John Wiley & Sons Inc; 1978.
3. Leamer EE. Model Choice and Specification Analysis. In: Griliches Z, Intriligator MD, editors. The Handbook of Econometrics. vol. 1. North-Holland Amsterdam; 1983. p. 285–330.
4. Cooley TF, LeRoy SF. Identification and Estimation of Money Demand. The American Economic Review. 1981;p. 825–844.
5. Lovell MC. Data Mining. The Review of Economics and Statistics. 1983; 65(1):pp. 1–12. Available from:
http://www.jstor.org/stable/1924403doi:10.2307/1924403
6. Denton FT. Data Mining as an Industry. The Review of Economics and Statistics. 1985;p. 124–127. doi:10.2307/1928442
7. De Long JB, Lang K. Are All Economic Hypotheses False? Journal of Political Economy. 1992;p. 1257–1272. doi:10.1086/261860
8. Card D, Krueger AB. Time-Series Minimum-Wage Studies: A Meta-Analysis. The American Economic Review. 1995;p. 238–243.
9. Ashenfelter O, Harmon C, Oosterbeek H. A Review of Estimates of the Schooling/Earnings Relation-ship, with Tests for Publication Bias. Labour Economics. 1999; 6(4):453–470. doi: 10.1016/S0927-5371(99)00041-X
10. Ashenfelter O, Greenstone M. Estimating the Value of a Statistical Life: The Importance of Omitted Var-iables and Publication Bias. The American Economic Review. 2004; 94(2):pp. 454–460. Available from:http://www.jstor.org/stable/3592927doi:10.1257/0002828041301984
11. Rose AK, Stanley TD. A Meta-Analysis of the Effect of Common Currencies on International Trade. Journal of Economic Surveys. 2005; 19(3):347–365. doi:10.1111/j.0950-0804.2005.00251.x
12. Donohue JJ III, Wolfers J. Uses and Abuses of Empirical Evidence in the Death Penalty Debate. Stan-ford Law Review. 2005; 58:791.
13. Brodeur A, Lé M, Sangnier M, Zylberberg Y. Star Wars: The Empirics Strike Back. American Economic Journal: Applied Economics. 2016 January; 8(1):1–32.
14. Sullivan R, Timmermann A, White H. Data-Snooping, Technical Trading Rule Performance, and the Bootstrap. The Journal of Finance. 1999; 54(5):1647–1691. Available from:http://dx.doi.org/10.1111/ 0022-1082.00163doi:10.1111/0022-1082.00163
15. White H. A Reality Check for Data Snooping. Econometrica. 2000; 68(5):1097–1126. Available from:
http://dx.doi.org/10.1111/1468-0262.00152doi:10.1111/1468-0262.00152
16. Sullivan R, Timmermann A, White H. Dangers of Data Mining: The Case of Calendar Effects in Stock Returns. Journal of Econometrics. 2001; 105(1):249–286. Available from:http://www.sciencedirect. com/science/article/pii/S030440760100077Xdoi:10.1016/S0304-4076(01)00077-X
17. Timmermann A. Data Mining in Finance. In: Garrett I, editor. The Blackwell Encyclopedia of Manage-ment. vol. 4. 2nd ed. London: Blackwell Publishing; 2006. p. 35–37.
18. Harvey CR, Liu Y, Zhu H.. . .And the Cross-Section of Expected Returns. The Review of Financial
Studies. 2015;Forthcoming.
19. Iyengar S, Greenhouse JB. Selection Models and the File Drawer Problem. Statistical Science. 1988 February; 3(1):109–117. doi:10.1214/ss/1177013019
20. Rosenthal R, Rubin DB. Selection Models and the File Drawer Problem: Comment: Assumptions and Procedures in the File Drawer Problem. Statistical Science. 1988;p. 120–125.
21. Hedges LV. Selection Models and the File Drawer Problem: Comment. Statistical Science. 1998; 3 (1):118–120. doi:10.1214/ss/1177013013
22. Iyengar S, Greenhouse JB. Selection Models and the File Drawer Problem: Rejoinder. Statistical Sci-ence. 1998 Februrary; 3(1):133–135. doi:10.1214/ss/1177013019
23. Gerber AS, Green DP, Nickerson D. Testing for Publication Bias in Political Science. Political Analysis. 2001; 9(4):385–392. doi:10.1093/oxfordjournals.pan.a004877
24. Franco A, Malhotra N, Simonovits G. Publication Bias in the Social Sciences: Unlocking the File Drawer. Science. 2014; 345(6203):1502–1505. doi:10.1126/science.1255484PMID:25170047
25. Simmons JP, Nelson LD, Simonsohn U. False-Positive Psychology: Undisclosed Flexibility in Data Col-lection and Analysis Allows Presenting Anything as Significant. Psychological Science. 2011; 22 (11):1359–1366. doi:10.1177/0956797611417632PMID:22006061
27. Simonsohn U, Nelson LD, Simmons JP. P-curve: A Key to the File-Drawer. Journal of Experimental Psychology: General. 2014; 143(2):534. doi:10.1037/a0033242
28. Chan AW, Hróbjartsson A, Haahr MT, Gøtzsche PC, Altman DG. Empirical Evidence for Selective Reporting of Outcomes in Randomized Trials: Comparison of Protocols to Published Articles. JAMA. 2004; 291(20):2457–2465. doi:10.1001/jama.291.20.2457PMID:15161896
29. De Angelis CD, Drazen JM, Frizelle FA, Haug C, Hoey J, Horton R, et al. Is This Clinical Trial Fully Reg-istered?–A Statement from the International Committee of Medical Journal Editors. New England Jour-nal of Medicine. 2005; 352(23):2436–2438. doi:10.1056/NEJMe058127PMID:15911780
30. Ioannidis JP. Why Most Published Research Findings Are False. PLoS Medicine. 2005; 2(8):e124. doi:
10.1371/journal.pmed.0020124PMID:16060722
31. National Institutes of Health. HHS and NIH take steps to enhance transparency of clinical trial results; 2014. Available from:http://www.nih.gov/news/health/nov2014/od-19.htm
32. Hedges LV. Modeling Publication Selection Effects in Meta-Analysis. Statistical Science. 1992;p. 246–
255. doi:10.1214/ss/1177011364
33. Peters JL, Sutton AJ, Jones DR, Abrams KR, Rushton L. Comparison of Two Methods to Detect Publi-cation Bias in Meta-Analysis. Journal of the American Medical Association. 2006; 295(6):676–680. doi:
10.1001/jama.295.6.676PMID:16467236
34. Stanley T, Doucouliagos H. Meta-regression approximations to reduce publication selection bias. Research Synthesis Methods. 2014; 5(1):60–78. doi:10.1002/jrsm.1095PMID:26054026
35. Peters JL, Sutton AJ, Jones DR, Abrams KR, Rushton L, Moreno SG. Assessing publication bias in meta-analyses in the presence of between-study heterogeneity. Journal of the Royal Statistical Society: Series A (Statistics in Society). 2010; 173(3):575–591. doi:10.1111/j.1467-985X.2009.00629.x
36. Goldberger AS. A Course in Econometrics. Harvard University Press; 1991.
37. Smirnov N. Table for Estimating the Goodness of Fit of Empirical Distributions. The Annals of Mathe-matical Statistics. 1948;p. 279–281. doi:10.1214/aoms/1177730256
38. Feller W. On the Kolmogorov-Smirnov Limit Theorems for Empirical Distributions. The Annals of Mathe-matical Statistics. 1948;p. 177–189. doi:10.1214/aoms/1177730243
39. Ridley J, Kolm N, Freckelton RP, Gage MJG. An Unexpected Influence of Widely Used Significance Thresholds on the Distribution of Reported P-values. Journal of Evolutionary Biology. 2007; 20 (3):1082–1089. Available from:http://dx.doi.org/10.1111/j.1420-9101.2006.01291.xdoi:10.1111/j. 1420-9101.2006.01291.xPMID:17465918
40. Gerber A, Malhotra N. Do Statistical Reporting Standards Affect What Is Published? Publication Bias in Two Leading Political Science Journals. Quarterly Journal of Political Science. 2008; 3(3):313–326. Available from:http://dx.doi.org/10.1561/100.00008024doi:10.1561/100.00008024
41. Gerber AS, Malhotra N. Publication Bias in Empirical Sociological Research: Do Arbitrary Significance Levels Distort Published Results? Sociological Methods & Research. 2008 August; 37(1):3–30. doi:10. 1177/0049124108318973
42. Gerber AS, Malhotra N, Dowling CM, Doherty D. Publication Bias in Two Political Behavior Literatures. American Politics Research. 2010; 38(4):591–613. Available from:http://apr.sagepub.com/content/38/ 4/591.abstractdoi:10.1177/1532673X09350979
43. Leggett NC, Thomas NA, Loetscher T, Nicholls ME. The Life of p:“Just Significant”Results Are on the Rise. The Quarterly Journal of Experimental Psychology. 2013; 66(12):2303–2309. doi:10.1080/ 17470218.2013.863371PMID:24205936
44. Krawczyk M. The Search for Significance: A Few Peculiarities in the Distribution of P Values in Experi-mental Psychology Literature. PLOS ONE. 2015; 10(6):e0127872. doi:10.1371/journal.pone.0127872
PMID:26061881
45. Auspurg K, Hinz T, Schneck A. Prevalence and Risk-Factors of Publication Bias in German Sociology. Kölner Zeitschrift für Soziologie und Sozialpsychologie. 2014 December; 66(4):549–573. doi:10.1007/ s11577-014-0284-3
46. Open Science Collaboration. Estimating the Reproducibility of Psychological Science. Science. 2015; 349 (6251). Available from:http://www.sciencemag.org/content/349/6251/aac4716.abstract
47. Moulton BR. An Illustration of a Pitfall in Estimating the Effects of Aggregate Variables on Micro Units. The Review of Economics and Statistics. 1990;p. 334–338. doi:10.2307/2109724
48. Bertrand M, Duflo E, Mullainathan S. How Much Should We Trust Differences-In-Differences Esti-mates? The Quarterly Journal of Economics. 2004; 119(1):249–275. doi:10.1162/
49. Conley TG, Taber CR. Inference with“Difference in Differences”with a Small Number of Policy Changes. The Review of Economics and Statistics. 2011; 93(1):113–125. doi:10.1162/REST_a_ 00049
50. Ioannidis JP, Trikalinos TA. An exploratory test for an excess of significant findings. Clinical Trials. 2007; 4(3):245–253. doi:10.1177/1740774507079441PMID:17715249
51. Francis G. The frequency of excess success for articles in Psychological Science. Psychonomic bulle-tin & review. 2014; 21(5):1180–1187. doi:10.3758/s13423-014-0601-x