Quantifying Post- Laser Ablation Prostate
Therapy Changes on MRI via a
Domain-Specific Biomechanical Model:
Preliminary Findings
Robert Toth1,2*, Dan Sperling3, Anant Madabhushi1
1Department of Biomedical Engineering, Case Western Reserve University, Cleveland, OH, United States of America,2Toth Technology LLC, Long Valley, NJ, United States of America,3Sperling Prostate Center, Manhattan, NY, United States of America
*robtoth@tothtechnology.com
Abstract
Focal laser ablation destroys cancerous cells via thermal destruction of tissue by a laser. Heat is absorbed, causing thermal necrosis of the target region. It combines the aggressive benefits of radiation treatment (destroying cancer cells) without the harmful side effects (due to its precise localization). MRI is typically used pre-treatment to determine the tar-geted area, and post-treatment to determine efficacy by detecting necrotic tissue, or tumor recurrence. However, no system exists to quantitatively evaluate the post-treatment effects on the morphology and structure via MRI. To quantify these changes, the pre- and post-treatment MR images must first be spatially aligned. The goal is to quantify (a) laser-induced based changes, and (b) changes in MRI parameters post-treatment. The shape-based changes may be correlated with treatment efficacy, and the quantitative effects of laser treatment over time is currently poorly understood. This work attempts to model changes in gland morphology following laser treatment due to (1) patient alignment, (2) changes due to surrounding organs such as the bladder and rectum, and (3) changes due to the treatment itself. To isolate the treatment-induced shape-based changes, the changes from (1) and (2) are first modeled and removed using a finite element model (FEM). A FEM models the physical properties of tissue. The use of a physical biomechanical model is important since a stated goal of this work is to determine the physical shape-based changes to the prostate from the treatment, and therefore only physical real deformations are to be allowed. A second FEM is then used to isolate the physical, shape-based, treatment-induced changes. We applied and evaluated our model in capturing the laser treatment-induced changes to the prostate morphology on eight patients with 3.0 Tesla, T2-weighted MRI, acquired approximately six months following treatment. Our results suggest the laser treat-ment causes a decrease in prostate volume, which appears to manifest predominantly at the site of ablation. After spatially aligning the images, changes to MRI intensity values are clearly visible at the site of ablation. Our results suggest that our new methodology is able to capture and quantify the degree of laser-induced changes to the prostate. The quantitative a11111
OPEN ACCESS
Citation:Toth R, Sperling D, Madabhushi A (2016) Quantifying Post- Laser Ablation Prostate Therapy Changes on MRI via a Domain-Specific Biomechanical Model: Preliminary Findings. PLoS ONE 11(4): e0150016. doi:10.1371/journal. pone.0150016
Editor:Alena Talkachova, University of Minnesota, UNITED STATES
Received:September 2, 2015
Accepted:February 8, 2016
Published:April 18, 2016
Copyright:© 2016 Toth et al. This is an open access article distributed under the terms of theCreative Commons Attribution License, which permits unrestricted use, distribution, and reproduction in any medium, provided the original author and source are credited.
Data Availability Statement:All relevant data are available from Dryad (doi:10.5061/dryad.f2v0k).
measurements reflecting of the deformation changes can be used to track treatment response over time.
Introduction
Background and Motivation
Following a diagnosis of prostate cancer, several treatment options are available. These include brachytherapy, focal laser ablation therapy, hormonal therapy, external beam radiation ther-apy, and radical prostatectomy. Over 90% of low risk prostate cancer is currently treated with radical treatment [1], which causes significant quality of life issues and side effects such as incontinence, impotence, and damage to surrounding organs [2–4]. One alternative to radical treatment is active surveillance, which involves actively monitoring disease related changes to assess whether or not treatment should be performed, in order to mitigate the quality of life issues associated with radical treatment.
Focal laser ablation has recently emerged as an extremely promising prostate cancer treat-ment since it includes the best attributes of radical treattreat-ment (the ability to eradicate cancer cells), and its precision allows one to minimize the risk of side effects [1–6]. Focal laser ablation causes thermal destruction of tissue by a laser [1]. Radiation from a laser is absorbed by the tis-sue, causing homogeneous thermal necrosis [2]. Due to the lack of excess vascularity in the prostate (which could cause unwanted excess conduction of heat), prostate cancer is well-suited for focal laser ablation treatment [6]. Focal laser ablation for prostate cancer has the additional advantages of ease of use, and lower cost than some radical treatments [1].
However, since focal laser ablation is such a new technology, few studies have looked at the long term effects of such treatment for prostate cancer. It is possible that studying early treat-ment changes on imaging may help to identify markers associated with longer term prognosis [7]. As such, a quantitative method for systematically and quantitatively tracking treatment related changes over time could potentially be used to predict longer term outcome.
MRI is used to both guide the focal laser ablation treatment, and to evaluate its efficacy [2,
4–7]. Prior to treatment, MRI is used to locate the tumor or index lesion [2,6], and is used to guide the laser during treatment [2]. Following focal laser ablation, MRI can be used to deter-mine the effect of ablation [5],[7], calculate the size of the ablated lesion [5], detect cancerous tissue [2,4], and detect complications with surrounding organs such as the rectum or neuro-vascular bundle [4]. Raz et al. observed that a contrast-enhanced MRI directly following treat-ment can be used to confirm the treattreat-ment success, or immediately repeat the focal laser ablation during the same session [4]. Only seven days following treatment, hypoperfused lesions (lesions with decreased blood flow) were evident on MRI [3]. Eggener et al. recom-mended that following focal laser ablation, in addition to biopsies, periodic MRI should be per-formed in order to characterize treatment effects [3].
Assuming that MRI can successfully be used to determine treatment efficacy [2,4–7], it stands to reason that quantitatively determining changes on MRI following treatment can be used to systematically track the effects of treatment over time. These quantitative changes on the prostate can manifest as either shape-based or functional changes in the prostate. Shape-based changes are useful in order to determine how the volume of the tumor changes following treatment, and how those changes affect the size and shape of the prostate gland as a whole. Functional changes are useful in order to determine how focal laser ablation changes the tissue properties within the prostate. While T2-weighted MRI intensity values are the result of several (LC130463), the DOD Prostate Cancer Idea
Development Award; the Ohio Third Frontier Technology development Grant, the CTSC Coulter Annual Pilot Grant, the Case Comprehensive Cancer Center Pilot Grant, VelaSano Grant from the Cleveland Clinic, the Wallace H. Coulter Foundation Program in the Department of Biomedical Engineering at Case Western Reserve University. The content is solely the responsibility of the authors and does not necessarily represent the official views of the National Institutes of Health.
underlying physical processes, it is our assumption that functional changes can be character-ized by changes in the intensity values and texture on the MRI in the ablated region. These changes in appearance over time may be due to necrosis of healthy tissue from the laser, or from destruction and elimination of tumor cells from the ablation. Our previous study [7] explored the correlations which may exist between MRI intensity features and functional changes in the prostate. This work aims to compare pre- and post-treatment MRI in order to quantify (a) functional and (b) shape-based changes to the prostate due to the ablation.
Previous work on quantitatively evaluating post-ablation effects on the prostate via MRI [7] involved considering how different MR parameters such as apparent diffusion coefficient change following ablation. What separates this work from previous work [7] is (1) a larger cohort size, (2) the use of a deformable, non-linear, biomechanically constrained registration technique to align the pre-, post-treatment imagery, and (3) the removal of the confounding effects from the bladder and rectum.
In this study, it is assumed that the interventional radiologist outlines the tumor region and ablation zone prior to focal laser ablation, as well as the prostate, bladder, and rectum on each image. In order to determine the effects of focal laser ablation following treatment, the ablated zone must first be identified on the post-treatment MRI. However, a direct spatial mapping is not possible on the follow-up MRI due to:
1. Differences in patient position within the MRI machine.
2. Changes in the prostate due to motion and filling of nearby tissue and organs such as the bladder and rectum.
3. Shape-based changes in the prostate due to the ablation.
As such, a registration algorithm is required to address these changes. The first problem enumerated above can be addressed by a linear (rigid or affine) alignment of the pre-, post-treatment MRI. The second challenge can be addressed by a non-linear (deformable) model specifically designed to simulate the changes to the prostate due to nearby tissues. The third challenge can be addressed by a non-linear alignment of the pre-, post-treatment prostate sur-faces. In fact, as stated previously, an exploration of the third challenge (the shape-based changes due to focal laser ablation) is one of the stated goals of this work.
In order to isolate the shape-based changes due primarily to the ablation induced necrosis, changes in shape due to the motion of nearby organs must be excluded. If the motion due to external forces from nearby organs is completely removed, then the only remaining changes in morphology will be due to the ablation itself. Since this work aims to quantitatively track the changes in morphology from the ablation treatment, the motion of the nearby organs must be taken into account separately. This will allow us to study the deformations induced primarily by the focal laser ablation. While additional confounding factors (such as blood flow) may to the prostate deformation in the period between treatment and followup imaging, in this study we assume that the dominant induced deformation is primarily due to the largest surrounding organs (bladder and rectum) and the treatment itself.
Brock et al. [8] developed a technique for non-linearly aligning the surfaces of two prostates using a FEM. In [9] we employed a FEM to non-linearly align pre-, post-treatment prostate T2-w MRI by simulating the morphological shrinking effects of external beam radiation treat-ment. However, in our previous approach, the morphological effects of the treatment were knowna-priori, and the goal was simply to spatially align the pre- and post-treatment prostate MRI scans. By contrast, in this approach we wish to explore the morphological effects of the focal laser ablation treatment by determining changes in the prostate shape post-treatment. As such, as stated previously we attempt to explicitly isolate only the focal laser ablation induced changes to the prostate. This entails eliminating the deformations from patient motion as well as other, non-treatment related forces, such as the motion of nearby organs.
The overarching goals for this work are firstly to quantify changes in prostate volume post-treatment. Secondly, we will isolate and quantify treatment-induced shape-based changes. Both changes in gross volume as well as localized treatment-induced morphology changes will allow us to understand how laser treatment affects the gland morphology, shape, and size, and may be useful in predicting long term patient outcome. Thirdly, we will quantify differences in MRI intensity values pre-, post-treatment. Changes in MRI parameters following treatment may be useful in determining treatment related effects such as edema and necrosis [7]. As such, predictive models may be generated in order to use early changes in MRI intensity values to predict long term patient outcome. In addition, quantifying these changes will allow clinicians to have a system for quantitatively tracking treatment response over time.
Previous Work and Methodological Contributions
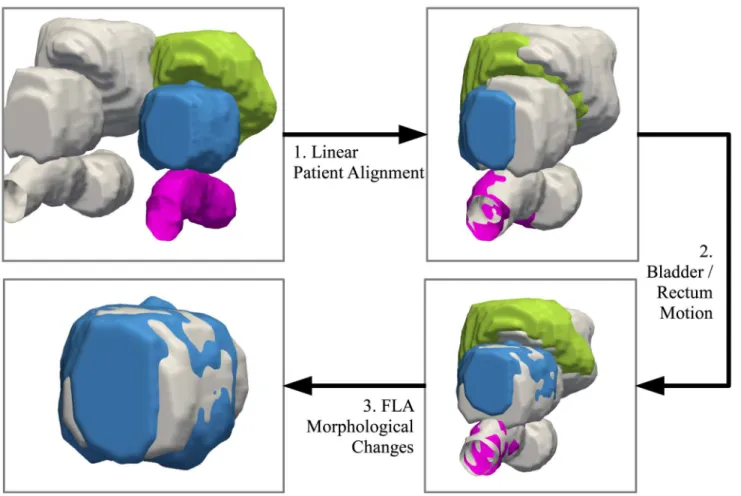
An overview of the registration steps for bringing the pre-, post-treatment scans into spatial alignment is shown inFig 1. To model the deformations due to the patient alignment, a linear registration technique is performed in which translation, rotation, and scaling are used to opti-mally align the pre-, post-treatment. To model the motion of the bladder and rectum, as well as the shape-based changes due primarily to the focal laser ablation, a finite element model (FEM) is used.
In [10], outlines of the tumor, prostate, and its substructures were manually identified, and subsequently manually brought into alignment to evaluate early treatment response of radio-therapy for prostate cancer by studying changes in the apparent diffusion coefficient on MRI following spatial alignment of the scans. In our approach, the bladder, rectum, and internal structures of the prostate are outlined on both pre- and post-treatment MRI, and a biomechan-ical model is used to automatbiomechan-ically register the images.
An FEM deforms a model of an organ based on physical properties of the organ, specifically Young’s modulus and Poisson’s ratio. Young’s modulus defines the“hardness”of the tissue. In this work we use the Young’s modulus to define the degree to which a force applied to the pros-tate will deform the tissue.
There are several examples of biomechanical models being used to register prostate images [8,11–15]. In addition, there are several examples of biomechanical models being used to regis-ter pre-, post-treatment imagery [16–18]. Yet to the best of our knowledge, this is the first time a biomechanical model has been used to specifically register prostate focal laser ablation pre-, post-treatment imagery.
prostate tumors, and benign prostatic hyperplasia. Boubaker et al. [14] used a FEM to model how the bladder, rectum, and prostate moved on CT imagery, and compared the results to a cadaver. Crouch et al. [12] used a FEM to register the prostate surfaces on CT imagery. Hensel et al. [13] used a FEM to register MRI with an endorectal coil to MRI without. Brock et al. [8] performed MRI-to-MRI registration by automatically aligning nodes on the surface of the prostate.
In this work, we will generate a FEM to determine how the motion and filling of the bladder and rectum affect the prostate. This simulated motion will be inverted, so that the only remain-ing changes in the prostate are due primarily to the focal laser ablation. A second FEM will then be used to model the shape-based changes in the prostate due primarily to the focal laser ablation. This will allow us to (1) determine the changes to the MRI parameters specifically at the ablated zone, and (2) determine the shape-based changes induced by focal laser ablation to the prostate and its internal structures.
Our approach provides the basis for isolating treatment-related shape-based changes to the given tissue, which is also applicable for isolating treatment-related shape-based changes for
Fig 1. Overview of the registration techniques used to bring the pre-, post-treatment into spatial alignment.The post-treatment bladder, prostate, and rectum are shown in green, blue, and pink, respectively. The pre-treatment surfaces are shown in grey. The first step is to use a linear registration to account for patient alignment. Secondly, a finite element model (FEM) is used to calculate the deformation due to the bladder and rectum, and removes those deformations. The preceding two steps are necessary in order to remove confounding deformations and isolate the treatment-induced changes to the gland. Finally, a second FEM calculates the remaining deformations on the prostate. These deformations can therefore be assumed to be primarily (if not
exclusively) due to shape-based changes from the ablation. The quantitative measurements reflecting such changes can be used to track treatment response over time.
different types of focal treatments for prostate cancer such as brachytherapy and radiofre-quency ablation. In addition, it is also applicable to isolating treatment-related effects in other organs and diseases, such as lung tumors and liver cancer [19,20]. Removing the effects of nearby organ motion (such as the heart for lung tumors) is critical for determining treatment efficacy [19,20].
Methods
Notation and Preliminaries
A 3D MRI sceneI= (C,f(c)) is defined by a collection of voxelsc= (xc,yc,zc),8c2C, and MRI intensity information for each voxel,fðcÞ 2R,8c2C. The pre-treatment MRI is denoted as
IPreand the post-treatment MRI is denoted asIPost. An image scene deformed by transforma-tionTis defined as,
TðIÞ ¼ ðC;fðTðcÞÞÞ; ð1Þ
whereT(c) represents the transformation of voxelc.T(C) represents the collection of trans-formed voxels,T(C) = {T(c)j 8c2C}.
Following treatment, we assume the prostate undergoes transformations due to different patient alignment within the MRI machine (T1), transformations due to changes in surround-ing tissue (T2), and focal laser ablation-induced transformations (T3). Therefore,
CPost¼T1ðT2ðT3ðCPreÞÞÞ: ð2Þ
It follows that,
T3ðCPreÞ ¼Tb2ðTb1ðCPostÞÞ; ð3Þ
whereTbðÞrepresents the inverse transformationT−1().
Methdological Overview
The following sections outline the procedure for calculating the inverse transformationsbT1,Tb2.
Calculating the deformation due to an external object on the prostate, and applying the inverse of such deformation to the prostate surface, has the effect of essentially reversing, or subtract-ing, that external deformation from the shape of the prostate. Any differences in prostate shape which remain between the pre- and post-treatment surfaces (calculated asT3) (after subtract-ing the deformations due to external objects) likely stem primarily from the effects of ablation.
One of the stated goals of this work is to isolate these focal laser ablation induced shape-based changesT3. In addition, onceTb1,Tb2, andT3are known, the MRI parameters can be
com-pared betweenT3(IPre) andTb1ðTb2ðIPostÞÞ, which represents spatially aligned, pre-,
post-treat-ment MRI.
Linear Alignment
T
b
1of Pre-, Post-Treatment Scans
yields the maximum mutual information, defined as,
b
T1¼arg max
T MIðTðIPostÞ
;IPreÞ: ð4Þ
Simulating Deformations on an MRI Scan due to External Physical
Forces via Finite Element Modeling
An FEM contains elements (e.g. hexahedrons) connected at nodes. This section describes how the FEM incorporates external forces to deform an MR imageC.
The FEM was constructed by dividing the manual segmentation of the prostate, bladder, and rectum, into hexahedron elements [12,21]. The size of the elements used was dependent on the curvature of the model in that region, such that locations with higher curvature (e.g. near the edges of the 3D segmentation) were subdivided into smaller hexahedrons to account for minute changes, compared to the regions within the prostate (to account for gross changes).
GivenNnodesN in a 3D FEM, a 3N× 3Nsparse, symmetric“stiffness”matrixKdefines
how each node interacts with every other node. A 3N× 1 vectorVrepresents the coordinates of the nodes, a 3N× 1 vectorFrepresents a series of external forces applied to each node, and a 3N× 1 vectorUrepresents thefinal displacements of each node (thefinal result of the FEM cal-culation). Mathematically, this is equivalent to solving forUvia the following equation,
KU ¼F: ð5Þ
However, solving (U=K−1F) directly is computationally infeasible; iterative algorithms such as the biconjugate gradient stabilized method algorithm [22] are employed to estimateU
by solving,
U ¼arg min
U kF KUk2: ð6Þ
Urepresents the displacement of nodes in the FEM (in mm).
To determine the displacement of each voxel in the image scene (c2C), the nodes sur-roundingc,Sc{1,. . .,N}, are defined by the corners of the FEM element containingc. The transformation ofcis defined as an interpolation of nodal displacements,
TðcÞ ¼cþ
X
n2Sc
kc vnk2un
X
n2Sc
kc vnk2
; ð7Þ
whereundenotes the displacement of nodenfrom the FEM resultU. The transformed MRI TðCÞis therefore defined as the conjunction of Eqs (1) and (7).
Modeling Changes from Surrounding Tissue
T
b
2Using an FEM
Even after taking into account patient motion and position within the MRI between visits (defined byTb1), changes in tissues surrounding the prostate, such as the bladder and rectum,
by deforming the bladder and rectum onTb1ðIPostÞtowards the bladder and rectum onIPre. The FEM calculates the deformation for the entire image given the forces at the surface of the blad-der and rectum. These deformations are inverted and applied to the prostate. This has the effect of removing the deformations due to the bladder and rectum, and as such leaves only the treat-ment induced deformations remaining. This allows one to systematically and quantitatively track the shape-based changes due primarily to the treatment over time. The FEM based defor-mations (from the bladder and rectum on post- to pre-treatment) is denoted as,
b
T2¼FEMBRðTb1ðIPostÞ;IPreÞ; ð8Þ
whereFEMBR(a,b) represents the FEM-induced deformations due to deforming the bladder and rectum fromatob.
Focal Laser Ablation Induced Prostate Deformations
T
3^ T2ð
^
T1ðIPostÞÞrepresents the post-treatment image with the deformations due to the bladder
and rectum removed. To model the focal laser ablation induced changes to the prostate, a FEM of the prostate is generated, and the prostate onTb2ðTb1ðIPostÞÞis deformed to bestfirst the
pros-tate onIPre. This deformation is denoted asT3and defined as,
T3¼FEMPðIPre;Tb2ðTb1ðIPostÞÞÞ: ð9Þ
whereFEMP(a,b) represents the FEM-induced deformations due to the prostate deforming fromatob.T3represents the shape-based changes due primarily to the focal laser ablation.
T3(IPre) andbT2ðTb1ðIPostÞÞrepresent spatially aligned pre-, post-treatment MRI respectively.
Experimental Design
Data Description. A retrospective cohort of eight prostate cancer patients, scheduled for laser ablation, had T2-weighted MRI acquired both before and after the procedure. The cohort included patients from between 2008 and 2011, none of whom had any hormonal therapy. The
time between pre-, post-treatment MRI scans ranged from 4–7 months. The data were
anon-ymized and the study was approved by the Western Institutional Review Board (WIRB). In each study, the T2-weighted MRI was acquired using a 3.0 Tesla MRI scanner without an endorectal coil. The image sizes were approximately 140 × 140 × 140 mm, and the voxel sizes ranged from 0.27 × 0.27 × 2.2 mm/voxel to 0.54 × 0.54 × 3.0 mm/voxel.
Implementation Details. The algorithm was implemented in C++, based on the ITK framework [23], and compiled with gcc 4.8. Brock et al. [8] used a Young’s modulus of 21 kilo-pascals (kPa) for the prostate, and Chi et al. [11] claimed that normal prostate tissue has a Young’s modulus of 40-80 kPa, benign hypertrophic prostate tissue has a value of 30-50 kPa, and cancerous prostate tissue has a value of 80-120 kPa. Based on the preceding justifications for various ranges of Young’s modulus, in this study, we chose to use a Young’s modulus of 30 kPa for soft tissue, and found no significant differences in results from using slightly different values of Young’s modulus. In addition, in this work we chose use hexahedron elements for the FEM calculations as in [12,21], and as such,Sc2R
8
. As in any biomechanical analysis, a trade-off was made between computational complexity and accuracy of such a model. As such, we used the smallest element size possible (approximately 1mm x 1mm x 1mm) such that the experiments ran in under 1 hour.
E1: Applying Synthetic Deformations to Test FEM Inverse Accuracy. T^2aims to remove
synthetically generated (defined asT~2) in order to quantify the accuracy of the inversion. IfbT2
perfectly recovered the deformations due to the bladder and rectum, thenTb2¼ ð
~ T2Þ
1
An FEM model of the bladder and rectum was created for the pre-treatment image on one studyIPre, and known forces at the surface were induced to generate a synthetic transformation
~
T2. The forces were chosen to deform the pre-treatment bladder and rectum towards the
post-treatment bladder and rectum for the same study. This yields a synthetic post-post-treatment~IPost.
We denote asCP
Pre, the voxels contained within the prostate on the pre-treatment MRI scan. ~
CP Post¼
~ T2ðC
P
PreÞrepresents the synthetically deformed post-treatment voxels. The Dice
similar-ity coefficient [24] betweenCP
PreandTb2ð
~ CP
PostÞwas used to determine the accuracy of the
inver-sion, where a Dice of 100% indicatesTb2¼ ð
~ T2Þ
1
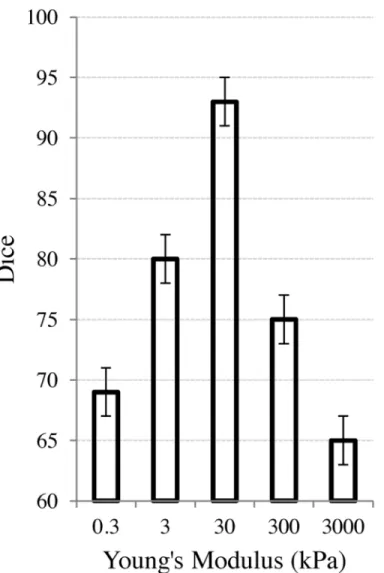
. An analysis of the choice of Young’s modulus and its effects on the removal of the synthetic deformation is shown inFig 2. The
Fig 2. Effect of physical parameters on the FEM used to compensate for the bladder/rectum motion. The X-axis represents the Young’s modulus (in log-scale). The Y-axis represents the Dice similarity coefficient between the pre-treatment, undeformed prostate (CP
Pre) and the prostate after inducing, and then
range of the log-scaled x-axis was from.3 kPa to 3000 kPa to highlight at what values of Young’s modulus, the accuracy significantly decreased. In the more typical biomechanical range of approximately 20-120 kPa, the resulting accuracy of thefinal Dice calculations were all greater than 92% in terms of accuracy.
E2: Using FEM to Quantify Changes Post-Treatment. For each step in the registration process, one image is fixed as the reference, and another image is considered the moving image. The first two steps bringIPostinto the frame of reference ofIPre, after which the focal laser ablation induced changes to the prostate are calculated to deform the pre-treatment MRI onto the post-treatment MRI. The result of this operation is a model of the prostate in which the external deformations have been removed., and in which the remaining shape-based changes are likely due primarily to the effects of ablation. The final deformation,T3therefore represents the shape-based changes in the prostate due primarily to the focal laser ablation treatment. This is compared to the location of treatment in order to determine the magnitude of treatment-induced shape-based changes at the site of ablation. Such changes to the prostate shape at the site of ablation can be used to quantitatively track treatment response over time.
Results
E
1: Applying Synthetic Deformations to Test Accuracy of Removing
Effects of Bladder and Rectum Filling on Prostate
The synthetic experiments outlined in Section 3 resulted in a mean Dice score of 93% ± 2%, suggesting that the FEM was able to accurately recover the bladder and rectum deformations.
Fig 2shows the effects of the Young’s modulus on the ability of the FEM to recover the defor-mations. The induced synthetic deformation (prior to using the FEM to recover the deforma-tion) started at a Dice value of 65%. As the Young’s modulus veered away from the soft-tissue value of 30 kPa, the deformation was less able to be recovered.
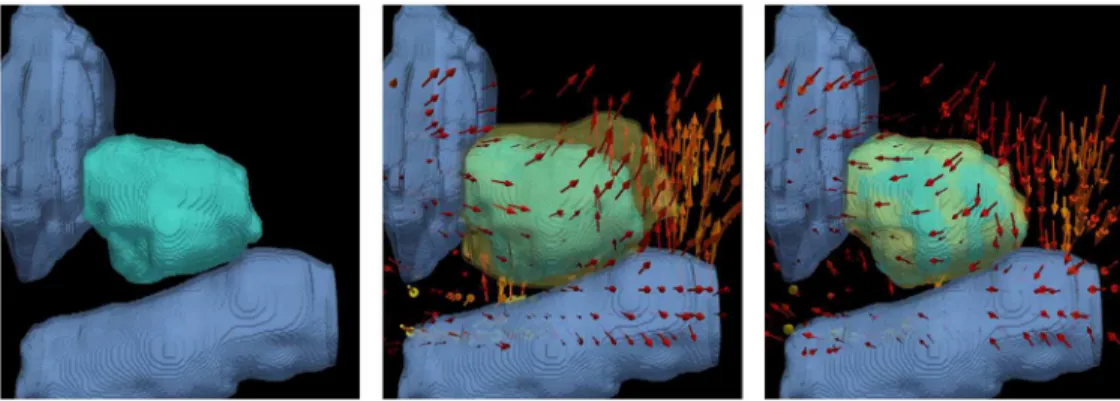
Fig 3shows the qualitative results ofT2inFig 3(b)and the recovered deformationTb2inFig
3(c). In this case, the change in the rectum (pale blue, below) was the primary driving force in pushing the prostate (teal) upwards, near the apex. The pulling effect caused by bringing the
Fig 3. Illustration of the ablation related effects on the prostate, bladder, and rectum modeled by the FEM.((a)) represents the bladder and rectum in pale blue, and prostate in teal. ((b)) represents the synthetic deformationT2. The deformed prostate is shown in yellow, and the arrows in ((b)) represent the direction of the transform (mostly due to the rectum). ((c)) represents the result of the recovered deformationTb2. The deformed prostate is shown in semi-transparent yellow in ((b)) and ((c)). The high level of overlap between the semi-transparent yellow prostate and the teal prostate in ((c)) shows the accuracy of removing the simulated effects of the bladder and rectum motion.
rectum back to its original position caused the inverse deformation in the prostate, yielding a high overlap with the undeformed, pre-treatment prostate inFig 3(c).
E
2: Using FEM to Quantify Changes Post-Treatment
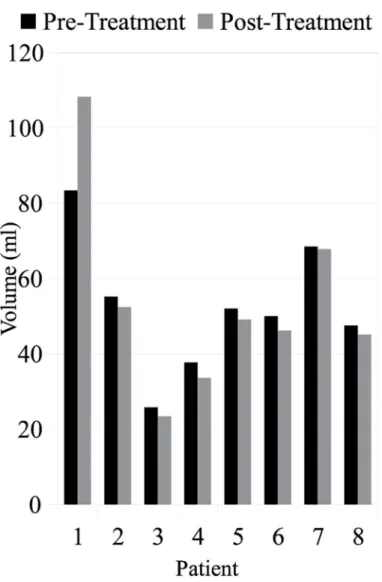
Volume Changes. Fig 4shows the prostate volume before and after focal laser ablation treatment. The median pre-treatment volume was 51.0 ml and the median post-treatment vol-ume was 47.7 ml, a decrease of 5.1%. Since the effects of patient positioning and nearby organ changes were removed prior to calculating the change in volume, this decrease suggests that the treatment itself caused a shrinking effect within the prostate.
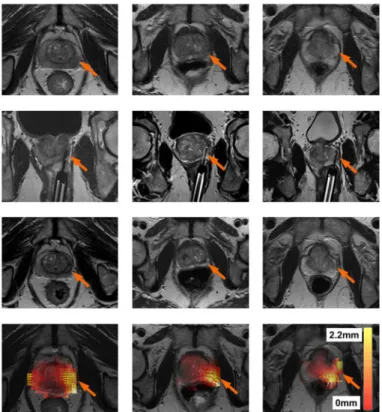
Shape-Based Changes. Fig 5shows the registration result for three patients in order to determine where the shape-based changes in the prostate occurred. Each patient is represented by a column. The first row showsIPre, the second row an image of the ablation needle during treatment, and the third row showsIPost. The slight change in volume in the prostate is visible onIPost. The registration resultT3is shown in the fourth row. The arrows represent the
Fig 4. The prostate volume across all eight patients both before and after treatment.The median change was a 5% decrease in volume following focal laser ablation treatment.
direction of the shape-based changes, and in all cases they point inwards towards the center of the prostate close to the site of ablation. In addition, the deformation heatmap shows the mag-nitude of shape-based changes (kT3(c)−ck2), where red represents a small change and white
represents a large change. These results show that a slight decrease in volume of the prostate occurred at the site of ablation, suggesting that the focal laser ablation induced necrosis caused a change in prostate morphology and shape.
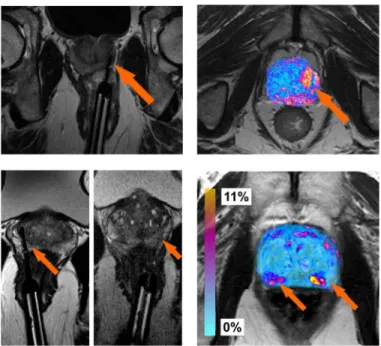
Post-Ablation MRI Changes. Fig 6(a) and 6(b)show MRI scans both during and after the laser treatment, respectively. The laser needle during the procedure at the site of ablation is clearly visible inFig 6(a). The changes in MRI intensity values following the FEM based regis-tration are shown as a colored heatmap inFig 6(d). Hot colors represent areas of large changes in MRI intensity values and cooler colors represent areas of small changes. The same represen-tations are shown for a second patient inFig 6(c) and 6(d). This particular patient had two sites of ablation, both shown by the MRI images during treatment inFig 6(c).
Discussion
Volume Changes
With regards to the treatment induced volume changes, in most patients, the volume of the prostate decreased following focal laser ablation treatment. However, in patient #1 (the patient
Fig 5. Results for three patients (one per column).The first row represents the pre-treament MRI scan (IPre). The second row represents the location of the laser during treatment. The third row represents the
post-treament MRI scan (IPost). The fourth row represents a heat map of the ablation induced deformationsT3. White represents regions of large deformations (2.2 mm), while transparent red represents regions of small deformations (0 mm). Small arrows represent the direction of the deformation (in all cases pointing towards the centroid of the prostate) after removing deformations due to patient alignment (T1) and surrounding tissues (T2). It can be seen that in all patients, the areas with the the largest deformations correspond to the focal laser ablation sites.
with the largest prostate), the volume actually increased following treatment. While the imag-ing scan and treatment options for patient #1 were no different than the other patients, the one noticeable difference was that patient #1 had the largest pre-treatment prostate volume. While this increased volume could have been due to a number of different factors (e.g. prostatic hypertrophy), in future studies this confounding factor will have to be controlled for to assess changes solely due to the treatment modality. One way of doing this is via an atlas based approach, such as was presented in [25], where all the prostates within a population were mapped into a single canonical representation which allows for size normalization, so that additional changes can then be attributed primarily to the treatment.
Shape-Based Changes
With regards to the shape-based changes, all three patients shown inFig 5had significant shape-based changes at the ablation site.Fig 5(j), 5(k), and 5(l)all show significant shape-based changes in the bottom right corner.Fig 5(d), 5(e), and 5(f)all show that the ablation sites (seen via the laser needle) are directly related to the location of the aforementioned shape-based changes.
Post-Ablation MRI Changes
With regards to the functional changes on MRI, the regions corresponding to the top of the prostate inFig 6(b) and 6(d), show slight changes in intensity values. This was caused by a very slight misalignment of the prostate boundaries within this region. However, at the two focal laser ablation sites seen inFig 6(c), there is significant necrosis following treatment, showing up as hot colors inFig 6(d). These results are also apparent in the difference map from a second patient, shown inFig 6(b), who only had one ablation site, shown inFig 6(a). In both cases, there were large changes in the MRI parameter values at the ablation sites. While there are regions of MRI intensity value changes pre-, post-treatment due to misalignment, most of the changes in MRI intensity values occurred near the sites of ablation. We believe that these changes in MRI intensity values could correlate to functional changes within the prostate, which may help quantitatively track patients (and associated treatment efficacy) over time. The sites of significant changes outside of the ablated zone are likely due to either (a) slight mis-alignment of the pre-, post-treatment MRI scans, or (b) changes within the tissue itself due to the large time interval between scans. Other contributory factors could include diet and disease progression which could have occurred within that timespan between scans.
Sources of Variability
There are several potential sources of variability in this study listed below.
• # of Patients: This preliminary study included 8 patients. To evaluate the generalizability of this method in order to quantitatively determine (and track) treatment-related changes over time, our biomechanical model will in the future need to be evaluated on a much larger cohort of patients.
near the site of ablation suggests that these changes were largely and primarily due to the treatment itself.
• Uniform Young’s Modulus: In this study, the final results did not vary significantly if we varied the Young’s modulus throughout the gland while using the FEM to model the organ, compared to using a homogeneous Young’s modulus value. However it is entirely possible that the use of a heterogeneous Young’s modulus to model the deformation of the entire prostate could result in slightly different deformation results compared to what we observed in this study.
• Segmentation Accuracy: The use of manual segmentations in this study was meant to reduce the potential for the segmentation accuracy being a source of error in the FEM accuracy. However, we recognize that different observers may segment the gland slightly differently, and that the use of an automated segmentation algorithm as a pre-preprocessing step (prior to generating the FEM) could potentially be a source of variability. Yet it is important to note that most sites of ablation in this study were in the midgland, which we previously found [26] to have higher segmentation accuracy and lower variability than in the apex or base.
Conclusion
Focal laser ablation treatment aims to destroy cancerous cells with highly focused laser, in order to cause necrosis to the affected tissue. It combines the benefits of aggressive therapy such as radiation treatments (the ability to destroy cancers cells) without the harmful side effects (due to its localization). Quantifying treatment related changes (both shape-based as
Fig 6. Illustration of the focal laser ablation needle locations on T2-w MRI during the procedure for two different patients ((a), (c)).After registration, the difference between the MRI intensity values (as a relative percent change) are shown as colored values in ((b)) and 3D ((d)), where cool blue colors represent regions corresponding to small differences (0%), while hot red colors represent regions of large differences (11%) in MRI intensity values. Most of the hot colors are correlated with the needle locations (shown as orange arrows).
well as functional) to the prostate can be used to systematically track a patient over time, as well as potentially develop predictive models for long term patient outcome. However, to quan-tify these changes, the pre- and post-treatment MR images must first be spatially aligned via image registration. Challenges of such a registration technique arise from the significant changes to gland morphology following treatment due to (1) patient alignment, (2) changes due to surrounding organs such as the bladder and rectum, and (3) changes due primarily to the focal laser ablation itself.
In order to isolate the treatment induced shape-based changes, the changes from (1) and (2) were first modeled and removed. Then, a finite element model (FEM) was used to determine the ablation induced changes to the prostate. This resulted in (a) ablation induced shape-based changes to the prostate, and (b) spatially aligned pre-, post-treatment imagery. To the best of our knowledge, our approach is the first attempt to use a FEM to isolate the treatment-related shape-based changes in the prostate.
This methodology was applied to eight patients in order to quantify (1) changes in the pros-tate volume following treatment, (2) locations of significant shape-based changes within the prostate due primarily to the treatment, and (3) locations of changes in MRI intensity values following registration of pre-, post-treatment imagery. The patients used in this cohort only had focal laser ablation treatment, removing hormonal therapy as a possible confounding fac-tor when quantitatively tracking patients over time. Our results suggested that focal laser abla-tion usually causes a decrease in prostate volume, specifically located at the site of ablaabla-tion. In addition, changes in MRI intensity values, which may be correlated to functional changes within the prostate, typically appear occur at the site of ablation.
This quantification of shape-based changes of the prostate could pave the way for determin-ing possible correlations between shape-based changes in the prostate and treatment response. In addition, this approach defines a framework for isolating treatment-related shape-based changes in other domains such as liver and lung treatment.
In this work we present results which suggest that the focal laser ablation treatment causes a minor decrease in prostate volume, focused specifically at the site of ablation. In addition, after spatially aligning the images, changes to MRI intensity values are clearly visible at the site of ablation. Both these results lend themselves to quantifying the degree of ablation induced changes to the prostate, which can be used to track a patient’s treatment response to prostate cancer therapy over time.
One limitation of this study is that additional confounding factors may contribute to pros-tate deformation such as blood flow or concomitant therapies. We assume that these effects are minimal compared to the effects from the bladder and rectum. A second limitation of this study is the dependency on the accuracy of the organs’segmentations, which future work will aim to explore.
In this paper we reported preliminary results of a novel method for fusing pre-, post-treat-ment MRI in order to quantitatively investigate changes in the prostate. Future work will entail evaluating this method on a larger cohort of patients, in order to determine if such a method could be useful for tracking treatment efficacy over time.
Acknowledgments
Investigator Award (LC130463), the DOD Prostate Cancer Idea Development Award; the Ohio Third Frontier Technology development Grant, the CTSC Coulter Annual Pilot Grant, the Case Comprehensive Cancer Center Pilot Grant, VelaSano Grant from the Cleveland Clinic, the Wallace H. Coulter Foundation Program in the Department of Biomedical Engi-neering at Case Western Reserve University. The content is solely the responsibility of the authors and does not necessarily represent the official views of the National Institutes of Health.
Author Contributions
Conceived and designed the experiments: RT AM. Performed the experiments: RT. Analyzed the data: RT DS AM. Contributed reagents/materials/analysis tools: DS. Wrote the paper: RT AM.
References
1. Colin P, Mordon S, Nevoux P, Marqa MF, Ouzzane A, Puech P, et al. Focal Laser Ablation of Prostate Cancer: Denition, Needs, and Future. Advances in Urology. 2012; 2012:589160–589169. doi:10.1155/ 2012/589160PMID:22666240
2. Oto A, Sethi I, Karczmar G, McNicholas R, Ivancevic MK, Stadler WM, et al. MR Imaging-Guided Focal Laser Ablation for Prostate Cancer: Phase I Trial. Radiology. 2013 Jun; 267:932–940. doi:10.1148/ radiol.13121652PMID:23440319
3. Eggener S, Salomon G, Scardino PT, De la Rosette J, Polascik TJ, Brewster S. Focal Therapy for Pros-tate Cancer: Possibilities and Limitations. European Urology. 2010 Mar; 58:57–64. doi:10.1016/j. eururo.2010.03.034PMID:20378241
4. Raz O, Haider MA, Davidson SRH, Lindner U, Hlasny E, Weersink R, et al. Real-Time Magnetic Reso-nance Imagingâ??Guided FocalLaser Therapy in Patients with Low-Risk Prostate Cancer. European Urology. 2010 Jul; 58(1):173–177. doi:10.1016/j.eururo.2010.03.006PMID:20334965
5. Lindner U, Lawrentschuk N, Weersink RA, Davidson SRH, Raz O, Hlasny E, et al. Focal Laser Ablation for Prostate Cancer Followed by Radical Prostatectomy: Validation of Focal Therapy and Imaging Accuracy. European Urology. 2010; 57:1111–1114. doi:10.1016/j.eururo.2010.03.008PMID: 20346578
6. Lindner U, Trachtenberg J, Lawrentschuk N. Focal Therapy in Prostate Cancer: Modalities, Findings and Future Considerations. Nature Reviews in Urology. 2010 Sep; 7:562–571. doi:10.1038/nrurol. 2010.142
7. Viswanath S, Toth R, Rusu M, Sperling D, Lepor H, Futterer J, et al. Identifying quantitative in vivo multi-parametric MRI features for treatment related changes after laser interstitial thermal therapy of prostate cancer. Neurocomputing. 2014;p. In Press.
8. Brock KK, Nichol AM, Menard C, Moseley JL, Warde PR, Catton CN, et al. Accuracy and Sensitivity of Finite Element Model-Based Deformable Registration of the Prostate. Medical Physics. 2008 Sep; 35 (9):4019–4025. doi:10.1118/1.2965263PMID:18841853
9. Toth R, Traughber B, Ellis R, Kurhanewicz J, Madabhushi A. A Domain Constrained Deformable (DoCD) Model for Co-registration of Pre- and Post-Radiated Prostate MRI. Neurocomputing. 2014;Spe-cial Issue on Image Guided Interventions:In Press.
10. Foltz WD, Wu A, Chung P, Catton C, Bayley A, Milosevic M, et al. Changes in Apparent Diffusion Coef-ficient and T2 Relaxation During Radiotherapy for Prostate Cancer. Journal of Magnetic Resonance Imaging. 2013 Apr; 37(4):909–916. doi:10.1002/jmri.23885PMID:23097411
11. Chi Y, Liang J, Yan D. A Material Sensitivity Study on the Accuracy of Deformable Organ Registration Using Linear Biomechanical Models. Medical Physics. 2006 Feb; 33(2):421–433. Finite Element Model. doi:10.1118/1.2163838PMID:16532950
12. Crouch JR, Pizer SM, Chaney EL, Hu Y, Mageras GS, Zaider M. Automated Finite-Element Analysis for Deformable Registration of Prostate Images. Medical Imaging, IEEE Transactions on. 2007 Oct; 26 (10):1379–1391. Finite Element Model. doi:10.1109/TMI.2007.898810
14. Boubaker MB, Haboussi M, Ganghoffer JF, Aletti P. Finite Element Simulation of Interactions Between Pelvic Organs: Predictive Model of the Prostate Motion in the Context of Radiotherapy. Journal of Bio-mechanics. 2009; 42:1862–1868. doi:10.1016/j.jbiomech.2009.05.022PMID:19559437
15. Mohamed A, Davatzikos C, Taylor R. A Combined Statistical and Biomechanical Model for Estimation of Intra-Operative Prostate Deformation. Medical Image Computing and Computer Assisted Interven-tion. 2002; 2489:452–460. Finite Element Model.
16. Zacharaki E, Hogea CS, Shen D, Biros B, Davatzikos C. Non-diffeomorphic Registration of Brain Tumor Images by Simulating Tissue Loss and Tumor Growth. Neuroimage. 2009 Jul; 46(3):762–774. doi:10.1016/j.neuroimage.2009.01.051PMID:19408350
17. Kyriacou SK, Davitzikos C, Zinreich SJ, Bryan RN. Nonlinear Elastic Registration of Brain Images with Tumor Pathology Using a Biomechanical Model. Medical Imaging, IEEE Transactions on. 1999 Jul; 18 (7):580–592. Finite Element Model. doi:10.1109/42.790458
18. Karacali B, Davatzikos C. Simulation of tissue atrophy using a topology preserving transformation model. Medical Imaging, IEEE Transactions on. 2006 May; 25(5):649–652. doi:10.1109/TMI.2006. 873221
19. Kitamura K, Shirato H, Shimizu S, Shinohara K, Harabayashi T, Shimizu T, et al. Registration accuracy and possible migration of internal fiducial gold marker implanted in prostate and liver treated with real-time tumor-tracking radiation therapy (RTRT). Radiotherapy and Oncology. 2002 Mar; 62(3):275–281. doi:10.1016/S0167-8140(02)00017-8PMID:12175558
20. Seppenwoolde Y, Shirato H, Kitamura K, Shimizu S, van Herk M, Lebesque JV, et al. Precise and real-time measurement of 3D tumor motion in lung due to breathing and heartbeat, measured during radio-therapy. International Journal of Radiation Oncology and Biological Physics. 2002 Jul; 53(4):822–834. doi:10.1016/S0360-3016(02)02803-1
21. Benzley SE, Perry E, Merkley K, Clark B, Sjaardama G. A comparison of all hexagonal and all tetrahe-dral finite element meshes for elastic and elasto-plastic analysis. In: In Proceedings, 4th International Meshing Roundtable; 1995. p. 179–191.
22. van der Vorst HA. Bi-CGSTAB: A Fast and Smoothly Convergin Variant of Bi-CG for the Solution of Nonsymmetric Linear Systems. SIAM J Sci and Stat Comput. 1992; 13(2):631–644. doi:10.1137/ 0913035
23. Yoo TS, Ackerman MJ, Lorensen WE, Schroeder W, Chalana V, Aylward S, et al. Engineering and Algorithm Design for an Image Processing API: A Technical Report on ITK—the Insight Toolkit. In: Westwood e, editor. Proc. of Medicine Meets Virtual Reality. IOS Press Amsterdam; 2002.
24. Dice LR. Measures of the amount of ecologic association between species. Ecology. 1945; 263:297– 302. doi:10.2307/1932409
25. Rusu M, Bloch BN, Jaffe C, Genega E, Lenkinsky R, Feleppa E, et al. Prostatome: A combined anatom-ical and disease based MRI atlas of the prostate. Medanatom-ical Physics. 2014; 41:4822–4832. doi:10.1118/ 1.4881515