Empirical Assessment on Factors Affecting
Travel Time of Bus Rapid Transit
Fergyanto E Gunawan #1
#
Binus Graduate Programs, Bina Nusantara University, Jl. Kebon Jeruk Raya No. 27, Jakarta 11530, Indonesia
1
[email protected], [email protected]
Abstract—Since the beginning of the century, many cities around the world adopt the bus rapid transit (BRT) system to fulfill their need of mass transportation system. The system features with platform-level boarding, bus lanes in the central verge of the road, off-vehicle fare collection, and physically protected busway. So far, these criteria are considered to be the most important aspects with respect to the BRT performance. In this research, we intend to study to what extent the BRT performance may be affected by the interference of the mixed traffic during the BRT operation. We adopt an empirical approach by observing the phenomenon unfolding in the eleven TransJakarta BRT corridors. The TransJakarta BRT operates in the city of Jakarta, the capital of the Republic of Indonesia. We record the travel time data from station to station for the case where the TransJakarta bus can travel smoothly and the case where the traveling bus is interfered with the mixed traffic. For the cases, we evaluate the travel time variation. As the results, we found that the Corridor 1 of TransJakarta BRT has the best performance in term of the travel time variation. For the two directions, the corridor has the mean travel time of 34 min, the standard deviation of 3 min, and the travel time variation of 8%. On this corridor, the mixed-traffic interference is relatively negligible. On the Corridor 7, the two-direction travel times have the mean of 45 min, the standard deviation of 8 min, and the travel time variation of 16%. On the Corridor 9, the two-direction travel times have the mean of 1 hr and 25 min, the standard deviation of 11 min, and the travel time variation of 14%. On the last two corridors, the busways are heavily interfered by the mixed traffic; thus, the end-to-end travel times are significantly uncertain although only very few road segments are interfered. The research leads us to a conclusion that the interference, although only occurs on a road segment, may compromise the end-to-end travel time considerably.
Keyword-Bus Rapid Transit (BRT); Travel Time; Travel Time Reliability; Buffer Time Index; Busway
I. INTRODUCTION
Ability for a bus of the bus rapid transit (BRT) system to smoothly travel along its dedicated lane is very important. The dedicated lane is usually a single lane; thus, a delay on the bus can quickly propagate to the following buses and makes the entire system unreliable.
The travel time reliability or consistency of the transportation system is important for traffic engineers and essential for the end-users of the system. It is a measure of the level of consistency in transportation service for a mode, trip, route, or corridor during a time period. Travelers concern with unpredictable travel time according to several surveys [1].
The travel time reliability depends strongly on traffic congestion, which has many sources such as bottlenecks (40%), traffic incidents (25%), bad weather (15%), work zones (10%), poor signal timing (5%), and special events (5%) [2]. And, various measures were proposed to measure congestion. Those measures were delay (29%), level of service (20%), travel time (14%), volume/capacity (14%), and speed (13%) [3].
There are a growing interest among researchers to establish a metric to quantify the travel time variability. Generally, the travel time is described using statistical distributions. Many researchers believe that the travel time is distributed following the normal distribution. Some researchers use the log-normal distribution [4--6]. Susilawati et al. [7] propose the Burr distribution. Noland and Polak [8] review the travel time variability from theoretical and empirical aspects specifically in relation with traveler behavior where Polak [9] proposes the mean-variance approach. Susilawati et al. [10] study the travel time reliability using two reliability parameters: the travel time variation and the buffer time index. The travel time---a measure of level of congestion---is strongly related to the buffer time index---a measure of the transportation reliability [11].
A reliable travel time has many advantages including saving time and fuel, reducing vehicle emission, reducing transportation cost and benefits the economy, and improving safety. Modern society demand rather high travel time reliability. Yamanote line, a subway system running in a loop in the city of Tokyo, is an excellent example of the transportation system that has very high travel time reliability. This single line with a length of 34.5 km is able to serve 3.2 million passengers per day in 2008 (see Table I for the case of the BRT-based system). Because the travel time variation of train-BRT-based vehicle is so low, many consider the time to be a constant [16].
TABLE I
Comparison of Some Large Bus Rapid Transit Systems [17]
System length (in km) TransJakarta TransMilenio GuangZhou
Daily ridership (in Million) 172 84 22.5
Number of lines 0.36 1.6 1
Number of stations 12 9 1
Price of ticket (in USD) 181 114 26
Began operation 0.40 0.85 0.31
Location Jan 2004 Dec 2000 Feb 2010
Population 9580000 9600000 12700800
TransJakarta, the BRT operating in the capital of Indonesia, Jakarta, is expected to lessen frequency and size of traffic congestions enduring by the city. The system was reported to promote a shift from private vehicles by 14% during peak hours, and to reduce pollutants: CO2 20000 ton/year, NOx 155 ton/year, and particulate matters 23 ton/year [18]. The average speed of TransJakarta buses is significantly higher than those of non-transit vehicles because the TransJakarta buses travel on a physically protected busway. Even in a moderately congested traffic, the BRT bus may travel at least 20% faster than the speed of the non-transit traffic [19, 20].
However, after seven years in operation, the public acceptance of the system is relatively low as clearly indicated by the daily ridership data (see Table I). At this time, TransJakarta is able to attract only about 360,000 passengers per day. At the same time, two smaller BRT systems, TransMilenio and Guangzhou BRT, attract significantly more passengers of 1.6 million and 1 million passengers, respectively.
Many factors can potentially contribute to the low ridership including marketing and branding, reliability of the service, and the accessibility of the system among others. Yunita [21] identified four aspects including the long bus waiting time, which can be associated with the bus travel time.
In this investigation, we empirically measure the travel time of a BRT system and determine factors affecting the travel time. More specifically, we measure the travel time and its variability in terms of the travel time variation and travel time index (TTI). This approach is relevant with the need of the present traveler that the current measure of congestion should include the notion of the actual travel time [3].
II. RESEARCH METHOD AND STUDY SITES
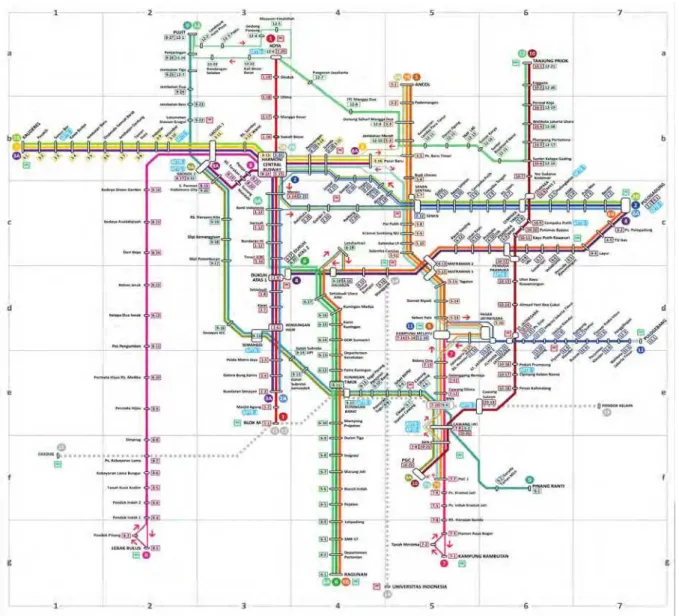
To investigate the factors affecting the travel time of the BRT system, we analyze the empirical data collected from the operation of TransJakarta BRT. The BRT is operating in the capital of Republic of Indonesia, Jakarta. The system currently has 12 corridors where the last corridor is officially opened on February 14, 2013. Figure 1 shows those corridors and Table II shows the data regarding the length and the number of stations.
TABLE II
The Twelve Corridors of TransJakarta
Corrido r
Route Length (km) Number of Stations Distance between Stations (m)
1 Blok M-Kota 12.9 20 650
2 Pulo Gadung-Harmoni 14.0 23 700-800
3 Kalideres-Harmoni 19.0 13 700-800
4 Pulo Gadung-Dukuh Atas 11.9 17 400-1600
5 Ancol-Kp. Melayu 13.5 17 400-2250
6 Ragunan-Duku Atas 13.3 18 400-1000
7 Kp. Rambutan-Kp. Melayu 12.8 13 500-1500
8 Lebak Bulus-Harmoni 26.0 21 500-1500
9 Pinang Ranti-Pluit 28.8 24 500-1500
10 Tanjung Priok-Cililitan 19.4 18 500-1000
11 Pulo Gebang-Kp. Melayu 11.8 14 300-1000
The travel time data are derived from the time data, which record the time when the TransJakarta buses departure and arrive at the stations. On a few corridors, TransJakarta BRT has already installed a monitoring system; but, the system is inaccessible to the author at the time.
Fig. 1. The corridor of TransJakarta BRT. Source: http://www.transjakarta.co.id
Thus, the time data are recorded manually. Only the first eleven corridor are monitored, one corridor per week, during 3 months of observation. The recording is limited to the rush hours of 07:00--10:00 morning local time. The time data are collected during week days only.
Furthermore, we derive some measures of the travel time variability following Lomax et al. [1]’s proposal. The first measure of the travel time reliability is the travel time variation, which is defined by:
% 100 Time Travel Average
Deviation Standard
Variation
Percent = × . (1)
In addition, the second measure is the travel time buffer, which is defined by:
% 100 Time Travel Average
Time Buffer Index
Time
Buffer = × , (2)
where the buffer time is defined by:
Time Travel Average trip
a for time avel percent tr 95th
Time
Buffer = − . (3)
Trip a for Time Travel Percent 95th index
Planning = . (4)
III.DATA ANALYSIS AND FINDINGS
A. Variability of the End-to-End Travel Time
The travel time variability of the subway mass transportation system is usually very low and is often regarded to be negligible. But for the case of the BRT system, the variability is rather high because the BRT lane or the busway usually builds in the central verge of the road where interference with the mixed traffic often occurs and delays the traveling bus. In the developing countries such as Indonesia where the traffic regulation is not strictly enforced, we often observe the mixed traffic utilizes the busway. Despite of this fact, in the good BRT design, the busway should be protected from the mixed traffic; the BRT bus should receive signal priority in the intersection, and the turn crossing the busway should be eliminated.
We study to what extent the BRT performance is compromised when the mixed traffic interferes the BRT bus in the unprotected or weakly protected busway. We also study the effect of the uncoordinated traffic signal.
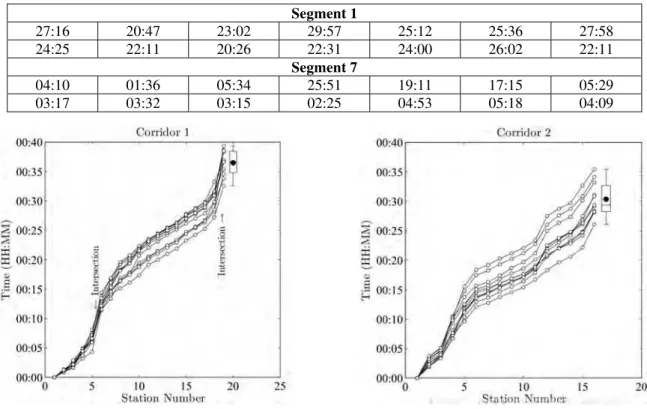
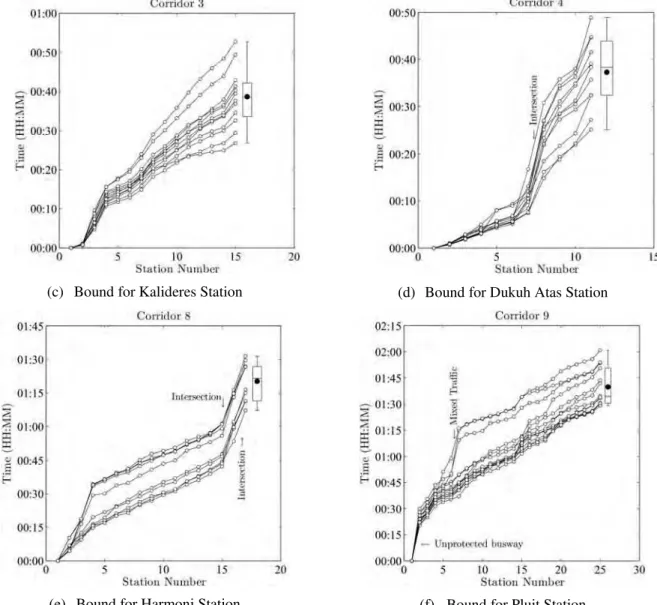
In Fig. 2, we show how the traffic signal, the mixed traffic, and the unprotected busway affects the BRT travel time on various corridors. Although the figure only shows the data on Corridors 1--4, 8, and 9, but we collect the travel time data for Corridor 1--11 for the both traveling directions. The travel time data in the figure represent the station-to-station traveling time and are compensated to zero for the departure time from the first station, which is numbered as Station 1. The bus waiting time on each station is not accounted. On the right side of each figure, a box plot is also displayed to summarize the distribution of the end-to-end travel time. A black dot on the box plot denotes the mean travel time.
Firstly, we closely observe the travel time data displayed in Fig. 2(f). These data are for the buses on Corridor 9 bounds for Pluit station. The figure shows that the end-to-end travel time data greatly vary with the mode around 56 minutes and the range around 43 minutes, which means the end-to-end travel time variation is about 75%. We can also clearly see that the long travel time occur mostly on Segment 1 and Segment 7. On Segment 1, the travel time data, numerically shown in Table III, are in the range of 20 min to 30 min, which is about 50% of the mode travel time. We note that the 56-minute travel time is that required to travel the 24 road-segments on the corridor. Thus, a segment that costs 20--30 min travel time is very significant and a big issue.
TABLE III
The travel time, in min:sec, on Segments 1 and 7 of Corridor 9 bounds for Pluit Station
Segment 1
27:16 20:47 23:02 29:57 25:12 25:36 27:58 24:25 22:11 20:26 22:31 24:00 26:02 22:11
Segment 7
04:10 01:36 05:34 25:51 19:11 17:15 05:29 03:17 03:32 03:15 02:25 04:53 05:18 04:09
(c) Bound for Kalideres Station (d) Bound for Dukuh Atas Station
(e) Bound for Harmoni Station (f) Bound for Pluit Station
Fig. 2. The end-to-end travel time variability
The long travel time on Segment 1 of Corridor 9 is because the busway is not available on the segment; hence, the BRT bus should travel within the mixed traffic. Meanwhile, on Segment 7, see Table III, the busway does exist, but the mixed traffic often interferes the BRT bus. At its best, the BRT bus only requires about 3 min to travel Segment 7; but, when interference occurs, the traveling time increases to about 26 min, or about eight times longer. The data also indicate that when the delay occurs on an earlier segment, it is extremely difficult for the bus to recoup the travel time from the latter segments. Thus, the delay propagates to the entire travel time.
In addition, the intersection is rather often to be the cause of the bus delay. For many cases, the BRT bus does not receive any signal priority on the intersection and the traffic conflict between the BRT bus and the mixed traffic often occurs. Table IV shows the amount of delay on Corridor 1 due to the intersection. The magnitude of the delay is not as severe as those occurred on the unprotected segment.
TABLE IV
The travel time, in min:sec, on Segments 6 and 19 of Corridor 1 bounds for Blok M station
Segment 6
06:33 05:36 07:06 05:32 04:50 06:59 06:40 05:32 07:28 05:48 05:34
Segment 19
06:23 10:10 05:21 04:11 03:49 07:04 03:24 07:03 08:25 06:49 05:04
example, the travel time is likely about 40 min, and so does its variation. On Corridors 2, 3, 6, and 7, there are a big difference of the travel time between the two directions on each corridor.
TABLE V
The statistics of the TransJakarta bus travel times. The mode represent the data with the highest probability.
Corridor Origin-Destination Mean Deviation Mode Range
1 Blok M--Kota 0:32:26 0:03:01 0:28:56 0:08:57
1 Kota--Blok M 0:36:30 0:02:11 0:32:34 0:06:48
2 Harmoni--Pulo
Gadung 0:30:22 0:02:54 0:26:04 0:09:22
2 Pulo
Gadung--Harmoni 0:45:47 0:08:51 0:37:10 0:26:05
3 Kalideres--Pasar Baru 0:54:05 0:03:06 0:51:12 0:08:11
3 Pasar Baru--Kalideres 0:38:41 0:07:33 0:26:48 0:25:59
4 Dukuh
Atas--Velodrome 0:20:24 0:02:29 0:17:42 0:07:57
4 Velodrome--Dukuh
Atas 0:37:17 0:07:32 0:25:05 0:23:49
5 Ancol--Melayu 0:34:13 0:02:11 0:30:13 0:07:27
5 Melayu--Ancol 0:40:02 0:03:30 0:34:47 0:10:39
6 Dukuh Atas--Ragunan 0:31:00 0:03:25 0:26:25 0:10:04
6 Ragunan--Dukuh Atas 0:51:43 0:10:41 0:34:25 0:34:06
7 Melayu--Rambutan 0:36:52 0:02:27 0:31:57 0:09:48
7 Rambutan--Melayu 0:52:36 0:13:15 0:39:42 0:41:39
8 Harmoni--Lebak
Bulus 0:57:15 0:08:00 0:45:29 0:23:18
8 Lebak
Bulus--Harmoni 1:20:17 0:08:53 1:07:12 0:24:17
9 Pinang Ranti--Pluit 1:39:50 0:10:52 1:29:05 0:31:50
9 Pluit--Pinang Ranti 1:09:31 0:11:32 0:55:48 0:42:35
B. Travel Time on All Road Segments of All Corridors
The entire travel time data are arranged in a cumulative distribution and a frequency distribution in Fig. 3. In the same figure, the requirements set by TransJakarta authority and by Institute of Transportation and Development Policy (ITDP) are shown as vertical-broken lines. Basically, the standards are defined as the frequency of the bus arriving in a station; thus, these requirements are relevant to be compared with the travel time between the stations because when the bus can efficiently travel on a road segment then it will arrive accordingly. ITDP requirement regarding the bus frequency is less than 3 min during rush hours [22]. In addition, we also plot the travel time required by a train traveling at an assumed operation velocity of 30 km/h and the segment length of 1 km. Thus, it is interesting to compare the performance of the BRT system to that potentially offered by a subway system. It is generally accepted that the performance of the BRT system is lower than that of the subway system but the BRT system requires a lower development cost. This comparison is intended to provide an insight of the performance of the two systems.
Fig. 3. Empirical cumulative and distribution frequency of the travel time.
C. Travel Time Variation and Buffer Time Index
Using Eqs. 1 and 2, we calculate the travel time variation and the buffer time index. The results are presented in Fig. 4. Regarding the travel time variation, the data are skewly distributed for most of the corridors. Many corridors have outliers, and those are related to the largest delay on each corridor. For an example, on Corridor 2, the largest travel time variation is about 120%, and it is associated with the buffer time index of 350%. This example means that if passengers require about 1 hr travel time in average, then they should preserve about 3 hr and 30 min to avoid late arrival more than a day in a month. In general, the travel time variation is high; 75% trips have travel time variation below 40%.
Fig. 4. Distribution of the travel time variation and buffer time index across all corridors
IV.CONCLUSIONS
Weinstock et al. [22] have clearly described the design criteria or the BRT standard of a good BRT system. The standard considers three aspects to be the most important and each aspect is awarded with the highest point of seven. Those aspects are: the BRT lane should be in the central verge of the road, the off-vehicle fare collection, and the physically-separated busway lane. In addition, the standard awards four point for the aspect of intersection treatments.
This research has brought the data of the travel time of a BRT system into our perspective and has quantified implications of the mixed traffic interference to the end-to-end travel time. The research leads us to a conclusion that the interference, although only occurs on a road segment, can compromise the end-to-end travel time considerably.
REFERENCES
[1] Tim Lomax, David Schrank, Shawn Turner, and Richard Margiotta. Selecting travel reliability measures. Technical report, Texas Transportation Institute and Cambridge Systematics Inc, May 2003.
[2] Rich Taylor. 2010 urban congestion trends: Enhancing system reliability with operations. Technical Report FHWA-HOP-11-024, US Department of Transportation – Federal Highway Administration, 2010.
[3] R L Bertini. Congestion and its extent. In D Levinson and K. Krizek, editors, Access to Destinations: Rethinking the Transportation Future of our Region. Elsevier, 2005.
[4] A J Richardson and M A P Taylor. Travel time variability on commuter journeys. High speed ground transportation journal, 6:77--99, 1978.
[5] H Rakha, I El-sharwarby, M Arafeh, and F Doin. Estimating path travel time reliability. In 2006 IEEE Intelligent transportation systems conference, Toronto, Canada, 2006.
[6] N E E Faouzi and M Maurin. Reliability metrics for path travel time under log-normal distribution. In INSTR 2007, 2007.
[7] Susilawati Susilawati, Michael A P Taylor, and Sekhar Somenahalli. Modelling urban travel time variability with the burr regression technique. In Proceeding of Australasian Transport Research Forum 2011, Adelaide, Australia, September 28--30 2011. URL http://www.patrec.org/atrf.aspx.
[8] Robert B. Noland and John W. Polak. Travel time variability: A review of theoretical and empirical issues. Transport Reviews, 22(1):39--54, 2002. doi: 10.1080/01441640010022456. URL http://www.tandfonline.com/ doi/abs/10.1080/01441640010022456. [9] J W Polak. An overview of the recent literature on modelling the effects of travel time variability. Technical report, Working paper
(London: Centre for transport studies, Imperial College), 1996.
[10] Susilawati Susilawati, Michael A. P Taylor, and Sekhar V C Somenahalli. Travel time reliability measurement for selected corridors in the adelaide metropolitan area. Journal of the eastern asia society for transportation studies, 8:86--102, 2010.
[11] Cambridge Systemics and Texas Transportation Institute. Traffic congestion and reliability: Linking solutions to problems. Technical report, Federal Highway Administration - US Department of Transportation, July 19 2004. URL http://www.ops.fhwa.dot.gov/congestion_report/.
[12] R. B. Noland. Commuter responses to travel time uncertainty under congested conditions: Expected costs and the provision of information. Journal of urban economics, 41:377--406, 1997.
[13] M Saberi and R.L. Bertini. Beyond corridor reliability measures: Analysis of freeway travel time reliability at the segment level for hotspot identification. In Proceedings of the 89th Annual Meeting of the Transportation Research Board, Washington, D.C., 2009. [14] Arezoumandi Mahdi. Estimation of travel time reliability of freeways using mean and standard deviation of travel time. Journal of
transportation systems engineering and information technology, 11(6):74--84, December 2011
[15] K Lyman and R Bertini. Using travel time reliability measures to improve regional transportation planning and operations. In 87th Annual Meeting of the Transportation Research Board, January 13--17 2008. URL http://www.its.pdx.edu/upload_docs/12488942228zK5wIlnV6.pdf.
[16] S Gao and Z Wu. Modeling passenger flow distribution based on travel time of urban rail transit. Journal of Transportation Systems Engineering and Information Technology, 11:124--130, 2011. doi: 10.1016/S1570-6672(10) 60156-0.
[17] Fergyanto E Gunawan and Erwin Kusnandar. Evaluation of transjakarta performance in comparison with world class bud rapid transit (in indonesian language). Jurnal jalan dan jembatan, 28(2):--, August 2011. http://digilib.polban.ac.id/gdl.php?mod=browse&op=read&id=jbptppolban-gdl-fergyantoe-3251.
[18] Muhammad Nanang Prayudyanto and Ofyar Z Tamin. Mode shift travel demand management evaluation from jakarta’s experience. In Proceedings of the Eastern Asia Society for Transportation Studies, volume 7, 2009.
[19] S Tantiyanugulchai and R L Bertini. Can buses predict your car’s travel time? Westernite, Institute of Transportation Engineers District 6, 57(5):1--6, September--October 2003.
[20] R L Bertini and A M El-Geneidy. Modeling transit trip time using archived bus dispatch system data. Journal of Transportation Engineering, American Society of Civil Engineers, 130(1):56--67, January 2004. doi: 10.1061/∼ASCE!0733-947X∼2004!130:1(56). [21] Ratna Yunita. Busway for jakarta: A pressing need. AsiaViews, October--November 2008. AsiaViews.