Comparison of Performances of Spectral Based Approaches on
Fabric Defect Detection
Hasan GÜLER*, Gökben ZOR**,
MahitGÜNEŞ
***,
*(Department of Computer Technologies, Kilis 7 Aralık University, TURKEY) ** (Department of Textile Technologies, Kilis 7 Aralık University, TURKEY)*** (Department of Electrical and Electronics Engineering, Kahramanmaras Sutcu Imam University, TURKEY)
ABSTRACT
In this paper, it is aimed to compare the performance of spectral based fault detection methods in quality control by testing on the same environment. The most widely used spectral based approaches as Fourier Transform, Wavelet Transform, Gabor Transform were used to extract features of the faulty fabric samples. By using statistical functions feature selection was done so huge dimensionality of features was decreased. The selected features are taken as inputs for feed-forward network (with the back propagation algorithm) to classify faulty fabrics in categories; weft, wrap and oil. All computations were performed in Matlab program so as to satisfy all conditions as the same. The analyses’ results show the Wavelet transform in terms of classification for three type defects was more efficient than the others, on other hand; Fourier transform in terms of processing time is faster than the others.
Keywords
-
fabric detection techniques, Fourier transform, Wavelet transform, Gabor transform, classification defectsI.
I
NTRODUCTIONInspection of fabric defects is vital in terms of quality control due to reliability, accuracy and production cost in textile industry. Human vision quality control can be effective in detecting distinctive faults. However, a trustable, objective and stable automatic quality control is necessary to increase the accuracy of inspection of fabric defects and to decrease the production cost instead of human vision control. In despite of that it is not possible 100 % defect free fabric production; the defect level can be decreased to minimum with the automatic control. In past years, for automatic fabric defect detection, statistical, spectral, model-based, structural and neural network approaches were performed. In these approaches, spectral based detection methods got more importance than the others because; they especially enable to detect small defects on fabrics. The mostly used spectral based approaches are Fourier, Wavelet and Gabor transform.
It is seen that Fourier transform among spectral based approaches firstly was used for detection [1-4]. Campbell et al. [5] implemented Fourier transform with an 11 layer NN. Campbell and Murtagh [6] used windowed Fourier transform on denim fabrics. In [7, 8], for fabric defect detection and Fourier transform was compared with K-L transform. The researchers implemented Fourier transform on real fabric images
for four type defects by selecting two central spatial frequency spectrums from a 3D Fourier frequency spectrum [9, 10]. A Fourier analysis model was proposed by Tsai and Hu [11] on four different types of fabric defects including missing end, missing pick, broken fabric and oily fabric. Millán and Escofet [12] introduced Fourier-domain-based angular correlation to identify similar periodic patterns, even though the defective fabric sample image was rotated and scaled. Baştürk et al. [13] used Fourier transform, thresholding and Gabor filtering for 9 type defects. Zhao et al. [14] proposed Fast Fourier transform and self-adaptive spectrum. Mean and standard deviation values of local energy were used to get feature vectors. Jayashree and Subbaraman [15], researched Fourier power spectrum and morphologic filters to get periodical features of fabrics.
By using wavelet transform, Sari-Sarraf and Goddard [16] improved a vision based fabric defect inspection system which has a success rate 89% all over small fabric defects. D. Karras [17] has developed a new method based the Discrete Wavelet Transform Analysis and the Support Vector Machines (SVM) classification. Zhi et al. [18] applied adaptive wavelet to detect fabric defects for inspection. Serdaroğlu et al. [19] proposed a novel solution combining ICA and wavelet concepts. This solution showed that implementing wavelet analysis before
ICA raised the fabric defect detection rate measured up to the wavelet transform and ICA alone. Latif-Amet et al. [20] used co-occurrence matrices and MRF (Markov Random Fields) by obtaining features from wavelet decomposed image. Jasper et al. [21, 22] applied wavelet analysis. Yang et al. [23] detailed adaptive wavelet- from single adaptive wavelet to the multiple adaptive wavelets. The results showed 98.2% success rate in the detection of 56 faulty fabric images including eight types of defects and 64 defect free ones. In reference [24], the study which was performed by using wavelet transform for the inspection of 45 defective fabric samples showed 100% accuracy rate. Liu and Qu [25] performed wavelet transform (db5 wavelet) on 30 images and succeeded classification at 95% rate using back-propagation NN. Guan and Shi [26] got a 92.5% success rate analyzing fabric images with db1, db2, db3 db4 wavelet at first level. Han and Shi [27] proposed a novel approach based on co-occurrence matrices extracted from approximation sub-band images. Jiang et al. [28] proposed optimal wavelet transform tree. The study was done with entropy and energy values of the sub-band images. Liu et al. [29] performed a classification on nonwoven fabrics using wavelet texture analysis and LVM. Su et al. [30] obtained a 96.5% success rate using wavelet energies and backpropagation NN. Guan [31] performed a one level transform for normal faults and multiple levels transforms for small defects on 160 fabric images. He classified them over 95% by using features as standard deviation, entropy, energy etc. Liu et al. [32] studied on nonwoven fabrics using wavelet energy and Bayesian NN. The 18 characteristic features of images obtained from third level decomposition provided a 98% success rate, additionally 24 features obtained from fourth level decomposition raised success up to 99%. Liang et al. [33] achieved 90% classification success rate by using discrete wavelet, statistical measurement and Fuzzy NN.
In reference [34-36], a Gabor filter family was used by tuning to several resolutions and orientations for texture segmentation. Kumar and Pang [37] performed fabric defect detection using only real Gabor functions. Shu et al. presented a method for automatic fabric defect detection based upon multi-channel and multi-scale Gabor filtering [38]. Han and Zhang [39] proposed Gabor filter masks to detect fabric defects. Arivazhagan and et al. [40] applied Gabor wavelet transform to detect fabric defects. In reference [41], an odd symmetric real-valued and an
even symmetric real-valued Gabor filter were presented. In the study, overall recognition accuracy was 96.2% on 39 defects samples. Baştürk et al. [42] used Gabor wavelet filtering and reduced features vectors with PCA. Liu et al. [43] performed feature extraction in both time and frequency domain using Gabor filtering to detect defects. Mak and Peng [44] performed online fabric defect detection. They used Gabor wavelet network and caught a success rate 96%. In reference [45], the proposed approach was based on Gabor filter masking and morphologic filtering for adaptive thresholding. Zhang et al. [46] combined Gaussian and Gabor transform and achieved classification of 360 defective images at 87%success rate. Chen et al. [47] used thresholding, standard deviation and fusion, which were obtained from coefficients of applied Gabor filtering for defect detection. Zhang et al. [48] introduced a real defect detection system for cord fabric. Using Gabor transform online and offline defect detection testing gave good performance and correct results.
In literature, previous studies show that fabric defect detection and classification were performed by using some spectral based methods for different fabric samples. However; the same data (fabric samples) should be used to determine objectively which method supplies best performance in terms of the ability of detection and process time. In this study, the methods were compared in the same environment (computer, program etc.) by using the same fabric samples. Hence, the most suitable method amongst the three methods for online fabric defect detection was searched.
II.
M
ATERIALA
NDM
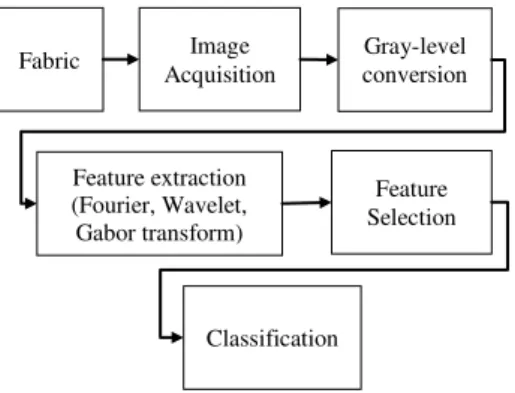
ETHODSFig. 1The fabric detection schema.
II.1 Feature Extraction II.1.1 Fourier Transform
With Fourier series any periodic function or signal can be expressed as the sum of the series of sine and cosine wave in varying amplitudes and frequencies. The Fourier transform in image processing gives an image as a sum of complex numbers of varying magnitudes, frequencies, and phases. Fourier transform helps to investigate the image characteristics in the frequency domain. So, the Fourier transform in image processing applications such as image analysis, enhancement etc. has a significant importance. If f(m,n) is a function of two discrete spatial variables m and n, then the two-dimensional Fourier transformof f(m,n) is defined by the relationship in the equation 1:
( 1, 2 ) = , − 1
∞
=−∞
− 2
∞
=−∞ (1)
The variables 1 and 2 are frequency variables; their units are radians per sample. F( 1, 2) is often called the frequency-domain representation of f(m,n). In general,since Fourier transform computationallylasts long, fast Fourier transform (FFT) is used to decreasethe process time. FFT is a reformed algorithm of discrete Fourier transform which maycomputationally save lots of time. In our study, after the faulty images were converted into gray-level, they were split into 256×256 pixels sub-images because image width and length ought to be power of two for FFT which we used to enable fast computation. After FFT computation, the magnitude of frequency spectrum was used to select feature vectors because it does not change when the fabric is moved up. The spectrum is only varied by the change of fabric structure [9].
Fig. 2a) Original image b) Transformed image (with FFT)
Fig. 2 (a) shows original image and (b) shows a representation of the Fourier transform by applying a logarithmic transformation because normally the dynamic range of the Fourier coefficients is too large to be displayed.
II.1.2 Wavelet Transform
The wavelet transform provides powerful insight into an image’s spatial and frequency characteristics at multiple resolutions [49], the wavelet transform, a mathematical tool developed by Mallat[50], is particularly well adapted to the use of wavelet bases in image processing. Wavelet transform is decomposition of a signal with the orthogonal basis functions. Two functions exists; the mother wavelet and scaling function [51]. So as to construct the mother wavelet in the wavelet transform the scaling function ∅ x is firstly determined (eq. 2)
∅ x = 2 h k 2x−k .
k (2)
The mother wavelet (x) is generated by using the given equation above.
a
b Fabric Acquisition Image
Feature extraction (Fourier, Wavelet, Gabor transform)
Feature Selection
Classification
� = 2 2 −
where = (−1) 1− (3)
The mother wavelet,shown as (x), is got through translation and dilation of the function.
� , = 2− /2�(2− − ) (4)
where m and n are integers. Since m,n (x) forms an orthonormal basis,
, = � , +∞
−∞ (5)
and the wavelet decomposition is then
= , ,
� ,
(6) In the decomposition, the scaling function and the mother wavelet functions needn’t to be computed; transform coefficients can be obtained by the functions h(k) and g(k) recursively. A decomposition at J-level can be expressed as
= 0, ∅0,
= ( +1, ∅ +1, + +1, =0
�+1, )
(7) the coefficients c0,k are given at the scale j+1, the coefficients cj +1,n and dj +1,nare associated to the coefficients cj,n at the scale j through
+1, = , −2 (0≤ ≤ )
(8)
+1, = , −2 (0≤ ≤ )
(9) The meaning of these expressions in signal processing is that to obtain cj +1,n and dj +1,n at resolution j+1 , coefficients cj,n and dj,n at level j is to be convolved with the functions ~( ) and ~( ).
Decomposition in the conventional wavelet transform scheme that is also called pyramid structured wavelet transform. The completion of the process, the output of J-level decomposition is obtained the low-resolution coefficient cj,n and detail coefficients dj,n for each level j.(Fig.3)
Fig. 3Two-level pyramid structure decomposition scheme
In the image processing, 2-D wavelet that is an expression of the 2-D basis functions with two 1-D wavelet basis functions along horizontal and vertical directions is to be used rather than 1-D wavelet transform.
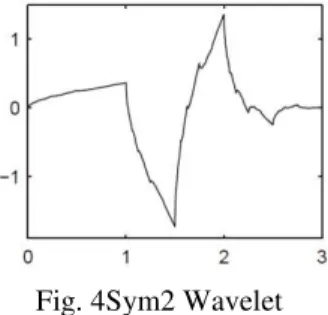
Fig. 4Sym2 Wavelet
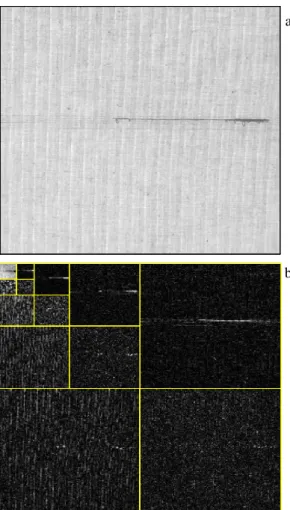
Symlet wavelet 2 (sym2) (Fig. 4) from wavelet families was used at level 4 for analysis, the approximation coefficients at level 4 and the detail coefficients at level 1,2,3,4 were used for this paper. The symlets are nearly symmetrical wavelets proposed by Daubechies as modifications to the db family. When a 256×256 pixels image was decomposed, 129×129 pixels approximation image (A1),129×129 pixels horizontal detail image (HD1), 129×129 pixels vertical detail image (VD1) and 129×129 pixels diagonal detail image (DD1) were obtained, the next process composes 4×66×66 pixels decomposed images - A2,HD2,VD2,DD2 and so on.(Fig.5).
( ) ~ cj-1,n
2 2
( ) ~
~ ( )
~
2 2 cj,n
dj,n
Fig. 5a) Original image b) decomposed image up to level 4(with sym2)
II.1.3 Gabor Transform
Gabor filters have been widely used in image processing applications. The Gabor transform provides an effective way to analyze images and has been elaborated as a frame for understanding the orientation and spatial frequency selective properties of images. D. Gabor [52] firstly defined the 1-D Gabor function and Daugman [53] extended that to a 2-D filter later. The expression of the Gabor filter mathematically is
�,� ,� , = � ,
⋅ 2� � �
+ � (10)
where
� =
1
2��2exp −
2+ 2
2�2 and = −1 (11)
The parameters of a Gabor filter are given by the frequency φ, the orientation θ and the scale σ. The Gabor filter Gσ,φ,θ(x, y) forms complex valued
function. Each of the complex Gabor filters has the real and imaginary parts that are conveniently implemented as the spatial mask of NxN sizes.The
Gabor filter Gσ,φ,θ(x, y) decomposes into real and
imaginary parts:
�,� ,� , =��,� ,� , + �,� ,� , (12)
where
��,� ,� , = �( , ). [2��( �
+ � )]
�,� ,� , = �( , ). [2��( �
+ � )] (13)
The filtered output of the image is got by the convolution of the image f (x, y) with the Gabor filter
Gσ, φ,θ(x, y) , as following
, . �,�,�( , )
∞
−∞ ∞
−∞ (14)
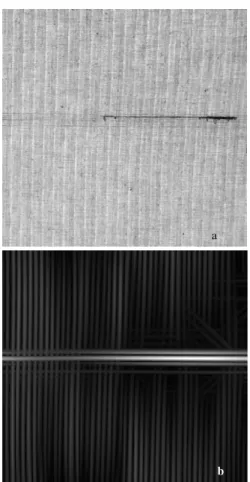
In this study, the faulty fabric images were convolved with the created Gabor kernels at eight orientations (0, 45, 90, 135, 180, 225, 270, 315 degrees) and two phases (0, 90 degrees). After convolution, 16 filtered images were obtained. Fig. 6 showsthe original image (a) and the Gabor filtered images (b) at 0, 45, 90, 135 degrees. The convolution results for the given orientations can be combined in a single output image.Using the L2, L1 or L-infinity norms, the combination is able to be made in different ways.This is called superposition of phases, here, this paper used L2 norm to combine the filtered images in a single image. In L2 norm, the squared values of the convolution results for the concerned orientation are added together wise and followed by a pixel-wise square root computation. Fig. 7 shows the fabric image (a) and the combined image with L2 norm(superposition) (b).
Fig. 6Real andtheGabor filtered images (θ=0,45,90,135)
a)Real Fabric image
b) Gabor filtered images
a
Fig. 7 a) Fabric image and b) Combined image with L2 norm
II.2 Feature Selection
Feature selection is a process to reduce feature vector dimension selecting the most identifier ones for classification.In order to select features, some statistical functions are generally used. In the study, median, mean, max, min and standard deviation were used as statistical functions.
For Fourier transform, feature selection was done in that way: The magnitude of frequency spectrum was computed from each transformed fabric image with FFT. The obtained coefficient matrix from magnitude is normally 256×256 matrix. By applying these statistical functions as rows-wise, these features (coefficients) were reduced to 1280×1.
For wavelet transform, feature selection was done in that way:After performing wavelet transform for each fabric images up to level 4, the detail coefficients of each level sub-images and fourth level approximation coefficients consists of [129×129]×3+[66×66]×3+[34×34]×3+[18×18]×3 matrices and 18×18 matrix respectively. The horizontal, vertical and diagonal detail coefficients of each level -for example, HD1, VD1, DD1, HD2, VD2, DD2 etc. were decreased to 789×1 by
computing standard deviation as rows-wise and other statistical functions as normal (two dimensional). Finally, fourth level approximation coefficients (A4) were added to those, so the feature vectors to be used becomes an 1113×1 (324+789) matrix.
For Gabor transform, feature selection was done in that way:The Gabor features of the image were obtained by convolving the image with the family of Gabor filter kernels.The filtering at eight orientations generates8× [256×256]filtered images. With superposition technique these images were reduced to 256×256 (fig. 7). By applying these statistical functions as rows-wise, these features (coefficients) were reduced to 1280×1.
The selected features(featurevectors) were kept for further processing (they all will be provided for the feed-forward networkas inputs).
II.3Classification of Fabric Defects with Feed-forward Networks
Feed-forward networks were introduced as models of biological neural networks [54], in which neurons and edges corresponded to synapses, and with an activation function g(a) given by a simple threshold. With the recent developments, feed-forward networks have widely proceeded in almost all fields and especially for pattern recognition and classification. A feed forward network with back propagation algorithm is a supervised and a fast neural network in terms of execution speed. For this reason, this network can be chosen for the classification of faulty fabrics pattern. A feed forward network simply consists of one input layer, one or more hidden layers and an output layer. Feed forward neural network architecture is shown in Fig. 8.
Fig. 8Feed forward neural network architecture A feed-forward network (FNN) can be viewed as a graphical representation of parametric function which takes a set of input values and maps them to a corresponding set of output values [55]. Here, inputs are transformed into hidden layers’ neurons and the inputs values are computed with bias and some weights to find new weight in neurons. Each neuron
Input Layer Hidden Layer Output Layer
Inputs
bias
Output a
performs a weighted summation of the inputs, which then passes a nonlinear activation functiong(a), also called the neuron function[56]. In detail, the output of
the kth hidden node is obtained by first forming a weighted linear combination of the n input values to give equation as following;
= +
=1 (16)
The value of hidden variable k is then obtained by transforming the linear sum using an activation function ( ) to give equation below;
= (
)
(17)Tan-Sigmoid transfer function used in the feed forward network can mathematically be expressed as;
(
)
≡
(
)
(18)Tan-Sigmoid transfer function is graphically showed in Fig.9.
Fig. 9Tan-Sigmoid transfer function
Finally, the outputs of the network are obtained by forming linear combinations of the hidden variables to give equation below;
=
+
=1 (16)
Here, , are the weight parameters , are the bias parameters and together they constitute the adaptive parameters in the network.
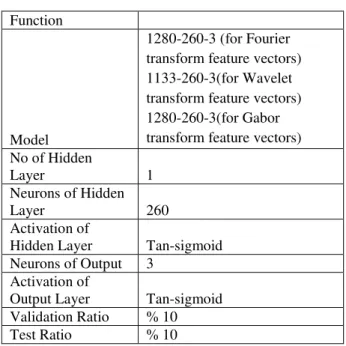
A feed forward network with back-propagation algorithm was used to classify the faulty fabric patterns in this study. The specifications of the built FNN using Artificial Neural Network Toolbox of MATLAB are given in Table 1.
Table 1ANN model’s specifications Paradigm Supervised
Training function
Levenberg-Marquardt backpropagation
Architecture
Feed-forward Multilayer perceptron
Performance MSE
Function
Model
1280-260-3 (for Fourier transform feature vectors) 1133-260-3(for Wavelet transform feature vectors) 1280-260-3(for Gabor transform feature vectors) No of Hidden
Layer 1
Neurons of Hidden
Layer 260
Activation of
Hidden Layer Tan-sigmoid Neurons of Output 3
Activation of
Output Layer Tan-sigmoid Validation Ratio % 10
Test Ratio % 10
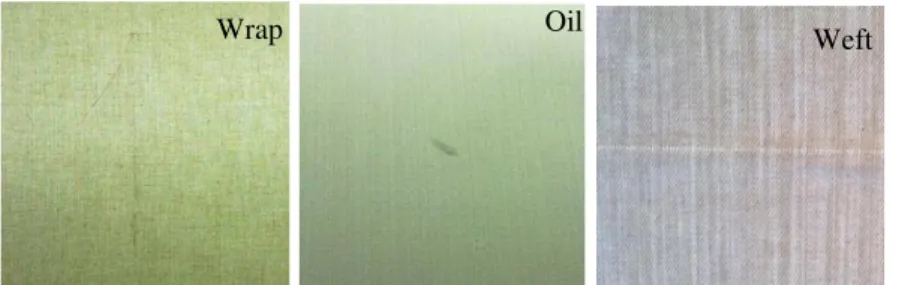
Fig. 10Wrap, Oil and Weft faulty fabric images in size 256x256 px
Table 2Fourier transform Feature vectors
Fabric Images
Coefficients
Median
Mean
Standard
Deviation Max Min
Wrap Defective Fabric 325.9578 734.403 16892.46 4322832 1.38909
Oil Defective Fabric 248.575 536.8611 27237.02 6902332 0.621525
Weft Defective Fabric 724.3228 3362.448 32019.03 7582989 0.82496
Table 3Wavelet transform Feature vectors
Fabric Images
Coefficients (for first level)
Median
Mean
Standard
Deviation Max Min
Wrap Defective Fabric 129.8427 131.9887 6.119341 278.8953 85.57092
Oil Defective Fabric 219.6842 210.9249 12.62361 269.924 97.62292
Weft Defective Fabric 275.8225 231.5394 19.02905 512.2342 -1.89166
Table 4Gabor transform Feature vectors
Fabric Images
Coefficients (for first scale and first orientation)
Median
Mean
Standard
Deviation Max Min
Wrap Defective Fabric 6.536469 7.732544 2.451884 71.09008001 0.012208
Oil Defective Fabric 2.479286 2.877909 0.217305 12.48378961 0.007428
Weft Defective Fabric 79.16018 84.28812 9.253975 217.1705645 0.458456
Lasted time for computation of Fourier, Wavelet and Gabor transform and feature selections of them were held as shown in Table 5. When compared to each other,it is clearly seen that Fourier transform runs faster than the other transforms. On the hand, Gabor transform is slower among all transforms.
Table 5The elapsed time for transforms and feature selection
Fabric Images
Time in seconds
Fourier Wavelet Gabor
Image 1 0.1275 0.0272 1.0723
Image 2 0.0276 0.0256 0.9597
Image 3 0.0102 0.0266 0.9510
Image 4 0.0102 0.0254 0.9521
Image 5 0.0103 0.0261 0.9490
Image 6 0.0100 0.0263 0.9590
Image 7 0.0100 0.0251 0.9521
Image 8 0.0102 0.0277 0.9536
Image 9 0.0102 0.0280 0.9530
Image 10 0.0100 0.0279 0.9587
Image 11 0.0104 0.0285 0.9768
Image 12 0.0101 0.0300 1.0908
Image 13 0.0102 0.0313 0.9740
Image 14 0.0101 0.0315 0.9702
Image 15 0.0100 0.0274 0.9600
Image 16 0.0102 0.0289 0.9611
Image 17 0.0102 0.0270 0.9727
Image 18 0.0101 0.0287 1.0084
Image 19 0.0100 0.0255 1.0988
Image 20 0.0103 0.0259 1.0332
For this study, other performance criterion is the success rate of the classification of the fabric defects. To evaluate classification performances of networks, networks performance function is examined. Performance function of the designed feed forward networksis mean squared error (MSE). MSE means the average squared difference between outputs and targets. Fig. 10 shows the comparison of the targets and the outputs of the designed FFN that uses the feature vectors obtained from Fourier transform operations. Fig. 12, 14 shows the same targets and outputs comparison of the networks used for Wavelet and Gabor transforms. Fig. 11, 13, 15 shows the errors between the targets and the outputs for all transforms.
Fig. 11Comparison of the targets and the outputs (for Fourier transform feature vectors)
Fig. 12Errors between the targets and the outputs (for Fourier transform feature vectors)
Fig. 13Comparison of the targets and the outputs (for Wavelet transform feature vectors) 0
0.2 0.4 0.6 0.8 1 1.2
1 5 9 13 17 21 25
Targets Outputs
-0.1 0 0.1 0.2 0.3 0.4 0.5
1 5 9 13 17 21 25
Errors
0 0.2 0.4 0.6 0.8 1 1.2
1 5 9 13 17 21 25
Fig. 14Errors between the targets and the
outputs (for Wavelet transform feature
vectors)
Fig. 15Comparison of the targets and the
outputs (for Gabor transform feature vectors)
Fig. 16Errors between the targets and the
outputs (for Gabor transform feature vectors)
Table 6Classification Results
The used approaches Classification
success rates (%) MSE
Fourier transform based
approach 84 0.0736
Wavelet transform based
approach 96 0.0346
Gabor transform based
approach 92 0.0687
Table 6 shows the success rates of the networks classifications. Lower values for MSEshows better classification performance and zero means no error.
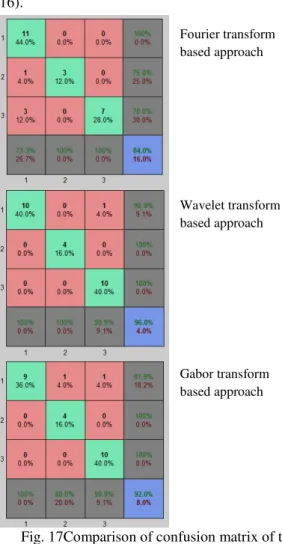
MSE of wavelet transform based approach is the smallest one (0.0346) and MSE of Fourier transform based approach is the highest one (0.0736). Plotting the network confusion matrix gives information how successful the network is in the classification (Fig. 16).
Fig. 17Comparison of confusion matrix of the networks
In terms of the networks classification performances, Wavelet transform based approach gave the highest success rate at 96%. Gabor transform based approach has a success rate %85. Fourier transform based approach the lowest success %80.
IV.
C
ONCLUSIONThis study was done to determine which spectral based approach for fabric defect detection is superior to the others in terms of both accuracy in classification of fabric defects and time elapsed for detection. The main criteria for performance measurement are the time lasted for the applied technics and the success rate in the classification. Fourier Transform, Wavelet Transform and Gabor Transform were used as spectral based approaches. The experimental results show the Wavelet transform based approach in the classification for -0.1
0 0.1 0.2 0.3 0.4 0.5
1 5 9 13 17 21 25
Errors
0 0.2 0.4 0.6 0.8 1 1.2
1 5 9 13 17 21 25
Targets Outputs
-0.1 0 0.1 0.2 0.3 0.4 0.5
1 5 9 13 17 21 25
Errors
Fourier transform based approach
three type defects was more efficient than the others, on other hand; Fourier transform in terms of processing time is faster than the others.
R
EFERENCES[1] Wood E., “Applying Fourier and Associated Transforms to Pattern Characterization in Textiles”, Textile Research Journal, 60, 212-220, 1991.
[2] Ravandi, S. A., and Toriumi, K. Fourier Transform Analysis of Plain Wea and Fabric Appearance. Textile Research Journal, 65(11) : 676–683, 1995.
[3] Hoffer, L. M., Francini, F., Tiribilli, B., and Long, G., Neural Network for The Optical Recognition of Defects in Cloth. Optical Engineering, 35(11) : 3183-3190, 1996. [4] Escofet, J., Millan, S., Abril, ,. H., and
Torrecilla, E. Inspection of Fabric Resistance to Abrasion by Fourier Analysis. Proceedings of SPIE on Optics in Computing, 22 May 1998, s. 207-210,1998.
[5] Campbell, J. G., Hashim, A. A., and Murtagh, F. D., Flaw Detection in Woven Textiles using Space-dependent Fourier Transform. Ulster, UK. INFM-97-004, 16 May 1997, Faculty of Informatics, Magee College, University of Ulster. UK. s. 1-8,1997.
[6] J. G. Campbell and F. Murtagh, “Automatic visual inspection of woven textiles using a two-stage defect detector,” Opt. Eng., vol. 37, pp. 2536-2542, Sep. 1998
[7] Özdemir, S., Baykut, A., Meylani, R., Ercil, A., and Ertuzini, A., Comparative Evaluation of Texture Analysis Algorithms For Defect Inspection of Textile Products. Proceedings of the IEEE 14th International Conference on Pattern Recognition, 2, s. 1738-1740,1998. [8] Tsai, D. M., and Hsieh, C. Y., Automated
Surface Inspection for Directional Textures. Image and Vision Computing, 18 : 49-62, 1999.
[9] Chan, C. H., and Pang, G. K., Fabric Defect Detection by Fourier Analysis. IEEE Transactions on Industry Applications, 36 : 1267-1276, 2000.
[10] Sengottuvelan, P. A., Wahi, A., and Shanmugam, A., Automatic Fault analysis of Textile fabric Using Imaging Systems. Research Journal of Applied Science, 2008. [11] I. S. Tsai and M. C. Hu, “Automated
inspection of fabric defects using an artificial neural networks,” Text. Res. J., vol. 66, pp. 474-482, Jul. 1996
[12] Millán M.S., Escofet J., “Fourier domain based angular correlation for quasiperiodic pattern recognition. Applications to web
inspection”, Appl. Opt. 35(31), 6253-6260 (1996)
[13] Baştürk, A., Ketencioglu, H., Yugnak, Z., Yildiz, C., and Yuksel, M. E. 2005. Detection of Local Defects in Fabrics Using Gabor Filter Banks. Proceedings of the IEEE 13th. Signal Processing and Communications Applications Conference, 16-18 May 2005, Dept. of Comput. Eng., Erciyes Univ., Kayseri, Turkey. s. 17-20.
[14] Zhao, D. X., Wang, H., Zhu, J. L., and Li, J. L. 2008. Research on a New Fabric Defect Identification Method. International Conference on Computer Science and Software Engineering, 2, s. 814-817.
[15] Jayashree, V., and Subbaraman, S. 2011. DCSFPSS Assisted Morphological Approach for Grey Twill Fabric Defect Detection and Defect Area Measurement for Fabric Grading. International Symposium Electronic System Design, s. 290-295.
[16] H. Sari-Sarraf and J. S. Goddard, “Vision systems for on-loom fabric inspection” IEEE Trans. Ind. Applicat., vol. 35, pp. 1252–1259, 1999.
[17] D. Karras, “Improved defect detection in textile visual inspection using wavelet analysis and support vector machines,” ICGST Int. J. Graph., Vis., Image Process. 2005
[18] Zhi, Y. X., Pang, G. K. H. and Yung, N. H. C., “Fabric defect detection using adaptive wavelet”, IEEE International Conference on Acoustics, Speech and Signal Processing, 2001.
[19] Serdaroğlu A., Ertüzün A., and Erçil A., “Defect Detection in Textile Fabric Images Using Wavelet Transforms and Independent Component Analysis Transforms and Independent Component Analysis”, Pattern Recognition and Image Analysis, 2006, Vol. 16, No. 1, pp. 61–64.
[20] L. Latif-Amet, A. Ertuzun, and A. Ercil.(2000), “An efficient method for texture defect detection: Subband domain co-occurrence matrices”, Image and Vision Computing, 18(6-7), pp. 543–553.
[21] Jasper W.J., Garnier S.J., Potlapalli H.,Texture characterization and defect detection using adaptive wavelets, Opt. Eng. 35(11), 3140-3149 (1996)
[22] Jasper W.J., Potlapalli H., "Image analysis of mispicks in woven fabric", Text. Res.J. 65(1), 683-692 (1995)
Proceedings Vision, Image Processing, 152(6), pp. 715–723. (2005).
[24] Özdemir D and Akarun L., “A fuzzy algorithm for color quantization of images”, Pattern Recognition, vol.35, pp.1785-1791, Oct 2002.
[25] Liu, G. S., and Qu, P. G. 2008. Inspection of Fabric Defects Based on Wavelet Analysis and BP Neural Network. Proceedings of the 2008 International Conference on Wavelet Analysis and Pattern Recognition, Hong Kong. s. 232-236.
[26] Guan, S., and Shi, X. 2008. Fabric Defect Detection Based on Wavelet Decomposition With One Resolution Level. IEEE International Symposium on Information Science and Engineering, s. 281-285.
[27] Han, Y., and Shi, P. 2007. An Adaptive Level-selecting Wavelet Transform for Texture Defect Detection. Image and Vision Computing, 25 : 1239-1248.
[28] Jiang, H., Dong, M., and Li, W. 2009. Detection of Fabric Defect Based on Optimal Tree Structure of Wavelet Decomposition. International Symposium on Intelligent Ubiquitous Computing and Education, s. 210-213.
[29] Liu, J., Zuo, B., Zeng, X., Vroman, P., and Rabenaso, B. 2010. Nonwoven Uniformity Identification Using Wavelet Texture Analysis and LVQ Neural Network. Expert Systems with Applications, 37(3) : 2241-2246.
[30] Su, T. L., Chen, H. W., THong, G. B., and Ma, C. -M. 2010. Automatic inspection system for defects classification of stretch knitted fabrics. International Conference on Wavelet Analysis and Pattern Recognition, s. 125-129.
[31] Guan, S. 2010. Fabric Defect Detection Based on Fusion Technology of Multiple Algorithms. International Conference on Signal Processing Systems, s. 553-557. [32] Liu, J., Zuo, B., Zeng, X., Vroman, P., and
Rabenaso, B. 2011a. Wavelet Energy Signatures and Robust Bayesian Neural Network for Visual Quality Recognition of Nonwovens. Expert Systems with Applications, 38(7) : 8497-8508.
[33] Liang, Z., Xu, B., Chi, Z., and Feng, D. 2012. Intelligent Characterization and Evaluation of Yarn Surface Appearance Using Saliency Map Analysis, Wavelet Transform and Fuzzy ARTMAP Neural Network. Expert Systems with Applications, 9(4) : 4201-4212.
[34] D. Dunn and W. E. Higgins, “Optimal Gabor filters for texture segmentation”, IEEE Trans. Image Processing, 4, pp. 947-964, 1995.
[35] Escofet J., Navarro R., Millán M.S., Pladellorens J., "Detection of local defects in textile webs using Gabor filters", in "Vision Systems: New Image ProcessingTechniques" Ph. Réfrégier, ed. Proceedings SPIE vol. 2785, 163-170 (1996).
[36] Escofet J., Navarro R., Millán M.S., Pladellorens J., "Detection of local defects in textile webs using Gabor filters", Opt. Eng. 37(8) 2297-2307 (1998)
[37] A. Kumar and G. Pang, “Fabric defect segmentation using multichannel blob detectors” Opt. Eng., vol. 39, no. 12, pp. 3176–3190, Dec. 2000.
[38] Y. Shu and Z. Tan, “Fabric Defects Automatic Detection Using Gabor Filters”, Proc. 5th World Congress on Intelligent Control and Automation, Hangzhou, China, 2004, 3378-3380.
[39] R. Han, L. Zhang, "Fabric Defect Detection Method Based on Gabor Filter Mask," Intelligent Systems, WRI Global Congress on, vol. 3, pp. 184-188
[40] S. Arivazhagan, L. Ganesan, S. Bama(2006), “Fault segmentation in fabric images using Gabor wavelet transform”, Machine Vision and Applications archive, Volume 16, pp. 356 – 363.
[41] K.L.Mak and P.Peng, “An automated inspection system for textile fabrics based on Gabor filters”, Robotics and Computer -Integrated Manufacturing, Vol.24, 2008, pp.359-369. (bul)
[42] Baştürk, A., Ketencioglu, H., Yugnak, H., and Yüksel, M. E. 2007. Inspection of Defects in Fabrics Using Gabor Wavelets and Principle Component Analysis. Sharjah, United Arab Emirates. 9th International Symposium on Signal Processing and Its Applications, 12-15 Feb. 2007, Dept. of Comput. Eng., Erciyes Univ., Kayseri, Turkey. s. 1-4.
[43] Liu, X., Wen, X., Su, X., and Choi, K. F. 2008. Slub Extraction in Woven Fabric Images Using Gabor Filters. Textile Research Journal, 78(4) : 320–325.
[44] Mak, K., and Peng, P. 2008. An automated inspection system for textile fabrics based on Gabor filters. Robotics and Computer-Integrated Manufacturing, 24 : 359-369. [45] Alimohamadi, H., Ahmadyfard, A., and
[46] Zhang, Y., Lu, Z., and Li, J. 2010. Fabric Defect Detection and Classification Using Gabor Filters and Gaussian Mixture Model, Asian Conference Computer Vision, Part II, Lecture Notes in Computer Science, s. 635-644.
[47] Chen, S., Feng, J., and Zou, L. 2010. Study of Fabric Defects Detection Through Gabor Filter Based on Scale Transformation. Zhejiang, China. International Conference on Image Analysis and Signal Processing, 9-11 April 2010, Sch. of Inf. Sci. & Eng., Jiangsu Polytech. Univ., Changzhou, China. s. 97-99. [48] Zhang, W., Zhao, Q., and Liao, L. 2010.
Development of a Real-time Machine Vision System for Detecting Defeats of Cord fabrics. International Conference on Computer Application and System Modeling, 12, s. 539-543.
[49] R.C. Gonzalez, R.E. Woods, Digital Image Processing, 2nd edition Prentice Hall, 2002. [50] Mallat, S. (1989), “A theory for
multiresolution signal decomposition: the wavelet representation,” IEEE Pattern Anal. and Machine Intell., vol. 11, no. 7, pp. 674– 693.
[51] Antonini, M., Barlaud, M., Mathieu, P. and Daubechies, I. "Image Coding Using Wavelet Transform", IEEE trans. Image Processing, Vol.1, pp. 205-220, 1992.
[52] D. Gabor, “Theory of communication,” J. Inst. Elec. Eng., 93, pp. 429-457, 1946. [53] J. G. Daugman, “Uncertainty relation for
resolution in space, spatial-frequency, and orientation optimized by two-dimensional visual cortical filters,” J. Opt. Soc. Amer., 2, pp. 1160-1169, 1985.
[54] McCulloch, W. S. and W. Pitts (1943). A logical calculus of the ideas immanent in nervous activity. Bulletin of Mathematical Biophysics 5, 115. 133. Reprinted in Anderson and Rosenfeld (1988).
[55] C.M.Bishop, "Neural networks for pattern recognition", Oxford University Press, 1995 [56] MATLAB-Neural Network Toolbox User