Artigo
*e-mail: [email protected]
COMBINED APPLICATION OF CONTINUOUS WAVELET TRANSFORM-ZERO CROSSING TECHNIQUE IN THE SIMULTANEOUS SPECTROPHOTOMETRIC DETERMINATION OF PERINDOPRIL AND INDAPAMID IN TABLETS
Gözde Pektaş and Erdal Dinç*
Department of Analytical Chemistry, Faculty of Pharmacy, Ankara University, 06100, Tandoğan, Ankara, Turkey
Dumitru Baleanu
Department of Mathematics and Computer Sciences,Faculty of Arts and Sciences, Çankaya University, 06530 Balgat, Ankara, Turkey / Institute of Space Sciences, National Institute for Laser, Plasma and Radiation Physics, Magurele-Bucharest, P.O. Box, MG-23, R 76911, Romania
Recebido em 24/5/08; aceito em 26/2/09; publicado na web em 4/8/09
Signal processing methods based on the combined use of the continuous wavelet transform (CWT) and zero-crossing technique were applied to the simultaneous spectrophotometric determination of perindopril (PER) and indapamide (IND) in tablets. These signal processing methods do not require any priory separation step. Initially, various wavelet families were tested to identify the optimum signal processing giving the best recovery results. From this procedure, the Haar and Biorthogonal1.5 continuous wavelet transform (HAAR-CWT and BIOR1.5-CWT, respectively) were found suitable for the analysis of the related compounds. After transformation of the absorbance vectors by using HAAR-CWT and BIOR1.5-CWT, the CWT-coefficients were drawn as a graph versus wavelength and then the HAAR-CWT and BIOR1.5-CWT spectra were obtained. Calibration graphs for PER and IND were obtained by measuring the CWT amplitudes at 231.1 and 291.0 nm in the HAAR-CWT spectra and at 228.5 and 246.8 nm in BIOR1.5-CWT spectra, respectively. In order to compare the performance of HAAR-CWT and BIOR1.5-CWT approaches, derivative spectrophotometric (DS) method and HPLC as comparison methods, were applied to the PER-IND samples. In this DS method, first derivative absorbance values at 221.6 for PER and 282.7 nm for IND were used to obtain the calibration graphs. The validation of the CWT and DS signal processing methods was carried out by using the recovery study and standard addition technique. In the following step, these methods were successfully applied to the commercial tablets containing PER and IND compounds and good accuracy and precision were reported for the experimental results obtained by all proposed signal processing methods.
Keywords: continuous wavelet transform; zero crossing technique; perindopril.
INTRODUCTION
In the research or industry laboratories, one of the main problems of analytical chemistry is the routine analysis and quality control of commercial pharmaceutical products containing two or more com-pounds with excipinents. For analytical measurements, liquid chro-matography (LC), capillary electrophoresis (CE), gas chrochro-matography (GC) and their hyphenated versions (LC-MS, CE-MS and CG-MS) have been used for the above main analytical problem. Generally, LC method of them has been proposed as main or comparison method for the determination of compounds in pharmaceutical and other samples. The above chromatographic methods and their hyphenated versions require a prior separation step and other tedious analytical process during analysis for searching optimal separation conditions. These methods using the combined devices bring high cost and time-consuming for analysis.
For the analytical purposes, derivative spectrophotometry (DS) and ratio spectra derivative spectrophotometry have been used ex-tensively in fast quantitative resolution of multi-component mixtures without any separation step. In some cases, these spectral methods may not lead desirable analytical results due to the following spectral factors: spectral characteristic of compounds, incorrect choice of Δl-interval, use of worst smoothing ratio for deformed spectra, unnecessary use of the scaling factor, and decreasing sig-nal intensity and worsening sigsig-nal-to-noise ratio (S/N) for higher derivative orders.
Taking into account the above conditions, analytical chemists need to develop new analytical techniques, approaches or methods to overcome the drawbacks of the above mentioned methods for the efficient quantitative resolution of the analytical problems. For these reasons, classical analytical methods in combination with many mathematical algorithms or signal processing tools have been used for solving the above problems.
In this context, one of the newest signal processing tools is wavelets. Applications of the wavelet transform (WT) have been extensively used in various fields of science and engineering. WT is classified into two categories; discrete wavelet transform and continuous wavelet transform.1 In analytical chemistry and related branches, the CWT approach is a powerful signal processing method for data reduction, de-noising, baseline correction and resolution of overlapping spectra.2,3 The developments of the CWT methods and their applications in the analytical chemistry have significantly amplified the potential power of various spectral methods. In recent studies, the combined use of the CWT methods with zero-crossing technique and ratio signals has opened a new door for the simulta-neous spectrophotometric resolution of binary and ternary mixtures without needing any separation step.4-11 In analytical chemistry, wavelet methods offer additional competence and performance in any spectral analysis application where DS method has been used.
agents, respectively. In the previous study, the simultaneous determi-nation of PER and IND in a commercial tablets was reported by spec-trophotometric and HPLC methods.12 Quantitative analysis of PER in single-component pharmaceutical samples and multi-component pharmaceutical samples containing other active compounds was performed by spectrophotometry13 and capillary electrophoresis,14 respectively. Determination of IND compound in biological liquids by using LC-ES-MS,15 LC-MS16 and HPLC17 IND and in pharmaceutical preparations by using spectrophotometric methods18-20 was performed.
In this work, two signal processing methods, HAAR-CWT and BIOR1.5-CWT were developed for the simultaneous spectrophotome-tric determination of PER and IND in their mixtures and tablets. Various wavelet families at different orders and scale parameters (a) were tried to determine the optimal signal processing technique to obtain highest recovery results for analysis. HAAR-CWT and BIOR1.5-CWT were found to be suitable for the determination of the related compounds. As comparison methods, DS and HPLC were used to confirm the re-sults provided by HAAR-CWT and BIOR1.5-CWT approaches. The proposed signal processing methods, HAAR-CWT, BIOR1.5-CWT and DS were validated by analyzing various PER-IND mixtures and by using standard addition technique. These signal processing methods were successfully applied to the quantitative analysis of the commercial pharmaceutical tablets of PER and IND compounds.
EXPERIMENTAL
Instruments and softwares
In the spectrophotometric analysis, the absorption spectra of the compounds and their samples were obtained by utilizing a Shimadzu UV-160 double beam UV–VIS spectrophotometer having a fixed slit width (2 nm) connected with a computer loaded with Shimadzu UVPC software and a Lexmark E-320 printer. In the application of the CWT and DS approaches, the Microsoft Exceland Wavelet Toolbox in Matlab 7.0 software were used for data treatments, regressions and statistical analysis.
Chromatographic analysis was performed by using an Agilent 1100 series HPLC system (Agilent Technologies, Inc., CA, USA) with a multiwavelength diode array detector (DAD). Data were acquired and processed by using HP Chem. Station for LC [Rev. A0.01 (403)] (Agilent). Waters SymmetryC18 (25 cm x 4 mm x 5 mm) column was used for the chromatographic separation.
Chromatographic conditions
The mobile phase is a mixture of acetonitrile, buffer (0.1 M H3PO4-NaH2PO4, pH=2.12) and water (45:45:10, v/v/v). The flow rate was maintained at 2.0 mL and the injection volume was 25 mL. The mobile phase was prepared daily and filtered through a 0.45 mm mem-brane filter. Spironolactone (IS) was used as internal standard. The HPLC separations were conducted at ambient temperature (25 oC).
Commercial pharmaceutical preparations
A commercial pharmaceutical preparation (Coversyl® Plus Tablet, Servier Pharm. Ind., Istanbul, Turkey, Batch No: 401348) containing 4.0 mg PER and 1.25 mg IND per tablet was studied. PER and IND compounds were kindly donated by National Pharm. Ind. Companies, Turkey).
Standard solutions
Stock standard solutions were separately prepared by
dissolv-ing 50 mg PER and 25 mg IND in 100 mL solvent consistdissolv-ing of methanol and 0.1 M NaOH (50:50, v/v). A standard series of each compound in the concentration range 25.0-105.0 mg/mL for PER and 3.0-19.0 mg/mL for IND in the above solvent was prepared from the stock standard solutions. An independent validation set consisting of 10 synthetic mixture solutions of PER and IND in the above working concentration ranges was prepared. For the standard addition technique, the sample solutions, adding the stock solution of each compound to tablets, were prepared in the working concentration range at three different concentration levels for six replicates to evaluate the interference of excipients on the analysis.
Preparation of the commercial tablet for analysis
In this procedure, ten tablets were accurately weighed by using an electronic balance and tablet content was powdered in a mortar. An amount containing PER and IND equivalent to 1/8 tablet content was dissolved in methanol and 0.1 M NaOH (50:50, v/v) and made up in 100 mL calibrated flask. This flask containing PER and IND was mechanically shaken for 25 min and filtrated into a 100 mL volumetric flask through a 0.45 mm membrane filter. The resulting solution was diluted to the working concentration range. This sample preparation was repeated ten replicates. The absorption spectra of these tablet solutions were processed by HAAR-CWT, BIOR1.5-CWT and DS methods for the determination of PER and IND in tablets.
RESULTS AND DISCUSSION
Signal processing method development
Nowadays, the CWT methods have been used as modern and robust signal processing methods in analytical chemistry or the spectrophotometric quantitative analysis. The combined application of CWT and zero-crossing technique is a very useful approach for the quantitative resolution of the commercial pharmaceutical samples containing two or more active compounds together with a constant matrix or excipients without requiring any separation procedure. In our case, various wavelet families were tried to the absorption signals of PER and IND and then HAAR-CWT and BIOR1.5-CWT were identified as suitable signal processing methods for the determination of PER and IND having overlapping spectra. It was observed that both HAAR-CWT and BIOR1.5-CWT gave rapid, accurate and precise results for the routine quality control of the tablets containing PER and IND compounds. In addition to that the determination results obtained by CWT approaches were validated with those obtained by HPLC and DS methods. The proposed signal processing applications was given below.
CWT signal processing method
vectors to reach the best recovery results and HAAR-CWT (a=256) and BIOR1.5-CWT (a=300) approaches were found suitable for the determination of PER and IND in their samples.
The HAAR-CWT and BIOR1.5-CWT spectra were obtained by plotting the wavelet coefficients (Ca,b) versus the wavelength in the range of 210-312.3 nm (Figures 2 and 3).
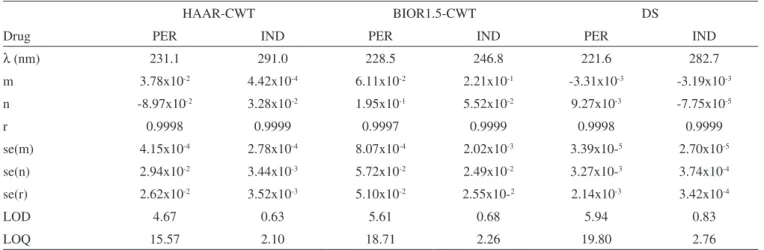
In the application of HAAR-CWT method, the calibration equation of the analyzed compounds were obtained by measuring the CWT amplitudes at 231.1 nm for PER and 291.0 nm for IND as indicated in Figure 2. At the above wavelength points, the linear regression analysis and its statistical results were presented in Table 1. The amounts of PER and IND compounds in their samples were calculated by using the linear regression equations.
In the case of BIOR1.5-CWT application, the calibration equa-tion for the related compounds were calculated by using the CWT amplitudes at 228.5 nm for PER and 246.8 nm for IND (Figure 3). For the working wavelength points, the results of the statistical linear regression analyses were depicted in Table 1. PER and IND in samples were determined by the linear regression lines obtained by using the slopes and intercepts presented in Table 1.
Figure 1. Absorption spectra of 25.0, 45.0, 65.0, 85.0, 105.0 µg/mL PER (—) and 3.0, 7.0, 11.0, 15.0, 19.0 µg/mL IND (----) in methanol and 0.1 M NaOH (50:50, v/v)
Figure 2. HAAR-CWT spectra of 25.0, 45.0, 65.0, 85.0, 105.0 µg/mL PER (—) and 3.0, 7.0, 11.0, 15.0, 19.0 µg/mL IND (----) in methanol and 0.1 M NaOH (50:50, v/v)
Figure 3. BIOR1.5-CWT spectra of 25.0, 45.0, 65.0, 85.0, 105.0 µg/mL PER (—) and 3.0, 7.0, 11.0, 15.0, 19.0 µg/mL IND (----) in methanol and 0.1 M NaOH (50:50, v/v)
Table 1. Statistical results of the linear regression analysis for PER and IND compounds
HAAR-CWT BIOR1.5-CWT DS
Drug PER IND PER IND PER IND
l (nm) 231.1 291.0 228.5 246.8 221.6 282.7
m 3.78x10⁻² 4.42x10⁻⁴ 6.11x10⁻² 2.21x10⁻¹ -3.31x10⁻³ -3.19x10⁻³
n -8.97x10⁻² 3.28x10⁻² 1.95x10⁻¹ 5.52x10⁻² 9.27x10⁻³ -7.75x10⁻⁵
r 0.9998 0.9999 0.9997 0.9999 0.9998 0.9999
se(m) 4.15x10⁻⁴ 2.78x10⁻⁴ 8.07x10⁻⁴ 2.02x10⁻³ 3.39x10⁻⁵ 2.70x10⁻⁵
se(n) 2.94x10⁻² 3.44x10⁻³ 5.72x10⁻² 2.49x10⁻² 3.27x10⁻³ 3.74x10⁻⁴
se(r) 2.62x10⁻² 3.52x10⁻³ 5.10x10⁻² 2.55x10⁻² 2.14x10⁻³ 3.42x10⁻⁴
LOD 4.67 0.63 5.61 0.68 5.94 0.83
LOQ 15.57 2.10 18.71 2.26 19.80 2.76
DS signal processing method
As in the CWT application, DS method was applied to the simultaneous determination of PER and IND in samples. The ab-sorption spectra of PER and IND were recorded in the wavelength range 210-350 nm as shown in Figure 1. First order derivative of the absorption spectra of two compounds and their samples were calculated with the intervals of Δl = 16 nm and scaling factor of 10 in the range 210-325 nm selected from the above spectral range. The resulting spectra were smoothed at 25 points with intervals of
Δl = 5. Figure 4 shows first derivative spectra of PER and IND in the range 25.0-105.0 µg/mL of PER and 3.0-11.0 µg/mL of IND. Calibration graphs were obtained by measuring dA/dl values at 221.6 nm for PER and 282.7 nm for IND. The statistical results for the linear regression analysis were illustrated in Table 1. The calculated calibration equations were applied to the quantitative analysis of PER and IND in samples.
HPLC method
A standard series of the solutions containing 25-105 mg/mL for PER and 3-19 mg/mL for IND was obtained by using the stock solutions of 25 mg/100 mL PER and IND prepared in a mobile phase consisting of acetonitrile, buffer (0.1 M H3PO4-NaH2PO4 , pH=2.12) and water (45:45:10, v/v/v). In all of the chromatographic study, 25 mg/mL HCT as internal standard was added into each solution. All the solutions were prepared fresh and protected from light. Retention times of PER, IND and IS were observed as 1.55, 3.39 and 7.50 min, respectively, on Figure 5. The HPLC separations were conducted at ambient temperature (25 oC). Aliquots of 25 mL were injected by auto sampler into the instrument. By using the chromatographic detection at the wavelength, 220 nm, the ratio of peak area of analyte to IS was plotted against the concentration to obtain the linear regression equation for each drug. Calibration equations were calculated as y=3.69x10⁻²C
PER- 1.70x10
-3 (r=0.9995) with limit of detection (LOD=5.82 mg/mL) and limit of quanti-tation (LOQ= 19.41 mg/mL) for PER and y=0.20 CIND-7.90x10⁻² (r=0.9990) with LOD (0.30 mg/mL) and LOQ (0.98 mg/mL). Here, C denotes the concentration of the analyzed drugs. Calibration equations were used for the quantitative analysis of PER and IND in samples.
Validation of the signal processing methods
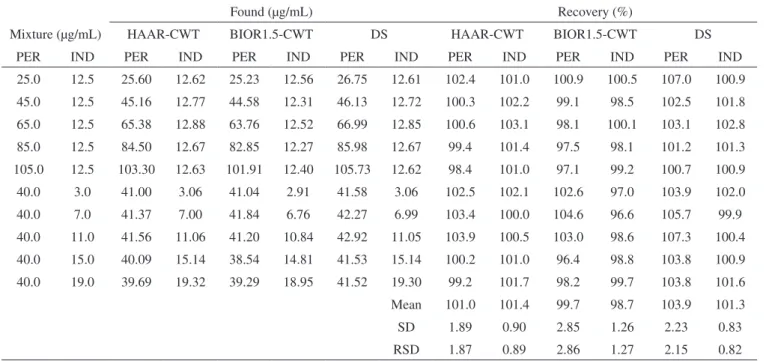
A good linearity was observed for the application of BIOR1.5-CWT, HAAR-CWT and DS methods in the concentration range 25.0-105.0 mg/mL of PER and 3.0-19.0 mg/mL of IND. In the linear regression analyses, the numerical values of the correlation coeffi-cients (r) were shown in Table 1. Good accuracy and precision for the results obtained by the signal processing methods were reported. For this purpose, the recovery studies were carried out by application of the developed BIOR1.5-CWT, HAAR-CWT and DS to the analysis of 10 mixture solutions prepared by dilution of the stock solutions. The percentage recoveries and their relative standard deviations were indicated in Table 2.
The limit of detection (LOD) and the limit of quantitation (LOQ) for each method were presented in Table 1. The calculation of these parameters was performed by using the standard deviation of the intercept and slope values of calibration equations.
Standard addition technique was used to observe the selectivity of the proposed signal processing methods. Appropriate volumes of the standard stock solutions of PER and IND compounds at three different concentration levels, 25.0, 40.0 and 70.0 mg/mL for PER and 4.0, 8.0 and 11.0 mg/mL for IND were added to the analyzed tablet solutions, respectively. This procedure was repeated six times for each concentration level. The recovery results, standard deviations, relative standard deviations and percent relative error were calculated and given in Table 3. No interference of the tablet excipients on the determinations was observed during the analysis. According to the recovery studies and standard addition technique, it was observed that the numerical results obtained by BIOR1.5-CWT and HAAR-CWT were in a good agreement with those obtained by DS method.
Figure 4. First derivative spectra of 25.0, 45.0, 65.0, 85.0, 105.0 µg/mL PER (—) and 3.0, 7.0, 11.0, 15.0, 19.0 µg/mL IND (----) (Δl=16 nm and SF=10)
Table 2. Recovery data obtained by applying the proposed signal processing methods to the PER-IND mixtures
Found (µg/mL) Recovery (%)
Mixture (µg/mL) HAAR-CWT BIOR1.5-CWT DS HAAR-CWT BIOR1.5-CWT DS
PER IND PER IND PER IND PER IND PER IND PER IND PER IND
25.0 12.5 25.60 12.62 25.23 12.56 26.75 12.61 102.4 101.0 100.9 100.5 107.0 100.9
45.0 12.5 45.16 12.77 44.58 12.31 46.13 12.72 100.3 102.2 99.1 98.5 102.5 101.8
65.0 12.5 65.38 12.88 63.76 12.52 66.99 12.85 100.6 103.1 98.1 100.1 103.1 102.8
85.0 12.5 84.50 12.67 82.85 12.27 85.98 12.67 99.4 101.4 97.5 98.1 101.2 101.3
105.0 12.5 103.30 12.63 101.91 12.40 105.73 12.62 98.4 101.0 97.1 99.2 100.7 100.9
40.0 3.0 41.00 3.06 41.04 2.91 41.58 3.06 102.5 102.1 102.6 97.0 103.9 102.0
40.0 7.0 41.37 7.00 41.84 6.76 42.27 6.99 103.4 100.0 104.6 96.6 105.7 99.9
40.0 11.0 41.56 11.06 41.20 10.84 42.92 11.05 103.9 100.5 103.0 98.6 107.3 100.4
40.0 15.0 40.09 15.14 38.54 14.81 41.53 15.14 100.2 101.0 96.4 98.8 103.8 100.9
40.0 19.0 39.69 19.32 39.29 18.95 41.52 19.30 99.2 101.7 98.2 99.7 103.8 101.6
Mean 101.0 101.4 99.7 98.7 103.9 101.3
SD 1.89 0.90 2.85 1.26 2.23 0.83
RSD 1.87 0.89 2.86 1.27 2.15 0.82
SD = Standard deviation, RSD = Relative standard deviation
Table 3. Recovery results for standard addition technique by the proposed signal processing methods Added
to tablet
Found RE (%) Recovery (%)
HAAR-CWT BIOR1.5-CWT DS HAAR-CWT BIOR1.5-CWT DS HAAR-CWT BIOR1.5-CWT DS PER IND PER IND PER IND PER IND PER IND PER IND PER IND PER IND PER IND PER IND 25.0 4.0 25.89 4.06 24.41 4.01 25.57 4.07 3.43 3.98 -2.44 0.10 2.12 1.71 103.6 101.4 97.6 100.1 102.3 101.8 40.0 8.0 41.54 8.13 38.70 7.85 41.84 8.52 3.70 4.13 -3.43 -1.90 4.40 6.03 103.8 101.7 96.7 98.2 104.6 106.5 70.0 11.0 72.98 11.45 68.18 10.95 73.17 11.62 4.04 3.63 -2.67 -0.47 4.25 5.29 104.3 104.1 97.4 99.5 104.5 105.7 Mean 103.9 102.4 97.3 99.3 103.8 104.6 SD 0.35 1.46 0.46 1.01 1.32 2.50 RSD 0.33 1.43 0.48 1.02 1.27 2.39 RE= Relative error corresponding to formula . Results were obtained from six times for each concentration level (n=6)
Results of tablet analysis
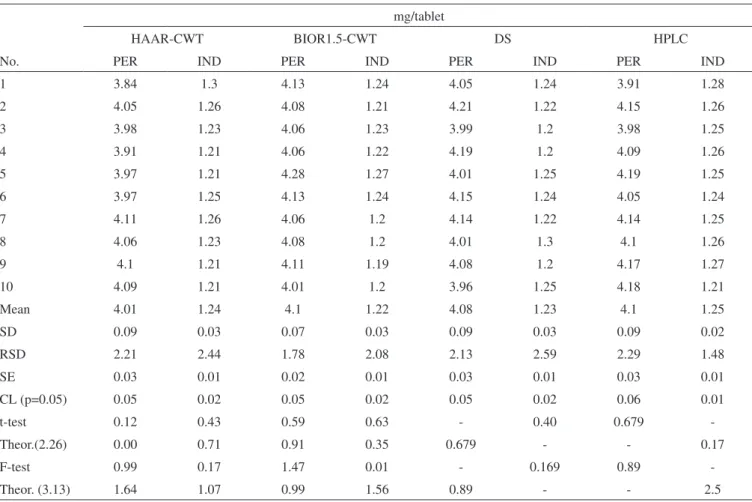
Experimental results obtained by the application of BIOR1.5-CWT, HAAR-BIOR1.5-CWT, first order DS and HPLC methods to the PER-IND tablet solutions are indicated in Table 4. Successful results were obtained for the quantitative analysis of commercial tablets containing PER and IND compounds. A good coincidence was reported between the tablet assay results obtained by the proposed signal processing methods. In the tablet assay analysis, the interfe-rence of the tablet excipients on the determination of the analyzed two drugs was not observed in application of proposed methods to real tablet samples.
For a statistical comparison of the tablet assay results obtained by BIOR1.5-CWT, HAAR-CWT with those obtained by DS and HPLC, t- and F-tests were applied to the experimental results. The results with % 95 of confidential limit indicate that there is no sig-nificant difference between the proposed methods in respect to the theoretical values. These statistical calculation results were given in Table 4.
CONCLUSIONS
In this study, two new signal processing methods, BIOR1.5-CWT and HAAR-CWT, were developed and applied to the simultaneous spectrophotometric determination of PER and IND compounds in their synthetic and commercial tablet samples. These signal pro-cessing methods do not require any separation step for the analysis of both PER and IND. The combined use of the CWT method and zero-crossing technique is a new and promising approach for the determination of the related compounds. To obtain the successful recovery results, wavelet optimal control was performed by using the analytical validation parameters.
Table 4. Determination results obtained by applying the proposed signal processing methods to the PER-IND tablets mg/tablet
HAAR-CWT BIOR1.5-CWT DS HPLC
No. PER IND PER IND PER IND PER IND
1 3.84 1.3 4.13 1.24 4.05 1.24 3.91 1.28
2 4.05 1.26 4.08 1.21 4.21 1.22 4.15 1.26
3 3.98 1.23 4.06 1.23 3.99 1.2 3.98 1.25
4 3.91 1.21 4.06 1.22 4.19 1.2 4.09 1.26
5 3.97 1.21 4.28 1.27 4.01 1.25 4.19 1.25
6 3.97 1.25 4.13 1.24 4.15 1.24 4.05 1.24
7 4.11 1.26 4.06 1.2 4.14 1.22 4.14 1.25
8 4.06 1.23 4.08 1.2 4.01 1.3 4.1 1.26
9 4.1 1.21 4.11 1.19 4.08 1.2 4.17 1.27
10 4.09 1.21 4.01 1.2 3.96 1.25 4.18 1.21
Mean 4.01 1.24 4.1 1.22 4.08 1.23 4.1 1.25
SD 0.09 0.03 0.07 0.03 0.09 0.03 0.09 0.02
RSD 2.21 2.44 1.78 2.08 2.13 2.59 2.29 1.48
SE 0.03 0.01 0.02 0.01 0.03 0.01 0.03 0.01
CL (p=0.05) 0.05 0.02 0.05 0.02 0.05 0.02 0.06 0.01
t-test 0.12 0.43 0.59 0.63 - 0.40 0.679
-Theor.(2.26) 0.00 0.71 0.91 0.35 0.679 - - 0.17
F-test 0.99 0.17 1.47 0.01 - 0.169 0.89
-Theor. (3.13) 1.64 1.07 0.99 1.56 0.89 - - 2.5
SE = standard error, CL = confidence limit at 95%. The commercial tablet content is: 4.0 mg PER and 1.25 mg IND per tablet
The proposed signal processing methods can be applied for the routine quality control of the commercial tablets containing PER and IND.
REFERENCES
1. Daubechies, I.; Ten Lectures on Wavelets, Society for Industrial and Applied Mathematics: Philadelphia, 1992.
2. Walczak, B.; Wavelets in Chemistry, Elsevier Press: Amsterdam, 2000. 3. Dinç, E.; Baleanu, D.; Mathematical Methods in Engineering, Springer:
The Netherlands, 2007, p. 265-284.
4. Dinç, E.; Baleanu, D., J.AOAC Int. 2004, 87, 360. 5. Dinç, E.; Baleanu, D.; J AOAC Int. 2004, 87, 834. 6. Dinç, E.; Ozdemir, A.; Baleanu, D.; Talanta 2005, 65, 36. 7. Dinç, E.; Baleanu, D.; Üstündağ, O.; Spectr. Lett. 2003, 36, 341. 8. Dinç, E.; Özdemir, A.; Baleanu, D.; J. Pharm. Biomed. Anal. 2005, 37,
569.
9. Dinç, E.; Baleanu, D.; Spectr. Acta PartA 2006, 63, 631. 10. Dinç, E.; Baleanu, D.; J. Food. Drug Anal. 2007, 15, 109.
11. Dinç, E.; Süha, K.; Doğanay, T.; Baleanu, D.; J. Pharm. Biomed. Anal.
2007, 44, 991.
12. Erk, N.; J. Pharm. Biomed. Anal.2001, 26, 43.
13. Rahman, N.; Anwar, N.; Kashif, M.; Chem. Pharm. Bull. 2006, 54, 33. 14. Hillaert, S.; Vander Heyden, Y.; Van den Bossche, W.; J. Chromatogr., A
2002, 978, 231.
15. Ding, L.; Yang, L. H.; Liu, F.; Ju, W. Z.; Xiong, N. N.; J. Pharm. Biomed. Anal. 2006, 42, 213.
16. Chen, W. D.; Liang, Y.; Zhang, H.; Li, H.; Xiong, Y.; Wang, G. J.; Xie, L.; J. Chromatogr., B 2006, 842, 58.
17. Hang, T. J.; Zhao, W.; Liu, H.; Song, M.; Xie, Y.; Zhang, Z. X.; Shen, H. P.; Zhang, Y. P.; J. Pharm. Biomed. Anal. 2006, 40, 202.
18. Youssef, N. F.; J. AOAC Int. 2003, 86, 935.