Predicting Plant Diversity Patterns in
Madagascar: Understanding the Effects of
Climate and Land Cover Change in a
Biodiversity Hotspot
Kerry A. Brown1*, Katherine E. Parks2, Colin A. Bethell3, Steig E. Johnson4, Mark Mulligan5
1School of Geography, Geology and the Environment, Centre for Earth and Environmental Science Research (CEESR), Kingston University, London, United Kingdom,2Centre for Environmental Sciences, Faculty of Engineering and the Environment, University of Southampton, Southampton, United Kingdom,
3High Performance Computer Cluster, Faculty of Science, Engineering and Computing, Kingston
University, London, United Kingdom,4Department of Anthropology and Archaeology, University of Calgary, Calgary, Alberta, Canada,5Kings College London, Department of Geography, London, United Kingdom
Abstract
Climate and land cover change are driving a major reorganization of terrestrial biotic commu-nities in tropical ecosystems. In an effort to understand how biodiversity patterns in the tropics will respond to individual and combined effects of these two drivers of environmental change, we use species distribution models (SDMs) calibrated for recent climate and land cover vari-ables and projected to future scenarios to predict changes in diversity patterns in Madagas-car. We collected occurrence records for 828 plant genera and 2186 plant species. We developed three scenarios, (i.e., climate only, land cover only and combined climate-land cover) based on recent and future climate and land cover variables. We used this modelling framework to investigate how the impacts of changes to climate and land cover influenced biodiversity across ecoregions and elevation bands. There were large-scale climate- and land cover-driven changes in plant biodiversity across Madagascar, including both losses and gains in diversity. The sharpest declines in biodiversity were projected for the eastern es-carpment and high elevation ecosystems. Sharp declines in diversity were driven by the com-bined climate-land cover scenarios; however, there were subtle, region-specific differences in model outputs for each scenario, where certain regions experienced relatively higher species loss under climate or land cover only models. We strongly caution that predicted future gains in plant diversity will depend on the development and maintenance of dispersal pathways that connect current and future suitable habitats. The forecast for Madagascar’s plant diversity in the face of future environmental change is worrying: regional diversity will continue to de-crease in response to the combined effects of climate and land cover change, with habitats such as ericoid thickets and eastern lowland and sub-humid forests particularly vulnerable into the future.
OPEN ACCESS
Citation:Brown KA, Parks KE, Bethell CA, Johnson SE, Mulligan M (2015) Predicting Plant Diversity Patterns in Madagascar: Understanding the Effects of Climate and Land Cover Change in a Biodiversity Hotspot. PLoS ONE 10(4): e0122721. doi:10.1371/ journal.pone.0122721
Academic Editor:Lalit Kumar, University of New England, AUSTRALIA
Received:September 19, 2014
Accepted:February 12, 2015
Published:April 9, 2015
Copyright:© 2015 Brown et al. This is an open access article distributed under the terms of the Creative Commons Attribution License, which permits unrestricted use, distribution, and reproduction in any medium, provided the original author and source are credited.
Data Availability Statement:All relevant data are within the paper and its Supporting Information files.
Funding:The authors have no support or funding to report.
Introduction
Tropical biodiversity is being modified as a consequence of global environmental change [1–5]. In particular, climate and land cover change are driving a major reorganization of terrestrial biot-ic communities, each playing critbiot-ical roles in determining future species compositions [6–8]. Whether the individual or combined pressures of these drivers will more negatively impact fu-ture biodiversity in the tropics is a complex issue. Climate change modulates species-specific re-sponses to abiotic variables which affect species’ranges, recruitment and survival [1]; meanwhile, land cover change affects local and regional species pools through disruption of species’dispersal ability [9,10], driving local extinctions but also promoting colonization (e.g., for‘matrix’tolerant species). This limits the migration of intact plant and animal assemblages and contributes to major shifts in biodiversity for certain ecological communities [2,11].
In environments affected by climate change, flora and fauna must adapt to new temperature and precipitation extremes, where individuals may be pushed to the limits of their environ-mental tolerances [12]. Their survival depends on the rate at which they can migrate to differ-ent elevations, latitudes or regions otherwise suitable in terms of environmdiffer-ental conditions [13]. Whilst some species may adapt in response to climate change, those with longer genera-tion times may not have sufficient time for natural selecgenera-tion to act [14]. As a result, climate change drives shifts in species’geographic distributions [15], such that species tend to track their climatic niche—for instance toward higher elevations and latitudes when adapting to ris-ing temperature [16,17] or downhill to optimise water balance [3]. Species confined to dry or drought-stressed regions may also benefit from increased water use efficiency, an advantage conferred on plants as a consequence of rising atmospheric CO2concentrations [18].
Deforestation causes changes in albedo, evapotranspiration rates and water balance [19], es-tablishing land-climate feedbacks that affect atmospheric circulation and rainfall [20]. Moreover, atmospheric changes associated with large-scale deforestation are not restricted to deforested habitats, but also influence climate over very large areas [21]. Whilst climate change acts at broad scales, land cover change may concentrate the effects of climate at the local scale [22]—a synergy that could result in a cycle whereby the intensified impacts of climate result in a higher rate of land cover change locally. Because of this, it is commonly assumed that the combined pressures from these drivers should lead to greater biodiversity loss than if their impacts were uncoupled [20]. However, the evidence to support these assertions remains sparse, as future predictions of how climate and land cover change affect species distributions and therefore biodiversity are dif-ficult to model (although see [7] and [8]).
developed species distribution models (SDMs) calibrated for recent climate and land cover var-iables and projected to mid-century climates and predicted vegetation changes, to examine shifts in patterns of plant biodiversity in Madagascar (Fig 1). We focused on diversity patterns mediated by three scenarios: exclusively climate or land cover change and one that combines both. Our ultimate goal was to construct species richness maps that reflected the potential im-pact of these factors on biodiversity patterns in this mega-diversity hotspot.
We had two primary objectives for this study. First, we evaluated how the exclusive and combined effects of climate and land cover change influenced patterns of plant biodiversity
Fig 1. Site map showing the (a) ecoregions on which the analyses focused (excluding Mangroves) and (b) relief map of Madagascar, constructed using hill shade.Geographical Coordinate System (GCS) using the WGS1984 datum. Color figures available asS1 Fig.
(species richness) across Madagascar. Considering that our analyses were focused on country-wide patterns, we expected the scenario that incorporates both drivers of environmental change to have the largest negative impact on richness. Second, using the modelling framework established above, we quantified the magnitude of change in richness at different elevation ranges, as well as within major ecoregions across Madagascar. We expected the greatest de-crease in richness to occur at the highest elevations under all scenarios, with the combined land–climate scenario exhibiting the largest decrease and the relative influence of the land cover only scenario showing the lowest decrease in diversity. We expected those ecoregions predicted to experience extreme shifts in climate (e.g., increasing temperatures in the south) or land cover (high rates of deforestation) to have noticeable changes in richness.
Methods
Study site
Madagascar forms part of one of 34 global biodiversity hotspots [30], as it possesses high levels of plant endemism [31], but also high rates of deforestation and degradation [32]. The high rate of endemism (plant and other taxa) in Madagascar can be explained not only by the island’s iso-lation from major landmasses, but also by its diverse and variable microclimates, as well as the contrast between the humid eastern escarpment and dry western biomes [33]. The climate asso-ciated with these regions (and throughout the island) is expected to change in coming years; projections of future temperature changes in Madagascar indicate increases of 1.1–2.6°C for the period 2046–2065, with the greatest level of warming occurring in the south and least in the north [34]. Precipitation will increase throughout the island in summer and becoming drier in winter along the southeast coast, but wetter in all other regions [34]. Just as climate is expected to vary, major changes in land cover have already been documented [35,36] and are expected to continue into the future [37]. For example, Harperet al. [34] report average deforestation rates in Madagascar from 1990–2000 at 0.9% yr—1, with humid and dry forests showing the greatest loss fromc. 1950—c. 2000 of 43% and 41%, respectively. If forest fragmentation is taken into ac-count, the consequences of land use change are even more dramatic. Relative to 1950s, inc. 2000>45% of all forest occurred in patches (with a quarter in isolated patches<10 km2), and >80% within 1 km of a non-forest edge [35]. The majority of the endemic flora is forest depen-dent and areas outside forests typically harbour little biodiversity, as there is a sharp ecotone be-tween forests and non-forests. Moreover, the biodiversity housed in the many habitats in Madagascar are vital for ecosystem services, directly influencing the livelihoods of millions of people in forest-dependent rural communities [38].
Presence locations, climate and simulated land cover change scenarios
which were collected from a 30 arc-second resolution grid (i.e., 1 km2resolution). Future sce-narios represent a doubling of CO2, downscaled using the CCM2 model [40]. Doubling of CO2 represent a possible radiative forcing of 2.8Wm-2, with a probable temperature change of 2.7°C [41]. The climate variables included in the SDM were mean annual temperature (°C), minimum temperature (°C), maximum temperature (°C), mean annual precipitation (mm), minimum precipitation (mm), maximum precipitation (mm), annual water balance (mm), number of months with positive water balance (value between 1–12) and evapotranspiration rate (mm).
We used published sources of deforestation rates to estimate future changes in percentage land cover. We assumed a constant rate of land cover change across Madagascar, as it was not possible to reliably distinguish between different forest types at the scale of our analysis. Addi-tionally, estimates of land cover change across Madagascar vary widely, making it challenging to arrive at reliable criteria by which to bound future rates of change [42]. In addition to Harper
et al. (2007) [34] projections reported above, Allnuttet al. (2013) [43] report 40.4% forest loss for all of Madagascar between 1950–2000; Elmqvistet al. (2007) [44] estimate 7% decrease in total forest cover for dry forests between 1984–2000; and Grinand et al. (2013) [45] suggests de-forestation rates of 0.93–2.33% yr-1for humid forests and 0.46–1.117% yr-1for the dry forest. Given this variation in estimates of land cover change, we opted for a low and conservative esti-mate of change based on ~30% of the reported deforestation rate from Harperet al. (2007) [34]. Therefore, we assumed that herb and forest cover would decrease at a rate of 0.28% yr-1, giving a decrease of 22% from the 2001 baseline to 2080.
This estimate of land cover change was used to simulate future deforestation / reforestation on a pixel-by-pixel basis within Madagascar through the year 2080 (i.e., each pixel was mod-elled as a separate entity, with no interaction with neighboring pixels). We simulated future land cover change using the land cover change scenario module of the Co$tingNature tool from PolicySupport.org [46]. This uses the MODIS VCF 2000 product to provide baseline frac-tional bare ground coverage [47] and then combines this with the newer 2010 fractional tree cover ([46],http://www.policysupport.org/simterra). The 2010 fractional herb cover is calculat-ed such that,
H¼100 ðT
2010þB2000Þ;
whereHrepresented the fractional herb cover,T2010fractional tree cover [48], andB2000
frac-tional bare ground cover [47]. In this approach, Co$tingNature assumes that bare ground (e.g., rocky outcrops) are unlikely to change over time and tree cover loss is thus converted to herba-ceous cover, which represents agriculture. The deforestation rate outlined above was applied on a pixel-by-pixel basis to the fractional tree cover, with the fractional cover of herbs increas-ing by an equivalent amount to the tree loss.
This represented a consistent level of forest degradation—from trees to herbs—across Mad-agascar, rather than pockets of intense deforestation. Whilst the latter may be a more realistic scenario, the simple deforestation model used here provides a suitable approach for exploring the combined effects of climate and land cover change on multiple species distributions at a rel-atively coarse scale (~1km), given the lack of more spatially explicit deforestation / degradation rates and scenarios available at the time. Therefore, Co$tingNature allowed us to develop envi-ronmental layers for recent and future tree and herbaceous coverage that were used in the Max-ent SDMs. A bare soil layer was also produced, however, we did not include it in the SDMs.
richness, each scenario was developed with recent and future conditions and an SDM was gen-erated under both conditions (e.g., recent climate only SDM for species X and future climate only SDM for species X).
Modelling algorithm
SDMs were developed for each of the scenarios with Maxent software (Maxent v3.3.3k; [49]). Maxent has been shown to perform well in comparison to other approaches [50,51] and is known to perform well with small numbers of presence locations [52,53]. It relies on presence-only records to estimate the probability of occurrence for a species, which can then be used to discriminate suitable versus unsuitable areas. We implemented Maxent using the command line function for batch processing. Species With Data (SWD) file format, which includes pres-ence records and environmental variables used for the input file.
Model evaluation
We used area under the receiver operating characteristic curve (AUC)—a threshold indepen-dent index—to model predictive performance. Five-fold cross-validation was used and model performance was assessed on the held-out (i.e., test) folds. Cross-validation is a widely used re-sampling technique and has performed well in similar modelling studies [53]. AUC measures the ability of a model to discriminate between sites where a species is present and those where it is absent, which indicates the efficacy of the model for prioritizing areas in terms of their rela-tive importance as habitat for a species. The AUC ranges from 0 to 1, where 1 indicates perfect discrimination and 0.5 suggests predictive discrimination is no better than random and values below 0.5 implies performance worse than random. We also used two threshold dependent in-dices—COR and Cohen’s Kappa (Kappa)—to assess model performance. COR is the point biserial correlation coefficient [50] and measures the ability of model predictions to discrimi-nate between observed presence and absence [54]. Kappa measures whether the agreement be-tween observed and predicted outcome is higher than that expected by chance.
Decision thresholds
Constructing genus and species richness maps requires binary predictions (presence / absence) that establish a threshold value above which model output is considered to be a prediction of presence and below which a prediction of absence. The continuous distribution output in Max-ent was converted to binary predictions using one of three threshold methods. The first criteri-on determined the threshold where positive observaticriteri-ons were just as likely to be wrcriteri-ong as negative observations (i.e., point where“sensitivity”=“specificity”). Next, we used the criterion that minimized the mean of the error rate for correct observations and the error rate for incor-rect observations (i.e., Youden’s Index). Lastly, we determined the threshold where the pre-dicted prevalence was equal to the observed prevalence, where prevalence is the proportion of species occurrences among all sites (i.e., the sample frequency) [55]. Threshold values for the distribution maps were determined using all three techniques, thus producing binary maps that showed the probable distribution for each species and genus under each of the three threshold methods. These binary maps were then summed for each of the threshold techniques under each of the scenarios, resulting in 36 richness maps: three scenarios and three thresholds under recent and future conditions for genus and species (Table 1andS1 Table).
mean change in overall richness closest to 0 were selected for further analysis (seeS1 Tablefor full suite of thresholds).
Changes in richness at regional-scale: elevation bands and ecoregions
In order to determine how the impacts of climate and land cover change vary across ecoregions and by elevation, a frequency distribution of changes in species and genera richness at the pixel level was constructed. We focused on seven ecoregions (Fig 1): (i)dry deciduous forests—dry tropical forests and woodlands occurring below 800 m in western region with a pronounced dry season; (ii)lowland forests—humid and moist tropical forest extending from low- to-mid-elevations in the eastern region; (iii)sub-humid forests—consists of a diversity of habitats and corresponds broadly to mid-elevation forests in central and southern regions, as well as north-ern highlands and upland habitats; (iv)succulent woodlands—occurs in the southwestern re-gion and is comprised of deciduous woodland and spiny and succulent thicket; (v)spiny thickets—occurs in south and southwest consisting of low succulent and spiny thicket dominat-ed by Euphorbiaceae and locally endemic Didiereaceae; (vi)ericoid thickets—occurs on the upper slopes of the four major mountain massifs and consists of a large number of endemics in Ericaceae, Asteraceae and Podocarpaceae; and (vii)mangroves—occurs mostly along most of the western coast [56]. Mangroves are presented in the site map and species/genera maps for completeness. They are not discussed in the results, because they are not speciose communities (i.e., ca. 10 species) and face very different pressures and impacts than other ecoregions.
Two methods were used to define elevation bands: one created bands of equal elevation inter-vals (but with varying areal extent) and the second created bands of equal area (but with varying elevation intervals). Seven equal elevation interval bands were created at 390 m intervals (hereaf-ter equal in(hereaf-terval bands). The highest band using this method contained just 0.02% of Madagas-car’s areal extent, whilst the lowest band contained 48%. In order to account for this variation in areal extent between bands, genus and species richness calculated within equal interval bands were normalized by the area of that band. The second method involved creating seven bands of equal area, with each covering approximately 105 000 km2(hereafter equal area bands). The highest elevation band using this method account for 61% of Madagascar’s total elevation range (1067–2744 m), whereas the lowest elevation band accounted for 0.02% (0–62 m). The value of the DEM pixel with the greatest elevation was 2744 m; whilst Maromokotra in Tsaratanana is 2876 m, the pixels of the DEM are ~1km and individual peaks are not accounted for.
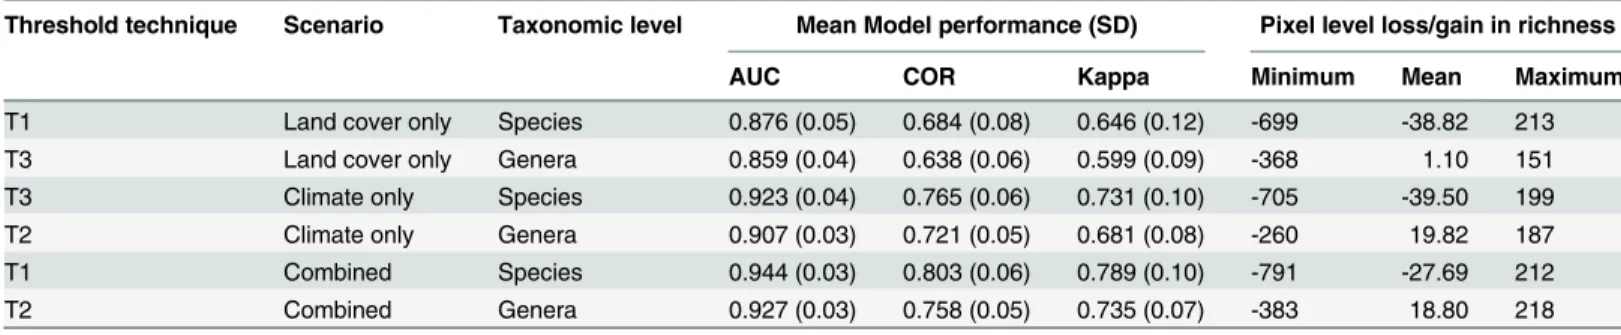
Table 1. Model runs used to assess the potential impact of climate and land cover change on species and genera richness in Madagascar.
Threshold technique Scenario Taxonomic level Mean Model performance (SD) Pixel level loss/gain in richness
AUC COR Kappa Minimum Mean Maximum
T1 Land cover only Species 0.876 (0.05) 0.684 (0.08) 0.646 (0.12) -699 -38.82 213
T3 Land cover only Genera 0.859 (0.04) 0.638 (0.06) 0.599 (0.09) -368 1.10 151
T3 Climate only Species 0.923 (0.04) 0.765 (0.06) 0.731 (0.10) -705 -39.50 199
T2 Climate only Genera 0.907 (0.03) 0.721 (0.05) 0.681 (0.08) -260 19.82 187
T1 Combined Species 0.944 (0.03) 0.803 (0.06) 0.789 (0.10) -791 -27.69 212
T2 Combined Genera 0.927 (0.03) 0.758 (0.05) 0.735 (0.07) -383 18.80 218
Only those thresholds selected for further analyses are shown (SeeS1 Tablefor complete table and discussion of model sensitivity to threshold selection). T1 runs were thresholded using the“sensitivity = specificity”rule; T2 runs were thresholded using Youden’s index; and T3 runs were
thresholded using the“predicted prevalence = observed prevalence”rule. The mean values (and their associated standard deviations) for AUC, COR and Kappa are shown. Values for the model performance metrics are based on the average of 828 genera and 2186 species. The mean, minimum and maximum pixel level loss/gain in richness is also given.
Using the zonal statistics tool in ArcMap v 10.1 [57], the change in mean richness (and asso-ciated standard deviation) within each of the zones under each of the scenarios was calculated. The results are presented as absolute changes in richness (i.e., gain / loss in species and genera within the zone of interest), thus allowing interpretation of the number of genera and species likely to be lost overall. Where necessary, gains / losses in species and genera richness were nor-malized by the pixel count of the zone of interest, allowing comparison between zones of differ-ent sizes. This is particularly important when considering changes along an elevation gradidiffer-ent with equal vertical intervals, as the zones at the highest elevations are likely to be significantly smaller. We refrain from making species-specific predictions, as our analyses are too coarse-grained to detect distinct changes in geographic ranges.
The data were analysed using Kingston University High Performance Computing facility, which offered sixteen dedicated servers, multiple, simultaneously running simulations and scripted automatic execution. This facilitated processing and storage of 828 genera and 2186 species for six scenarios and 18 different thresholds. We used Maxent’s batch file feature, with-out the interactive GUI overhead, to develop species distribution maps; with-outputs for which were exported to R-statistical software [58] for determining threshold values and model perfor-mance using PresenceAbsence package [59]. The interface between Maxent, R and the parallel processing servers was managed with a separate Unix script. The species richness maps (devel-oped from the threshold output files) were assembled in ArcGIS using PCRaster python (http://pcraster.geo.uu.nl) with all subsequent analysis implemented in ArcGIS v 10.1 [57].
Results
Four primary patterns in Madagascan plant diversity were evident: (i) there was a large-scale heterogeneous pattern of diversity change, where some regions showed sharp declines and oth-ers increases; (ii) there were region-specific differences in the impact of each driver on biodi-versity, where certain regions were influenced more by either climate or land cover, rather than the combined effects of both; (iii) the sharpest declines in biodiversity were projected for the eastern escarpment and ericoid thickets; and (iv) diversity at the highest elevations were pro-jected to experience sharp declines. Model performance, as measured by mean AUC, gave ex-cellent to outstanding discrimination [60] while mean Kappa exhibited good to excellent results, ranging from 0.599–0.789 [61] and mean COR ranged from 0.638–0.803 (Table 1).
Changes in biodiversity: Regional-scale
Model projections suggested that there would be large-scale climate- and land-cover-driven shifts in plant distributions across Madagascar, where species/genera gains were predicted for certain regions and losses for others. The three scenarios show similar overall frequency distri-butions of taxonomic loss. The skew in distribution indicates that most locations will gain some species/genera; however, the long left-hand tail—indicating loss of species—suggests that other locations will lose large numbers of species/genera, as well (Fig 2). Moreover, the com-bined climate-land cover scenario did not always have the strongest negative effects on rich-ness, suggesting that the influence of each driver was not concentrated when acting together (Fig 2). That is to say, the left-skewness of the histograms for the combined scenario was not predicted to double, nor increase at a rate that suggested an additive or synergistic effect of cli-mate and land cover (Fig 2; Fig3aand3b).
Fig 2. Histogram showing pixel-level gains and losses for species (a, c and e) and genera (b, d and f) for the three scenarios, climate only, land cover only and combined.
decrease of 40, 39 and 28 for climate only, land cover only and combined respectively). Genera richness was predicted to increase under both measures of central tendency for all three scenari-os (Fig 3b). Plant species richness declined sharply in a few spatially concentrated areas, with the land cover and combined scenarios driving relatively larger losses than climate only (Fig3a and3b).
The sharpest declines in floristic richness occurred along the eastern escarpment and al-though consistent across the three scenarios, were driven mostly by changes in climate. Land Fig 3. Change in richness from recent (2000) conditions for climate only, land cover only and combined scenarios for (a) species and (b) genera.
Darker areas indicate species and genera richness losses and lighter areas indicate gains. Geographical Coordinate System (GCS) using the WGS1984 datum. Color figures available asS2 FigandS3 Fig.
cover seemed to drive much of the loss in the western regions (Fig 3a). Moderate increases in species richness were predicted in the northwest under both the climate only and combined scenarios, whilst this pattern was less apparent in the land cover only scenario (Fig 3a). Changes in genus richness follow the same spatial patterns as those for species richness, al-though the gains in the northwest under the climate only scenario were more pronounced and this is also reflected in the combined scenario (Fig 3b). All three scenarios suggest that areas in the northwest and less so in the south-southwest will experience an increase in generic rich-ness, with country-wide median increases of 44, 39 and 39 genera for the climate, land-cover and combined scenarios respectively (Fig 3b).
Changes in biodiversity: elevation ranges and ecoregions
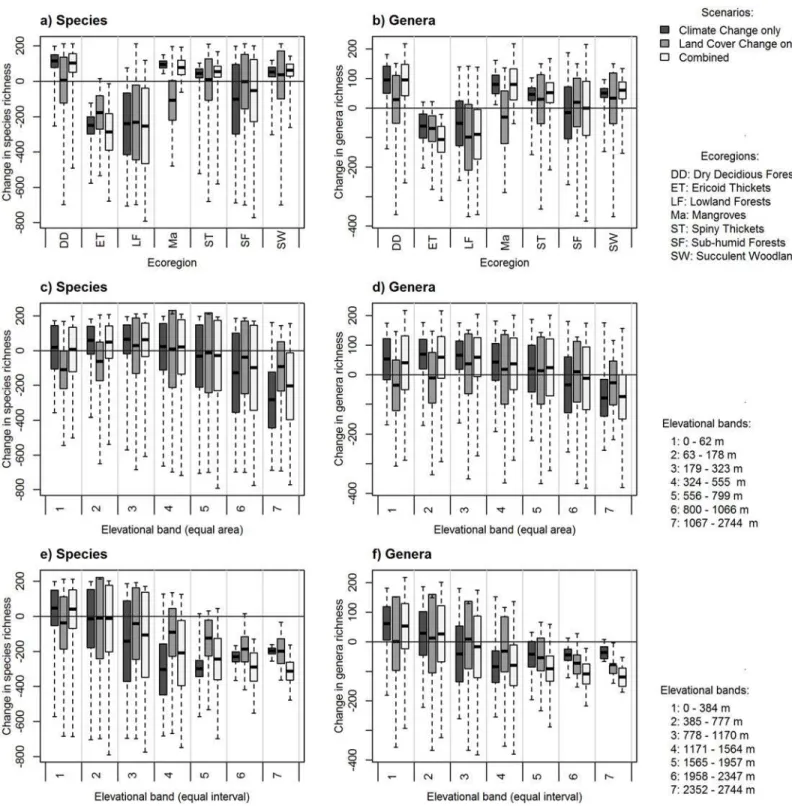
We present both proportional (normalized by area) and absolute losses in genus/species rich-ness within elevation zones and ecoregions. Focusing first on proportional losses—there was a slight decrease in richness using equal area elevation bands for both genera and species under all scenarios at the highest elevations (Fig 4). This decrease was highlighted for the equal inter-val elevation bands, where the largest losses of diversity were also projected for the highest ele-vations (Fig 4). That is to say, if we controlled for area, losses in species richness was greatest at the highest elevations under the combined scenario, with the land cover only projections show-ing the least amount of genus/species loss (Fig 4). However, this signal was less apparent when using the absolute values (Fig 5).
In terms of proportional losses in ecoregions, ericoid thickets and lowland forests were pre-dicted to suffer the greatest losses of both species (losing on average approximately 200 species under each scenario) and genera (losing a mean of approximately 100 genera under each sce-nario;Fig 4), driven by the combined effects of climate and land cover. This pattern remained under projections based on absolute losses—ericoid thickets were still predicted to lose both species and genera (approximately 0.05 genera km-2and 1.5 species km-2;Fig 5).
Discussion
Predicted changes in biodiversity at regional-scale
Fig 4. Loss and gain in plant species and genera richness (measured on a pixel-by-pixel basis and normalized by area, km2) across different zonal systems for (a, b) ecoregions found in Madagascar, (c, d) equal area elevation bands (each with an area of approximately 105 000 km2), and (e, f) equal interval elevation bands (at intervals of 390 m).Changes under each scenario are shown as: climate only scenario (dark grey), land cover only scenario (mid-grey) and the combined scenario (light grey). The mean is indicated with a solid horizontal line, the shaded areas represent±1 standard
deviation, whilst dashed lines extend to the minimum and maximum values.
Fig 5. Changes in species and genera richness across different zonal systems, showing the absolute changes in richness for (a, b) ecoregions found in Madagascar, (c, d) equal area elevation bands (each with an area of approximately 105 000 km2, (e, f) equal interval elevation bands (at intervals of 390 m).The changes under each scenario are shown, with the climate change only scenario represented with the darkest grey, the land-cover change only scenario represented with the mid-grey and the combined scenario represented in the light grey. The mean is indicated with a solid horizontal line, the shaded areas represent±1 standard deviation, whilst dashed lines extend to the minimum and maximum values.
Changes in biodiversity: elevation ranges and ecoregions
Although we expected the combined climate-land cover scenario to drive large declines in bio-diversity, this was not always the case. This general finding runs contrary to our expectation, as well as results from other modeling studies that suggest the effects of climate and land cover might be concentrated when acting together [61]. With that said, however, the ericoid thickets once again stand out as particularly vulnerable. Our models predicted substantial declines in future vegetation richness in this ecoregion under all change scenarios, but particularly for the combined climate-land scenario. This might be due to the specialized nature of environments with high levels of endemism, since dispersal to suitable, future habitats will be less likely. Of equal importance, as Feeley and Rehm (2012) [61] suggest, this may be because species migra-tion to more suitable environments in response to climate change may be hindered by defores-tation, since the latter may increase dispersal distances needed to establish viable populations in future environments.
Several regions experienced relatively lower species loss under the combined scenario com-pared to climate or land cover alone. Lowland and sub-humid forests suffered the largest de-clines under the climate scenario, where the possible effects of climate change exceeded the effects of land cover. These results support findings of Feeleyet al. (2012) [7], who suggests that climate variables—particularly increasing temperature—are the dominant drivers affecting future plant diversity in the Amazon. In Madagascar, this may lead to sharp declines in lowland tropical diversity over the next century unless organisms are able to tolerate or adapt to thermal extremes, in particular the predicted increase of 1.1–2.6°C over the next century [34]. The pic-ture is different in the western part of the country (i.e., dry deciduous forest and succulent woodlands), where (relatively limited) species loss is driven mostly by land cover change rather than climate. These results suggest region-specific differences in the impact of each driver on biodiversity in Madagascar, which may be modulated more by either climate or land cover, rather than the combined effects of both. Similar patterns have been documented by other studies, with land cover dominating over climate change in western Amazonia [7], as well as having a bigger impact on biodiversity in Asia-Oceania than in Latin America and Africa [8].
When we controlled for area, there were no noticeable change in diversity at the lower eleva-tion bands (i.e., 0 m—1957m), but there was increasing loss of diversity between 1958 m—
2347 m and considerable loss between 2352 m—2744 m. We envisage two explanations for this observation. First, species range contractions and extinctions are more likely to occur at higher elevations, since there is a physical constraint on elevation at mountaintops and plants can no longer track shifting climatic conditions [27]. In the tropics, species are more likely to respond to climate–driven temperature change by shifting their range by elevation through upslope mi-gration, rather than latitude [29]. This is particularly true for high elevation endemics, such as plants found in ericoid thickets that occupy a narrow climate space [16,64]. Alternatively, a de-crease in richness at high elevation may be linked to the inability of plants to migrate to suitable climatic conditions since current and future suitable habitats do not overlap (i.e., range-shift gapssensuColwell et al. (2008) [27], which is an acute problem for low–and–high–elevation plant species [17]. Our study does not address these questions, but they are areas of continuing inquiry. What seems most clear from our study is that high elevation plants will contract their geographic range in response to the combined effects of climate and land cover change. The likely consequence of either alternative explanation may be that Madagascar’s high elevation species, particularly endemics, will become increasingly threatened into the future [65].
that is projected for that region [34], if, again, it is assumed that temperature will be the dominant driver affecting biodiversity in the tropics [66]. That assumption should be made with a degree of caution, since temperature and precipitation interact strongly and results based solely on tem-perature can be confounded by precipitation and seasonality [64,67]. This result is also strongly dependent on intact habitats providing dispersal corridors for new colonizations, an unlikely prospect given the high rate of deforestation associated with dry forests in Madagascar [45].
Evaluation of results
It is necessary to highlight a few important caveats regarding our model-based findings. First, increased diversity due to climate change does not indicate‘re-vegetation’, instead it implies col-onization possibilities—regions that once exhibited unsuitable climate for certain plants may in the future be within the limits of their environmental tolerances. That is to say, plant diversity may theoretically increase in local areas (e.g., NW) due to climate change (and in spite of defor-estation) because these areas become climatically hospitable for a larger number of species that are currently found only in other regions. However, our models do not consider any type of dis-persal mechanism. Therefore, gains in diversity would only occur if colonization pathways were present, which is unrealistic given on-going deforestation surrounding natural forests in Mada-gascar [43,63]. Second, our analyses examined regional–scale changes in diversity without ex-plicitly investigating species–specific range shifts. Therefore, losses in biodiversity are most likely driven by shifts in species’distribution, leading to local extinction, rather than global ex-tinction. Next, we do not explore the importance of feedback loops between climate and land cover change on future plant distributions. It has become increasingly apparent that the direct impacts of climate change on species’distributions may be less important than the increase in habitat loss as a result of human adaptation to climate change [68]. Madagascar is a strong ex-ample of this—forests are threatened primarily by slash and burn agriculture (known astavyin Madagascar), which is expected to increase in response to increasingly unpredictable rainfall [34], in turn reducing the productivity of existing agricultural systems and forcing local commu-nities to cultivate a greater land area by cutting down more forests. Feedback loops are expected to change patterns of deforestation as rural subsistence communities adapt to changing climatic conditions. Consequently, potential dispersal corridors may be closely linked to the intensity of prospective feedback loops. Finally, the study examined large–scale patterns of plant diversity, without focusing on a certain class of vegetation (e.g., endemic or utilitarian species). Using rich-ness as the key diversity metric might suggest that all species/genera are equal in ecological im-portance or conservation value, and we recognize that is not the case. However, contrasting regional–scale diversity patterns can be instructive and valuable for understanding how major drivers of biodiversity change may vary across ecoregions [69,70].
importance of Madagascar as a conservation priority and its status as a tropical, developing country undergoing similar pressures to other high biodiversity nations, there is a continuing need to understand how climate and land cover change will affect plant diversity in
that country.
Supporting Information
S1 Fig. Color site map.Site map showing the (a) seven ecoregions on which the analyses fo-cused and (b) relief map of Madagascar, constructed using hill shade. Geographical Coordinate System (GCS) using the WGS1984 datum.
(TIF)
S2 Fig. Color species change map.Color version depicting change in species richness from re-cent (2000) conditions for climate only, land cover only and combined scenarios for (a) species. Geographical Coordinate System (GCS) using the WGS1984 datum.
(TIF)
S3 Fig. Color genera change map.Color version depicting change in genera richness from re-cent (2000) conditions for climate only, land cover only and combined scenarios. Geographical Coordinate System (GCS) using the WGS1984 datum.
(TIF)
S1 Table. Complete Model runs used to assess the potential impact of climate and land use change on species and genera richness in Madagascar.Those runs selected for further analy-ses are indicated with. T1 runs were thresholded using the“sensitivity = specificity”rule, T2 runs were thresholded using Youden’s index and T3 runs were thresholded using the“ pre-dicted prevalence = observed prevalence”rule.
(DOCX)
Acknowledgments
We thank Madagascar National Parks (MNP),Madagascar Institute pour la Conservation des Ecosystèmes Tropicaux(MICET), Institute for the Conservation of Tropical Environments (ICTE), and Madagascar Biodiversity Partnership (MBP) for valuable support. We thank six anonymous reviewers for comments on the manuscript.
Author Contributions
Conceived and designed the experiments: KAB KEP. Analyzed the data: KAB KEP CAB. Con-tributed reagents/materials/analysis tools: KAB KEP MM SEJ CAB. Wrote the paper: KAB KEP SEJ CAB MM.
References
1. Anderson-Teixeira KJ, Miller AD, Mohan JE, Hudiburg TW, Duval BD, et al. Altered dynamics of forest recovery under a changing climate. Global Change Biology 2013; 19: 2001–2021. doi:10.1111/gcb. 12194PMID:23529980
2. Chen IC, Hill JK, Ohlemuller R, Roy DB, Thomas CD. Rapid Range Shifts of Species Associated with High Levels of Climate Warming. Science 2011; 333: 1024–1026. doi:10.1126/science.1206432 PMID:21852500
4. Bertrand R, Lenoir J, Piedallu C, Riofrio-Dillon G, de Ruffray P, et al. Changes in plant community com-position lag behind climate warming in lowland forests. Nature 2011; 479: 517–520. doi:10.1038/ nature10548PMID:22012261
5. Parmesan C, Yohe G. A globally coherent fingerprint of climate change impacts across natural sys-tems. Nature 2003; 421: 37–42. PMID:12511946
6. Coe MT, Marthews TR, Costa MH, Galbraith DR, Greenglass NL, et al. Deforestation and climate feed-backs threaten the ecological integrity of south-southeastern Amazonia. Philosophical Transactions of the Royal Society B-Biological Sciences 2013; 368.
7. Feeley KJ, Malhi Y, Zelazowski P, Silman MR. The relative importance of deforestation, precipitation change, and temperature sensitivity in determining the future distributions and diversity of Amazonian plant species. Global Change Biology 2012; 18: 2636–2647.
8. Asner GP, Loarie SR, Heyder U. Combined effects of climate and land-use change on the future of humid tropical forests. Conservation Letters 2010; 3: 395–403.
9. Sagar R, Raghubanshi AS, Singh JS. Tree species composition, dispersion and diversity along a dis-turbance gradient in a dry tropical forest region of India. Forest Ecology and Management 2003; 186: 61–71.
10. Mace GM, Purvis A. Evolutionary biology and practical conservation: bridging a widening gap. Molecu-lar Ecology 2008; 17: 9–19. PMID:17696991
11. Williams JW, Jackson ST. Novel climates, no-analog communities, and ecological surprises. Frontiers in Ecology and the Environment 2007; 5: 475–482.
12. Rodriguez-Castaneda G. The world and its shades of green: a meta-analysis on trophic cascades across temperature and precipitation gradients. Global Ecology and Biogeography 2013; 22: 118–130.
13. Araujo MB, Pearson RG. Equilibrium of species' distributions with climate. Ecography 2005; 28: 693–695.
14. Skelly DK, Joseph LN, Possingham HP, Freidenburg LK, Farrugia TJ, et al. Evolutionary responses to climate change. Conservation Biology 2007; 21: 1353–1355. PMID:17883501
15. Hong-Wa C, Arroyo TPF. Climate-induced range contraction in the Malagasy endemic plant genera Mediusella and Xerochlamys (Sarcolaenaceae). Plant Ecology and Evolution 2012; 145: 302–312.
16. Raxworthy CJ, Pearson RG, Rabibisoa N, Rakotondrazafy AM, Ramanamanjato JB, et al. Extinction vulnerability of tropical montane endemism from warming and upslope displacement: a preliminary ap-praisal for the highest massif in Madagascar. Global Change Biology 2008; 14: 1703–1720.
17. Kreyling J, Wana D, Beierkuhnlein C. Potential consequences of climate warming for tropical plant spe-cies in high mountains of southern Ethiopia. Diversity and Distributions 2010; 16: 593–605.
18. Keenan TF, Hollinger DY, Bohrer G, Dragoni D, Munger JW, et al. Increase in forest water-use efficien-cy as atmospheric carbon dioxide concentrations rise. Nature 2013; 499: 324–327. doi:10.1038/ nature12291PMID:23842499
19. Lathuilliere MJ, Johnson MS, Donner SD. Water use by terrestrial ecosystems: temporal variability in rainforest and agricultural contributions to evapotranspiration in Mato Grosso, Brazil. Environmental Research Letters 2012; 7. PMID:23284587
20. Nobre P, Malagutti M, Urbano DF, de Almeida RAF, Giarolla E. Amazon Deforestation and Climate Change in a Coupled Model Simulation. Journal of Climate 2009; 22: 5686–5697.
21. Coe MT, Costa MH, Soares-Filhoc BS. The influence of historical and potential future deforestation on the stream flow of the Amazon River—Land surface processes and atmospheric feedbacks. Journal of Hydrology 2009; 369: 165–174.
22. Pressey RL, Cabeza M, Watts ME, Cowling RM, Wilson KA. Conservation planning in a changing world. Trends in Ecology & Evolution 2007; 22: 583–592.
23. Laurance WF, Useche DC, Shoo LP, Herzog SK, Kessler M, et al. Global warming, elevational ranges and the vulnerability of tropical biota. Biological Conservation 2011; 144: 548–557.
24. Dillon ME, Wang G, Huey RB. Global metabolic impacts of recent climate warming. Nature 2010; 467: 704–U788. doi:10.1038/nature09407PMID:20930843
25. Urban MC, Tewksbury JJ, Sheldon KS. On a collision course: competition and dispersal differences create no-analogue communities and cause extinctions during climate change. Proceedings of the Royal Society B-Biological Sciences 2012; 279: 2072–2080. doi:10.1098/rspb.2011.2367PMID: 22217718
27. Colwell RK, Brehm G, Cardelus CL, Gilman AC, Longino JT. Global warming, elevational range shifts, and lowland biotic attrition in the wet tropics. Science 2008; 322: 258–261. doi:10.1126/science. 1162547PMID:18845754
28. Wiens JJ, Donoghue MJ. Historical biogeography, ecology and species richness. Trends in Ecology & Evolution 2004; 19: 639–644.
29. Bush MB. Distributional change and conservation on the Andean flank: a palaeoecological perspective. Global Ecology and Biogeography 2002; 11: 463–473.
30. Mittermeier RA, Gil PR, Hoffman M, Pilgrim J, Brooks T, et al. Hotspots Revisited: Earth's Biologically Richest and Most Endangered Terrestrial Ecoregions. Washington, D.C., USA: The University of Chi-cago Press. 2005
31. Goodman SM, Benstead JP. Updated estimates of biotic diversity and endemism for Madagascar. Oryx 2005; 39: 73–77.
32. Myers N, Mittermeier RA, Mittermeier CG, da Fonseca GAB, Kent J. Biodiversity hotspots for conserva-tion priorities. Nature 2000; 403: 853–858. PMID:10706275
33. Dewar RE, Richard AF. Evolution in the hypervariable environment of Madagascar. Proceedings of the National Academy of Sciences of the United States of America 2007; 104: 13723–13727. PMID: 17698810
34. Tadross M, Randriamarolaza L, Rabefitia Z, Ki Yip Z (2008) Climate change in Madagascar: recent past and future. Washington, D.C.: World Bank.
35. Harper GJ, Steininger MK, Tucker CJ, Juhn D, Hawkins F. Fifty years of deforestation and forest frag-mentation in Madagascar. Environmental Conservation 2007; 34: 325–333.
36. Green GM, Sussman RW. Deforestation History of the Eastern Rain Forests of Madagascar from Satel-lite Images. Science 1990; 248: 212–215. PMID:17740137
37. Irwin MT, Wright PC, Birkinshaw C, Fisher BL, Gardner CJ, et al. Patterns of species change in anthro-pogenically disturbed forests of Madagascar. Biological Conservation 2010; 143: 2351–2362.
38. Brown KA, Johnson SE, Parks KE, Holmes SM, Ivoandry T, et al. Use of provisioning ecosystem ser-vices drives loss of functional traits across land use intensification gradients in tropical forests in Mada-gascar. Biological Conservation 2013; 161: 118–127.
39. Hijmans RJ, Cameron SE, Parra JL, Jones PG, Jarvis A. Very high resolution interpolated climate sur-faces for global land areas. International Journal of Climatology 2005; 25: 1965–1978.
40. Briegleb BP. Delta-Eddington Approximation for Solar-Radiation in the Ncar Community Climate Model. Journal of Geophysical Research-Atmospheres 1992; 97: 7603–7612.
41. Annan JD, Hargreaves JC. Using multiple observationally-based constraints to estimate climate sensi-tivity. Geophysical Research Letters 2006; 33. PMID:19122778
42. McConnell W, Kull CA Deforestation in Madagascar: Debates over the island's forest cover and chanl-lenges of measuring forest change. In: Scales IR, editor. Conservation and Environmental Manage-ment in Madagascar. London: Rutledge. 2014 pp. 67–104.
43. Allnutt TF, Asner GP, Golden CD, Powell GVN. Mapping recent deforestation and forest disturbance in northeastern Madagascar. Tropical Conservation Science 2013; 6: 1–15.
44. Elmqvist T, Pyykonen M, Tengo M, Rakotondrasoa F, Rabakonandrianina E, et al. Patterns of Loss and Regeneration of Tropical Dry Forest in Madagascar: The Social Institutional Context. Plos One 2007; 2.
45. Grinand C, Rakotomalala F, Gond V, Vaudry R, Bernoux M, et al. Estimating deforestation in tropical humid and dry forests in Madagascar from 2000–2010 using multi-date Landsat satellite images and the random forests classifier. Remote Sensing of Environment 2013; 139: 68–80.
46. Mulligan M, Rubiano J, Hyman G, White D, Garcia J, et al. The Andes basins: biophysical and develop-mental diversity in a climate of change. Water International 2010; 35: 472–492.
47. Hansen M, DeFries R, Townshend JR, Carroll M, Dimiceli C, et al. Vegetation Continuous Fields MOD44B, 2001 Percent Tree Cover, Collection 4. College Park, Maryland: University of Maryland. 2006
48. Mulligan M. SimTerra: A consistent global gridded database of environmental properties for spatial modelling. (2010)
49. Phillips SJ, Anderson RP, Schapire RE. Maximum entropy modeling of species geographic distribu-tions. Ecological Modelling 2006; 190: 231–259.
50. Elith J, Graham CH, Anderson RP, Dudik M, Ferrier S, et al. Novel methods improve prediction of spe-cies' distributions from occurrence data. Ecography 2006; 29: 129–151. PMID:16622301
52. Pearson RG, Raxworthy CJ, Nakamura M, Peterson AT. Predicting species distributions from small numbers of occurrence records: a test case using cryptic geckos in Madagascar. Journal of Biogeogra-phy 2007; 34: 102–117.
53. Elith J, Phillips SJ, Hastie T, Dudik M, Chee YE, et al. A statistical explanation of MaxEnt for ecologists. Diversity and Distributions 2011; 17: 43–57.
54. Elith J, Graham CH. Do they? How do they? WHY do they differ? On finding reasons for differing perfor-mances of species distribution models. Ecography 2009; 32: 66–77.
55. Liu FD, Yang WJ, Zhang M, Liu YH, Zheng JW, et al. Does strategy of resource acquisition in tropical woody species vary with life form, leaf texture, and canopy gradient? European Journal of Forest Re-search 2010; 129: 1093–1108.
56. Moat J, Smith P. Atlas of the vegetation of Madagascar. London, UK: Royal Botanic Gardens, Kew. 2007
57. ESRI. ArcGIS Desktop: Release 10.1. Redlands, CA: Environmental Systems Research Institute. (2012)
58. R_Development_Core_Team. R: A language and environment for statistical computing. R Foundation for Statistical Computing. Vienna, Austria. (2012)
59. Freeman E. PresenceAbsence. 1.1.5 ed: R statistical software. (2012)
60. Hosmer DW, Lemeshow S. Applied Logistic Regression. New York, USA: John Wiley & Sons. 2000
61. Landis JR, Koch GG. An application of hierarchical Kappa type statistics in the assessment of majority agreement among multiple observers Biometrics 1977; 33: 363–374. PMID:884196
62. Hannah L, Dave R, Lowry PP, Andelman S, Andrianarisata M, et al. Climate change adaptation for con-servation in Madagascar. Biology Letters 2008; 4: 590–594. doi:10.1098/rsbl.2008.0270PMID: 18664414
63. Vieilledent G, Grinand C, Vaudry R. Forecasting deforestation and carbon emissions in tropical devel-oping countries facing demographic expansion: a case study in Madagascar. Ecology and Evolution 2013; 3: 1702–1716. doi:10.1002/ece3.550PMID:23789079
64. Platts PJ, Gereau RE, Burgess ND, Marchant R. Spatial heterogeneity of climate change in an Afro-montane centre of endemism. Ecography 2013; 36: 518–530.
65. Busch J, Dave R, Hannah L, Cameron A, Rasolohery A, et al. Climate Change and the Cost of Con-serving Species in Madagascar. Conservation Biology 2012; 26: 408–419. doi:10.1111/j.1523-1739. 2012.01838.xPMID:22497442
66. Zelazowski P, Malhi Y, Huntingford C, Sitch S, Fisher JB. Changes in the potential distribution of humid tropical forests on a warmer planet. Philosophical Transactions of the Royal Society A 2011; 369: 137–160. doi:10.1098/rsta.2010.0238PMID:21115517
67. McCain CM, Colwell RK. Assessing the threat to montane biodiversity from discordant shifts in temper-ature and precipitation in a changing climate. Ecology Letters 2011; 14: 1236–1245. doi:10.1111/j. 1461-0248.2011.01695.xPMID:21981631
68. Watson JEM. Human Responses to Climate Change will Seriously Impact Biodiversity Conservation: It's Time We Start Planning for Them. Conservation Letters 2014; 7: 1–2.
69. Satake A, Rudel TK, Onuma A. Scale mismatches and their ecological and economic effects on land-scapes: A spatially explicit model. Global Environmental Change-Human and Policy Dimensions 2008; 18: 768–775.