GURMANIK KAUR*
Research Scholar, EIE Department, SLIET (Deemed-to-be-University), Longowal
Distt. Sangrur, Punjab, INDIA Dr. AJAT SHATRU ARORA
Professor, EIE Department,
SLIET (Deemed-to-be-University), Longowal Distt. Sangrur, Punjab, INDIA Dr. VIJENDRA KUMAR JAIN
HOD & Professor, EIE Department, SLIET (Deemed-to-be-University), Longowal
Distt. Sangrur, Punjab, INDIA
Abstract
There are more than 100 neuromuscular disorders that affect the brain, spinal cord, nerves and muscles. Many of these diseases are hereditary and life expectancy of many sufferers is considerably reduced. Early detection and diagnosis of these diseases by clinical examination and laboratory tests is essential for their management as well as their prevention through prenatal diagnosis and genetic counselling. Such information is also useful in research which may lead to the understanding of the nature and eventual treatment of these diseases. Laboratory investigations include neurophysiological tests, nerve and muscle biopsies, biochemical analysis and more recently DNA analysis for the localization and identification of genes. Electromyographic examination studies the electrical activity of the muscle and forms a valuable neurophysiological test for the assessment of neuromuscular disorders. The shapes and firing rates of the motor unit action potentials (MUAPs) in an EMG signal provide an important source of information for the diagnosis of neuromuscular disorders. In order to extract this information from the EMG signals recorded at low to moderate force levels, it is required to identify and classify the MUAPs composing the EMG signal. The identification of possible MUAPs is done by segmentation of EMG signal using threshold technique. The identified MUAPs are clustered using a statistical pattern recognition technique. After extraction of autoregressive (AR) features, MUAPs are classified using binary support vector machine (SVM) classifier. A total of 12 EMG signals obtained from 3 normal (NOR), 5 myopathic (MYO) and 4 motor neuron diseased (MND) subjects were analyzed. The classification accuracy of binary SVM with AR features is 100%. In conclusion, the methodology described in this work make possible the development of a fully automatic electromyogram (EMG) signal analysis which is accurate, simple, fast and reliable enough to be used in routine clinical environment.
Keywords-Electromyography, motor unit action potentials, classification, binary support vector machine.
I. INTRODUCTION
Clinical electromyography analyses the EMG signal recorded from a contracting muscle using a needle electrode to diagnosis neuromuscular disorders. EMG is composed of MUAPs, generated by the repetitive discharges of groups of muscle fibers called motor units (MUs). The term motor unit refers collectively to one motor neuron and the group of muscle fibers it innervates and is the smallest functional unit of the skeletal muscle that can
be activated by volitional efforts. MUAPs from different MUs tend to have distinct shapes, which remain almost the same for each discharge. These MUAPs can be identified and tracked using different pattern recognition techniques. The resulting information can be used to determine the neuromuscular diseases [1-3].
A particular neuromuscular disease alters the properties of the muscle and nerve cells, causing characteristic changes in the MUAPs. When a patient maintains low level of muscle contraction, the individual MUAPs can be easily recognized. As contraction intensity increases, more MUs are recruited. Different MUAPs will overlap, causing an interference pattern in which the neurophysiologist cannot detect individual shapes reliably. Traditionally, in clinical electromyography, neurophysiologists assess MUAPs from their shapes using an oscilloscope and listening to their audio characteristics. Thus, an experienced neurophysiologist can detect abnormalities with reasonable accuracy. However, subjective MUAP assessment, although satisfactory for the detection of unequivocal abnormalities, may not be sufficient to delineate less obvious deviations or mixed patterns of abnormalities [4]. These ambiguous cases call for quantitative MUAP analysis.
With the aid of computer technology, today it is possible to analyze EMG signals quantitatively that helps in saving time, standardizes the measurements and enables the extraction of additional features which cannot be easily calculated manually. A number of computer based quantitative EMG analysis algorithms have been developed in the past. Coatrieux and associates applied cluster analysis techniques for the automatic diagnosis of pathology based on MUAP records [5]-[7]. Andreassen and co-workers developed the MUNIN (Muscle and Nerve Inference Network) which employs a causal probabilistic network for the interpretation of EMG findings [8]-[10]. Fuglsang-Frederiksen and his group developed a rule-based EMG expert system named KANDID [11], [12] and Jamieson [13], [14] developed an EMG processing system based on augmented transition networks. In most of these systems, the generation of the input pattern assumes a probabilistic model, with the matching score representing the likelihood that the input pattern was generated from the underlying class [15]. In addition, assumptions are typically made concerning the probability density function of the input data. Pattichis et al gave a series research yield of classifying MUAPs for differentiation of motor neuron diseases and myopathies from normal [16]. The classifier they used were mainly neural networks, e.g. back propagation, the radial basis function and the self organizing feature map network. However, the aforementioned techniques used to train the neural network classifiers are based on the idea of minimizing the train error, which is named empirical risk. As a result, limited amount of training data and over high training accuracy often lead to over training instead of good classification performance.
SVM introduced by Vapnik [17] is founded in the framework of the statistical learning theory, which is appropriate for approaching classification and regression problems. They operate on the induction principle of structural risk minimization, which minimizes an upper bound on the generalization error. SVMs have shown to be successful in solving many pattern recognition problems [18] and perform much better than non-linear classifiers such as artificial neural networks in many situations [19].
In this preliminary study, we investigated the binary SVM classifier for classification of MUAPs recorded from the biceps brochii muscle. The experimental results proved that the SVM can effectively classify NOR, MYO MND and MYO subjects from NOR.
This paper is organized as follows: Section II presented the material and methodology used for classification of MUAPs. The experimental results are illustrated in section III and section IV covered the conclusion.
II. MATERIAL AND METHODOLOGY
A. Data Acquisition and Pre-processing
Fig. 1. Raw EMG signal.
B. Segmentation
EMG signal is the superposition of the electrical activities of the several motor units. The segmentation of EMG signal is necessary to understand the mechanisms related to muscle and nerve control. This segmentation algorithm calculates a threshold depending on the maximum value
ii
x
max
and the mean absolute value
L i ix
L
11
of the whole EMG signal, where xi are the discrete input values andL
is the number of samples in the EMG signal. The threshold
T
is calculated as follows:if
max
30
,
1
L i i ii
x
L
x
then
L i i x L T 1 5
else T max
i 5i x
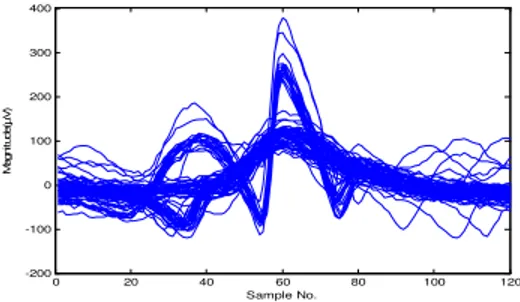
Peaks over the calculated threshold are considered as candidate MUAP’s. Then a window of 120 sampling points (i.e., 6 ms at 20 kHz) is centered at the identified peak. If a greater peak is found in the window, the window is centered at the greater peak; otherwise the 120 points are saved as MUAP waveform [20]. The segmented EMG signal centered at the maximum peak, is shown in Fig. 2.
Fig. 2. Segmented EMG signal in segments of 6ms and centered at the maximum peak.
C. Clustering
In this step, the MUAP clusters are automatically detected and for each cluster the average or template shape is determined. In this work, we have used statistical pattern recognition technique for clustering of similar MUAPs. In this technique euclidian distance is used to identify and group similar MUAP waveforms. The group average is continuously calculated and is used for the classification of MUAPs using a constant threshold [21]. The implementation steps are:
Step1: Start with the first waveform x as input (the first member of the class). 0 1000 2000 3000 4000 5000 -200 -100 0 100 200 300 Sample No. M ag ni tud e( µV )
0 20 40 60 80 100 120
Step2: Calculate the vector length of x and the distance between it and the other segmented waveforms y as:
x
l
N i i x 1 2
whereN120
and
xy
d 2
1 ) ( i N i i y x
Step3: Find the waveform y with the minimum distance
d
min. The waveform y having minimum distance with the x has thegreatest similarity with x and remove it from the input data.
Step4: If
d
minl
x < 0.3 then group, calculate group average and go to step 1 with group average as input. else if number of group members > 2, then form a new class.else waveform is superimposed, go to step 1 with y as input.
This process continues where it stopped comparing the last encountered waveform with all the remaining until all waveforms are processed. The threshold values were chosen heuristically after extensive testing. It is noted that again there are no widely applicable threshold criteria for assigning a MUAP to a class. The threshold used in this work is critical because a smaller value may split a MUAP class with high waveform variability in two or more subclasses, whereas a greater threshold value may merge resembling MUAP classes. The averaged class waveforms are again the unique MUAP waveforms composing the EMG signals. Fig. illustrates a clustered EMG signal.
Fig.3 Clustered MUAPs of an EMG Signal.
D. Feature Extraction
The recorded EMG signal represents a time series that is essentially stochastic. Our algorithm consists of identifying the features of the time series that is recorded in terms of an autoregressive (AR) model. The AR coefficients of a signal x[n] satisfy the following equation:
n
a
x
n
i
v
n
x
N
i
i
1
where
a
i are the AR model coefficients of orderN
,x
n
is the input signal (EMG signal) andv
n
is the white noise [22]. The coefficients of AR model of order 3 were computed by the Burg method producing a total number of 36 coefficients. Theses coefficients can be considered as the features for a particular type of EMG signal.0 20 40 60 80 100 120 -100 -50 0 50 100 150
0 20 40 60 80 100 120 -100 -50 0 50 100 150 200 250 300
E. Classification
A binary SVM classifier is used in this work for classification of clustered MUAPs into NOR, MYO and MND classes [23], [24]. A classification task based on SVM usually involves training and testing data, which consist of a number of data instances. Each instance in the training set contains one ‘‘target value’’ (class labels) and several ‘‘attributes’’. In this work we have used binary SVM classifier first, to classify the normal and diseased subjects. If the signal is diseased, then another binary classifier is used to classify MYO and MND signals.
III. RESULTS AND DISCUSSION
EMG data collected from 12 subjects were analyzed using the methodology described in Section II. Data were recorded from 3 NOR, 5 MYO and 4 MND subjects. Only subjects with no history or signs of neuromuscular disorders were considered as normal. MATLAB was used for implementing the algorithms. The means and standard deviations of the aforementioned AR features of each subject are computed as the input feature vector of binary SVM classifier. The two important advantages of AR features over time domain features are: 1) variations in the positioning of the electrodes on the surface of the muscle do not severely affect the AR coefficients. 2) the amount of information to be presented to the classifier is greatly reduced. Therefore, the total processing time is reduced. The classification accuracy of binary SVM classifier is 100%.
IV. CONCLUSION
An integrated binary classifier based on SVM is adopted in clinical electromyography for differentiating neuromuscular disorders. The objective of SVM is to find optimal hyperplane for separating MUAP clusters. Experimental results show that the binary SVM classifier can be effectively trained for classification of MUAPs. Still the diagnostic results could be further investigated in future works with larger data set and other feature sets.
REFERENCES
[1] DeLuca CJ, Towards understanding the EMG signal, 4th ed., Baltimore: Williams & Wilkinson, 1978.
[2] Krarup C, Pitfalls in electrodiagnosis, J Neurophysiol, vol. 81, 1999, pp. 1115-1126.
[3] McGill KC, Optimal resolution of superimposed action potentials, IEEE Trans Biomed Engg., vol. 49, 2002, pp. 640-650.
[4] Rich field EK, Cohen BA, Albers JW, Review of quantitative and automated needle electromyographic analyses, IEEE Trans. Biomed. Engg., 1981, pp. 506-514.
[5] J. L. Coatrieux, P. Toulouse, B. Rouvrais, and R. Le Bars, Automatic classification of electromyographic signals, EEG Clin. Neurophysiol., vol. 55, 1983 pp. 333-341.
[6] B. Rouvrais, P. Toulouse, J. L. Coatrieux. and R. Le Bars, A possible method of automatic electromyographic analysis and diagnosis on line, Electmyogr. Clin. Neurophysiol, vol. 23, 1983, pp. 457-470.
[7] P. Toulouse, J. L. Coatrieux and B. Le Marec, An attempt to differentiate female relatives of Duchenne type dystrophy from healthy subjects using an automatic EMG analysis, J. Neurolog. Sci., vol. 67, 1985, pp. 45-55.
[8] S. K. Andersen, S. Andreassen, and M. Woldbye, Knowledge representation for diagnosis and test planning in the domain of EMG, In Proc. of the 7th Eur. Conf. on Artificial Intell., Brighton, U.K., 1986, pp. 357-368.
[9] S. Andreassen, S. K. Andersen, F. V. Jensen, M. Woldbye, A. Rosenfalck, B. Falck, U. Kjaerluff, and A. R. Sorensen, MUNIN- An expert system for EMG, Electroenceph. Clin. Neurophvsiol., vol. 66, 1987.
[10] S. Andreassen, F. Jensen. S. K. Andersen, B. Falck, U. Kjaerulff, M. Woldbye, A. R. Sorensen, A. Rosenfalck, and J. Frank, MUNIN- An expert EMG assistant, In Computer Aided Electromygraphy and Expert Systems, J. E. Desmedt, Ed. Elsevier Science Publisher B.V.:New York, pp. 255-277.
[11] A. FugIsang-Frederiksen and S. M. Jeppesen, A rule-based EMG expert system for diagnosing neuromuscular disorders, In Computer Aided Electromyography and Expert Systems, J. E. Desmedt, Ed. Elsevier Science Publisher B.V.:New York, pp.
pp. 289-296, 1989.
[12] A. Fuglsang-Frederiksen, J. Ronager, and S, Vingtoft, A plan-test diagnose expert system for EMG: KANDID, J. Neurolog. Sci., vol.98 (suppl.), 1990, pp. 150.
[13] P. W. Jamieson, Computerized interpretation of electromyographic data, Electroencephalogr. Clin. Neurophysiol., vol. 75, 1990, pp. 392. [14] P. W. Jamieson, A model for diagnosing and explaining multiple disorders, Comput. Biomed. Res., vol. 24, 1991, pp. 307-320. [15] R. P. Lippmann, An introduction to computing with neural nets, IEEE ASSP Mag., 1987, Apr. 4-22.
[16] Contantinos S Pattichis, Andread C Elia, Autoregressive and ceptral analyses of motor unit action potentials. Med. Engg. Physic., vol. 21, 1999, pp. 405-419.
[17] V.P. Vapnik, The nature of statistical learning theory,Springer, New York, 1995.
[18] Gurmanik Kaur, Dr. Ajat Shatru Arora and Dr. V. K. Jain, Multi-Class Support Vector Machine Classifier in EMG Diagnosis, WSEAS Transactions on Signal Processing, vol. 5, Issue 12, 2009, pp. 379-389.
[19] Yu-Dong Cai, Xiao-Jun Liu, Xue-Biao Xu, et al, Prediction of protein structural classes by support vector machines, Comput. Chemi., vol. 26, 2002, pp. 293-296.
[20] Gurmanik Kaur, Dr. Ajat Shatru Arora and Dr. V. K. Jain, Comparison of the techniques used for Segmentation of EMG Signals, 11th
[21] C. I. Christodoulou and C. S. Pattichis, A new technique for the classification and decomposition of EMG signals, In Proc. of the IEEE Int. Conf. on Neural Networks, Perth, Western Australia, vol. 5, 1995, pp. 2303-2308.
[22] A. Kohen, Biomedical signal processing, vol. 1, CRC Press, 1986, pp. 81-89.
[23] Boser B, Guyon I, Vapnik V, A training algorithm for optimal margin classifiers. In Proc. of the 5th Annual Workshop on Computational
Learning Theory, ACM Press, 1992.