Original Article
Minimization of water and chemical usage in the cleaning in place process
of a milk pasteurization plant
Sathit Niamsuwan
1, Paisan Kittisupakorn
1* and Iqbal M. Mujtaba
21 Department of Chemical Engineering, Faculty of Engineering,
Chulalongkorn University, Pathum Wan, Bangkok, 10330 Thailand.
2 School of Engineering, Design and Technology, University of Bradford,
Bradford, West Yorkshire, BD7 1DP, United Kingdom.
Received 1 December 2010; Accepted 1 August 2011
Abstract
Cleaning in place (CIP) is a method of cleaning inner surfaces of piping, vessel, equipment, and associated fitting with disassembly. Although, the CIP processes have been studied continually to improve efficiency for chemical and water con-sumption, the real conventional plant operations of this process still have been considered as a large amount of consumption. The objectives of this work are to study process behaviors and to find out the optimal draining ratio of the CIP cleaning chemicals in a pasteurized milk plant. To achieve these, mathematical models of the CIP process have been developed and validated by the actual process data. With these models, simulation study has been carried out to describe the dynamic behaviors of the process with respect to the concentrations and contaminations in CIP cleaning chemicals. The optimization problem has been formulated and solved using written programs based on MATLAB application program.
Keywords: cleaning in place, pasteurized milk, mathematical model, optimal draining ratio, alkali and acid cleaning
1. Introduction
At the present, food and beverage productions have been strictly controlled in many issues from consumer and purchaser-protecting agencies. One of the most important issues, which affects product image, concerns about trading contacts and relates to a legal obligation is the cleanliness of products. To achieve the controls of cleanliness, the key step is not only measurements and separations of the undesired contaminants in input raw materials, but also cleanup of the residual raw materials which should be properly considered. The hardness of the residual clean up is respect to many factors, with raw material properties being the main factors.
In this paper, a cleaning process in a pasteurized milk plant where cow milk is a raw material has been studied.
Milk, a whitish liquid containing proteins, fats, lactose, vitamins, and minerals, is one of the raw materials difficult to be cleaned. Owing to this liquid property, milk has a higher ability to contact with operating surfaces than any solid foods. Milk leads to a thin film of milk coating on cold surfaces and burnt cruds adhering to hot surfaces. Since it is more fertilized with many nutrients than other liquid raw material, microorganisms can increase more rapidly in the residuals. Consequently, the cleaning systems in a dairy process have to have a high performance in the elimination of all residual contaminations.
CIP, a common type of cleaning processes in most dairy plants, has been applied to clean raw materials and product residues in vessels, pipe lines, and equipment. The CIP provides reliable, fast, economic and efficient cleaning without dismantling the equipment. Moreover, the CIP
* Corresponding author.
Email address: [email protected]
process has been developed continuously for more chemical and water saving, more comfortable operation, and more cleaning efficiency. The recovery of spent CIP chemicals is a main approach presented in several literatures. The mem-brane operation, such as microfiltration, ultrafiltration, nano-filtration and others are well performed to regenerate the caustic cleaning solution from the CIP process in the dairy industry (Henck 1995; Dresch et al., 1999; Mietton-Peuchot 2000; Dresch et al., 2001; Ge’san-Guiziou et al., 2002). In addition, the development of the CIP process has become an approach to improve the consumption efficiency. The clean-ing agent containclean-ing enzyme gives a good performance for removing the milk residue remained in the heated surface (Grabhoff, 2002). In an automatic CIP system, real-time turbi-dity and calcium sensors have been developed and inte-grated in the conductivity monitoring tool (Van Asselt et al., 2002) for improving the cleaning identification. These lead to saving of cleaning agents.
However, from the evaluation of chemical and water consumption in twenty Thai dairy plants, which were sampled, the average consumption in a CIP process is about 10-15% and 50-60% of the total consumption in the dairy plant, respectively (DIW, 2007). In addition, from the data collection in real operations, qualities of waste solutions from CIP processes at each time are varied and the optimization in cleaning operations has been rarely considered. This leads to no cleaning standards resulting in ineffective cleaning.
As mentioned above, this work presents an optimiza-tion approach of a circulaoptimiza-tion of a CIP process to achieve chemical and water saving with respect to given cleaning standards. This work firstly studies the process behavior and an optimization approach to find out an optimal draining ratio for the chemical cleaning steps of the CIP process in a dairy plant. Furthermore, mathematical models have been developed and validated by real plant data to represent the process behavior and to specify optimization constraints.
2. Process Overview
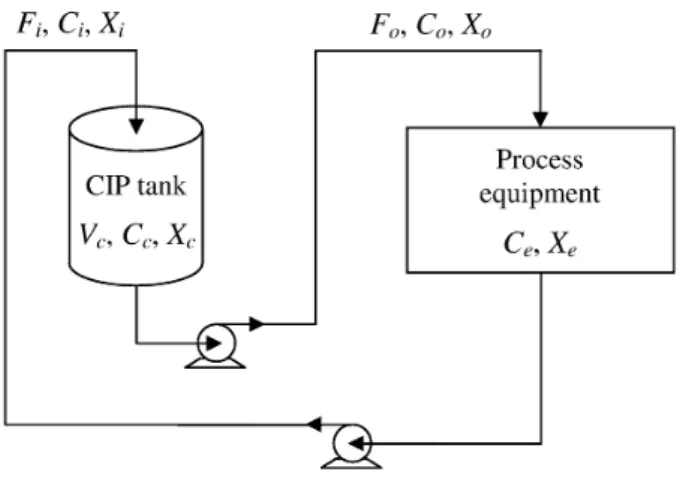
The main purpose of the CIP process is to remove all visible or non-visible dirt and bacteria from vessels and pip-ing systems by water and chemical solutions in the food and beverage industry that are always being obliged to maintain high hygienic standards after the end of a run. To ensure the cleanliness of an operating system properly, it is necessary that there are a number of steps for cleaning in the CIP process as following.
Even though some details of cleaning maybe differ in each plant, the main steps of CIP process are quite similar. Five steps of CIP process can be explained consequently. In the first cleaning step, pre-rinsing with water removes the gross amounts of milk residues. Secondly, a hot alkali solu-tion, which is typically 0.5-1.5% caustic soda (NaOH) at 75°C, is used as a detergent solution in circulative cleaning (Bylund, 1995). In this step, the residual milk remaining from the first step is eliminated. Next, clean water is employed to
remove all remaining chemical solution and milk residues in the alkali cleaning step. After that, a hot acid solution, which is generally 0.5-1% nitric (HNO3) at 68-70°C, is carried out for
neutralizing any alkali residues and removing any mineral soil presented in acid cleaning step (Bylund, 1995). Lastly, the post-rinsing step by water removes the still remaining soils and chemical residues. On account of the main objective of chemical usage reduction in CIP process by the optimiza-tion approach, both alkali and acid cleaning steps have been especially taken into account.
3. Process Model
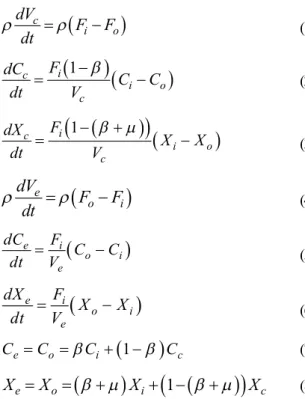
The alkali and acid cleaning steps are continuous circulative cleaning processes. The typical diagram of this system is shown in Figure 2. The system consists of the CIP solution tank and the process equipment: pasteurized milk storage tanks and filling machines. To describe the dynamic behavior profile of concentration and contamination in clean-ing solution (alkali and acid) at the CIP tanks and relevant process equipment, mathematical models have been devel-oped using the principle of mass conservation (Kittisupakorn
Figure 1. Cleaning steps of the CIP process in dairy plants.
et al., 2007; Thitiyasook et al., 2007; Kittisupakorn, 2008; Chuensakul et al., 2008) and the basis of the compartment model (Levenspiel, 1999). The assumptions made in the de-velopment of the mathematical models are constant density and given fixed flow rate of cleaning solutions (alkali and acid). The overall mass and component balances in the form of the compartment model on the CIP tank and the process equipment are given as.
c
i o dV F F
dt
(1)
1
i c
i o c
F
dC C C
dt V
(2)
1
i c
i o c
F
dX X X
dt V
(3)
e
o i
dV
F F
dt
(4)
e i
o i e
dC F C C
dt V (5)
e i
o i e
dX F X X
dt V (6)
1
e o i c
C C
C
C (7)
1
e o i c
X
X
X
X
(8)Because of non-reactive process and moderately large amount of flow rate compared with tank volume, a com-partment model is good enough to represent the dynamic behavior of the process. It can be simulated by solving Equa-tion 1 to 8. In the simulaEqua-tion, the initial condiEqua-tions and process parameters are obtained by observing data and operating condition in a real plant.
To study the cleaning operations, a medium pasteu-rizing milk plant of which product was whole pasteurized milk of natural flavor was visited in Thailand. A decentralized CIP process, which obligated the cleanliness of three pasteurized milk storage tanks and seven filling machines with total cleaned surfaces of about 1,200 m2 was investigated. After
the end of the pre-rinsing step and the rinsing step, the chemical cleaning steps with alkali and acid are carried out, respectively. The alkali cleaning is performed two times per day. By this is meant that cleaning is carried out once a day at the pasteurized milk storage tanks and the filling machines after the end of the production. Meanwhile, the acid cleaning is carried out three times per day. The first time is carried out at the filling machines before the start of the production. The last two times of acid cleaning are employed at the pasteurized milk storage tanks and the filling machines at the end of production.
Referring to conventional plant operations, NaOH and HNO3 are usually used as the alkali and acid solutions.
The cleaning period is set as 10 minutes/time and both inlet and outlet flow rates are specified to 200 liter/min and 100 liter/min equally for the cleaning of pasteurized milk storage tanks and filling machines. The operating and initial condi-tions are given in Table 1. During a cleaning cycle, the chemi-cal concentrations decrease to the acceptable minimum values whereas the contaminations increase to the acceptable maximum values. To maintain the quality, the cleaning solu-tions are taken sampling to find the concentration by labora-tory analysis after that the fresh chemicals are manually added to reset the concentration to the initial value of 1.69%. This practice is performed every the end of last step of CIP process. After the cleaning solutions used for a week (6 days of operation), both cleaning solutions were totally drained out.
To achieve accurate models, the mathematical models have been validated by actual observation data, gathered and analyzed in a laboratory, regarding concentration and con-taminations. The titration methods with either 0.1 mol/dm3
sodium hydroxide or hydrochloric acid have also been carried
Table 1. Initial condition and process parameter values.
Parameters Min-Max Average
Initial chemical concentration of solution at CIP tank (%) 1-2 1.69
Initial chemical concentration of process equipment (%) - 0
Initial volume of solution at CIP tank (liter) - 500
Initial volume of process equipment (liter) - 156
Initial contamination of inlet flow at CIP tank (%) 0-0.001 0
Initial contamination of alkali solution at process equipment (gram/liter) 3.13-3.51 3.27
Initial contamination of acid solution at process equipment (gram/liter) 0.62-0.84 0.73
Inlet flow rate at pasteurized milk storage tank in process equipment (liter/min) 198-202 200
Inlet flow rate at filling machine in process equipment (liter/min) 98.9-101 100
Outlet flow rate at pasteurized milk storage tank in process equipment (liter/min) 199-201 200
out to find the concentration of alkali or acid, respectively. The contamination of solution consideration is solid residues and bacteria. The determination of solid residues is easily made by evaporation and drying methods. For the bacteria, as in the actual operation, the cleaning solution is always heated to a temperature of over 75°C, the bacteria contami-nant in the cleaning solution is negligible.
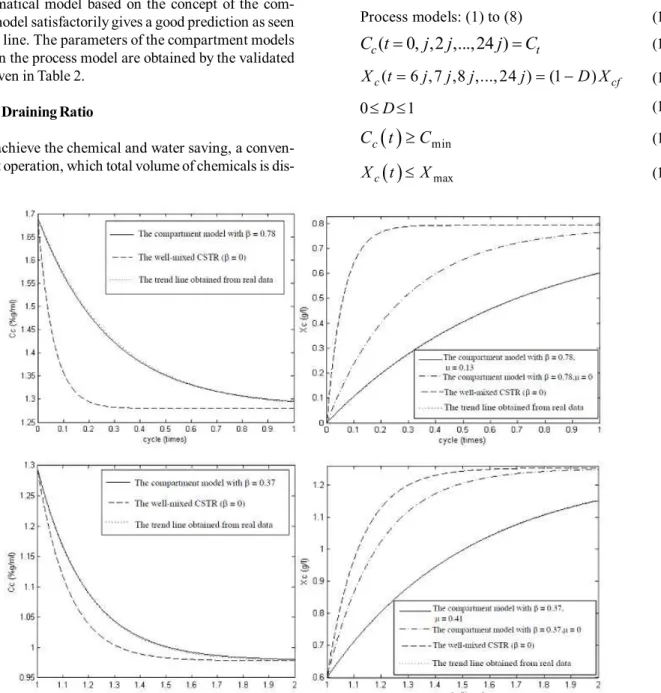
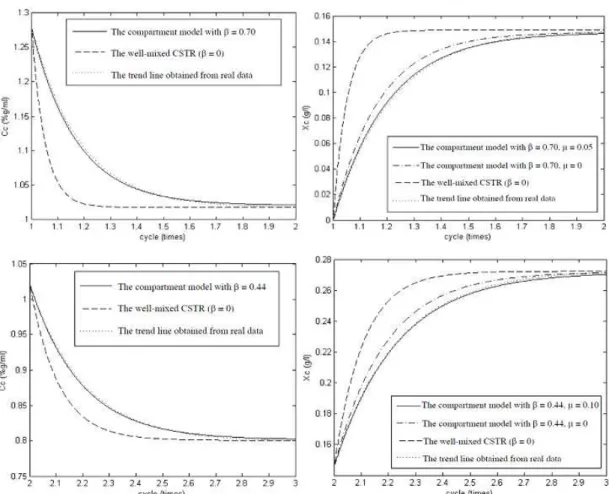
Figure 3 and 4 show validation of dynamic behavior profiles of concentration and contamination. It can be seen that with =0 and =0 the compartment model represents the model of a continuous stirred-tank reactor (CSTR) under the assumption of a well-mixed condition. This model provides inadequately accurate dynamic behavior profiles of concen-tration and contamination as shown in a dashed line while the mathematical model based on the concept of the com-partment model satisfactorily gives a good prediction as seen in the solid line. The parameters of the compartment models ( and ) in the process model are obtained by the validated result as given in Table 2.
4. Optimal Draining Ratio
To achieve the chemical and water saving, a conven-tional plant operation, which total volume of chemicals is
dis-charged, has been replaced by optimal volume of drainage obtained by the optimization method. The objective function is formulated to minimize alkali and acid consumptions in any time periods (Kittisupakorn, 2007). In this work, the monthly consumed chemicals have been taken into account. The draining ratio is a decision variable. The optimizations have been processing under process model constraints and limitations of maximum contaminants and minimum concen-trations.
24
1
1 1 1
c t c cD n
Min V nj j C D V nj C nj
(9) Subject to
Process models: (1) to (8) (10)
( 0, ,2 ,...,24 )
c t
C t
j j
j C
(11)( 6 ,7 ,8 ,...,24 ) (1 )
c cf
X t j j j j D X (12)
0 D 1 (13)
minc
C t
C
(14)
maxc
X t X (15)
The numbers of cleaning cycle in a month have been defined as 48 and 72 times for alkali and acid consequently. An optimal draining ratio defined as a ratio of the optimal amount of cleaning solution (alkali or acid) drainage to the gross volume of cleaning solution has been determined with respect to acceptable minimum concentration and maximum contamination in the cleaning solution. The minimum con-centration (%) and maximum contamination (%) of new operation are similar to those of conventional plant opera-tion, because both values are specified to achieve a minimum use of cleaning chemicals.
5. Results and Discussions
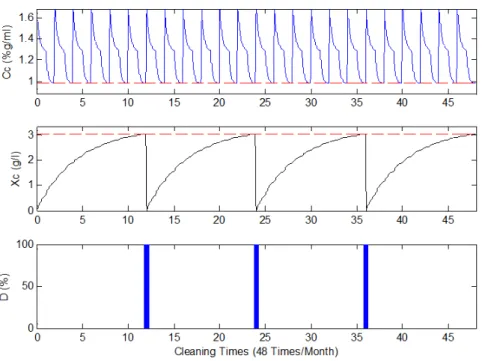
Figure 5 shows the concentration and contamination profile as well as draining ratio of alkali solution for a con-ventional plant operation. It can be seen that the concentra-tion of alkali soluconcentra-tion is initially at 1.69% and decreases to about 1%. After that the alkali is added to reset the solution concentration at the initial value of 1.69%. This practice is carried out every second cleaning time. The middle graph shows that the contamination in the alkali solution goes to 3.03%. To remove this contamination, the total alkali solution Table 2. Parameters for compartment model.
Area Type
Pasteurized milk storage tanks Alkali 0.78 0.13
Acid 0.70 0.05
Filling machines Alkali 0.37 0.41
Acid 0.44 0.10
is drained out and the fresh alkali solution is subsequently filled in at cleaning time of 12, 24, and 36 as shown in the bottom graph.
In the new operation, the total volume of drainage has been replaced by some volume of chemical solution drainage based on an optimal draining ratio. This leads to the partial contaminant remaining in the solution but its contaminant
can be controlled below the acceptable maximum value. The dynamic behavior profiles of concentration and contamina-tion based on the optimal draining ratio have been shown in Figure 6. At the bottom graph, the optimization finds out the optimal drainage ratio of 4.34%. It means that the volume of alkali is drained at 21.7 liters. The alkali solution is drained at 12, 14, 16, … , 46 cleaning time (every second cleaning time
Figure 5. Concentration and contamination of alkali cleaning and draining ratio for the conventional plant operation.
after one week). The top and middle graphs show that the drainage volume with optimal ratio can be controlled the contaminant profile fluctuating around 2.92-3.03% and the concentration profile is almost similar to that of the conven-tional plant operation.
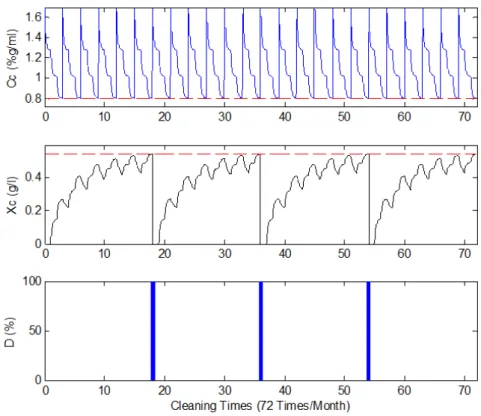
In the case of acid solution for the conventional plant operation, the dynamic behavior profiles of concentration, contamination and draining ratio are shown in Figure 7. In the top graph, the initial acid concentration of 1.69% gradu-ally decreases to 0.8%. Then, the concentration is adjusted to the initial concentration alike the case of alkali. This is performed every third cleaning time. The middle graph shows that the contaminant in the solution continually increases owing to spending the solution. Until the contamination reaches to 0.54%, the spent solution must be replaced by the fresh acid solution in order to remove all the contaminant. This practice is employed at 18, 36, and 48 cleaning times as shown in the bottom graph.
Figure 8 shows the dynamic profile of concentration and contamination as well as draining ratio for the new operation. It can be seen that the optimization determines the optimal draining ratio of 1.70%. This means that the volume of acid is drained at 8.50 liters. In addition, the acid solution is drained at 18, 21, 24, … , 69 cleaning time (every third cleaning time) as shown in the bottom graph. This leads to the concentration profile being similar to the case of conven-tional plant operation and the contamination profile fluctu-ating around 0.42-0.54%.
For the new operation of both acid and alkali cleaning cases, the volume drainage based on the optimization result
leads to reduce chemical and water consumptions. The saving of alkali and acid consumptions are obtained based on the optimization of the problem statement (Equation 9 to 15) and the water consumption savings of both cases (Q) are gained by the simply calculation as follows:
3 24
0 6
conventional plant operation new operation
6 0 1
c c opt c
n n
Q V nj V D V nj
(16)
The benefits of the new operation are given in Table 3. Compared to the conventional plant operation, the optimal draining ratios of 4.34% can provide a saving of 10.39% alkali and 55.49% water in the alkali cleaning step. Meanwhile, a 1.70% draining ratio can give the saving of 8.82% acid and 67.36% water for the acid cleaning step.
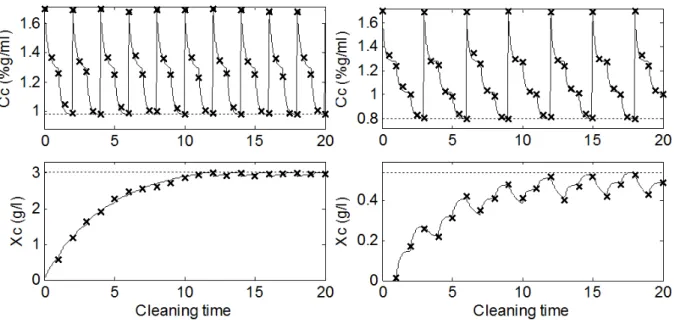
In addition, the new operations for alkali and acid cleaning have been proved in the pilot scale CIP plant before real implementation as shown in Figure 9. The pilot plant has been test-run to prove the profiles of concentrations and contamination as shown in Figure 10. It can be seen that the experimental data are almost identical to predicted data because the process models have been fully adjusted to provide best representation of the real plant before carrying out any optimization.
The new operation based on the optimal draining ratio is remarkably applicable at the chemical cleaning step of the decentralized CIP process in the food and beverage
industry. This is because the drainage is determined based on the optimal draining ratio, which directly affects to the contaminant in the chemical solution. In addition, the pilot scale plant has been used to guarantee the cleaning efficiency before real implementation. However, a monitoring program should be included to ensure food safety.
6. Conclusion
CIP has been carried out to clean raw milk and resi-dues in vessels, pipe lines, and equipments in a dairy process. Referring to the observation in a real plant, the conventional
plant operation gives high consumption for water and clean-ing agent. Consequently, this paper has proposed the appli-cation of an optimization approach to find out the optimal draining volume for alkali and acid cleaning steps in CIP process leading to an improvement in the consumption effi-ciency. The drainage volume based on the optimal draining ratio of 4.34% and 1.70% for alkali and acid, respectively, respects to the acceptable minimum concentration and maxi-mum contamination and gives the consumption saving for the cleaning agents, alkali of 10.39%, acid of 8.82%, and water of 61.41%.
Figure 8. Concentration and contamination of acid cleaning when applying the new operation with 1.70% optimal draining ratio.
Table 3. Comparison of operation results of conventional plant and new operations.
Results Conventional New operation
plant operation Case I: Alkali cleaning step
Alkali consumption (liters/month) 153.84 137.8
Water consumption (liters/month) 2,000 890.6
Minimum concentration (%) 0.98 0.98
Maximum contamination (%) 3.03 3.03
Case II: Acid cleaning step
Acid consumption (liters/month) 188.18 171.6
Water consumption (liters/month) 2,000 653
Minimum concentration (%) 0.80 0.80
Acknowledgements
The authors would like to thank Thailand Research Fund (TRF) under The Royal Golden Jubilee Ph.D. Program for financial support and Sarakhamkaset Co., Ltd. for provid-ing relevant information for this research.
Appendix: Nomenclature
c
C
Chemical concentration of solution in CIP tank(% weight by volume)
e
C
Chemical concentration at process equipment(% weight by volume)
i
C
Chemical concentration of inlet flow at CIP tank (% weight by volume)cs
C
Initial chemical concentration in CIP tank at any cleaning cycle (% weight by volume)cf
C
Final chemical concentration in CIP tank at any cleaning cycle (% weight by volume)min
C
Minimum acceptable concentration (% weight byvolume)
o
C
Chemical concentration of outlet flow at CIP tank (% weight by volume)t
C
Target concentration for chemicals adding (% weightby volume)
D
Draining ratio (% of solution volume in CIP tank)opt
D
Optimal draining ratio (% of solution volume in CIP tank)i
F
Inlet flow rate of solution (liter/min)o
F
Outlet flow rate solution (liter/min)j
Cleaning time in a day for each type of chemical (time)Q
Water consumption saving in a month (cubic meter)t
Cleaning time (time)c
V
Solution volume in CIP tank (liter)i
X
Contamination in solution of inlet flow at CIP tank (gram/liter)c
X
Contamination in solution at CIP tank (gram/liter)cs
X
Initial contamination in CIP tank at any cleaning cycle (gram/liter)Figure 10. Concentration and contamination profile of alkali and acid cleaning at pilot scale CIP plant. Left: Alkali cleaning, Right: Acid cleaning.
e
X
Contamination of process equipment (gram/liter)cf
X
Final contamination in CIP tank at any cleaning cycle (gram/liter)max
X Maximum acceptable contamination (gram/liter)
o
X
Contamination in solution of outlet flow at CIP tank (gram/liter)
Density of solution (kilogram/cubic meter)
Ratio of the bypass stream affected from the size of flow rate
Ratio of the bypass stream affected from imperfect dissolution of contaminationReferences
Bylund, G. 1995. Dairy Processing Handbook, Tetra Pak Pro-cessing Systems, Sweden, pp. 406-407.
Chuensakul, J. and Kittisupakorn, P. 2008. Devise of the reuse system of chromium plating solution and rinse water in chromium plating process. Proceeding of the International Multi Conference of Engineers and Computer Scientists, Hong Kong, China, March 19-21, 2008, 1660-1664.
Department of Industrial Works (DIW)-Bureau of Water Technology and Industrial Pollution Management, 2007. Cleaner Technology Code of Practice; Dairy Industry, Department of Industrial Works, Bangkok, Thailand, pp. 11.
Dresch, M., Daufin, G. and Chaufer, B. 1999. Membrane processes for the recovery of dairy cleaning-in-place solutions. Lait. 79, 245–259.
Dresch, M., Daufin, G. and Chaufer, B. 2001. Integrated membrane regeneration process for dairy cleaning-in-place. Separation and Purification Technology. 22-23, 181-191.
G´esan-Guiziou, G., Boyaval, E. and Daufin, G. 2002. Nano-filtration for the recovery of caustic cleaning-in-place solutions: robustness towards large variations of composition. Journal of Dairy Research. 69, 633-643. Grabhoff, A. 2002. Enzymatic cleaning of milk pasteurizers.
Trans IChemE Part C. 80, 247-252.
Henck, M. 1995. Recycling of used caustic cleaning solutions in the dairy industry by crossflow filtration. Bulletin of the International Dairy Federation. 9504, 175-183. Kittisupakorn, P. 2008. Model Based Control for Chemical
Processes, Chula Press, Bangkok, Thailand, pp. 12-17. Kittisupakorn, P. and Siriburanon, B. 2007. Devise of a clean-ing in place (CIP) with circulation process in a pas-teurized milk tank. Proceeding of the International MultiConference of Engineers and Computer Scien-tists, Hong Kong, China, March 21-23, 2007, 1547-1642.
Levenspiel, O. 1999. Chemical Reaction Engineering, John Wiley & Sons Inc., United States of America, pp. 283-293.
Mietton-Peuchot, M., Condat-Ouillon, C. and Courtois T. 2000. Regeneration of soda solutions issued from cleaning-in-place by cross-flow microfiltration. Entropie. 226, 44-53.
Thitiyasook, P., Kittisupakorn, P., Niamsuwan, S. and Kona-kom, K. 2007. Modeling and optimization of a rinsing process in a recycled plastic plant. Computer Aided Chemical Engineering. 24, 545-550.