Normal or Diabetic Sorted Human Alpha and Beta Cells:
Correlations with Age or BMI of Islet Donors
Clare L. Kirkpatrick1, Piero Marchetti2, Francesco Purrello3, Salvatore Piro3, Marco Bugliani2, Domenico Bosco4, Eelco J. P. de Koning5, Marten A. Engelse5, Julie Kerr-Conte6, Franc¸ois Pattou6, Claes B.
Wollheim1*
1Department of Cell Physiology and Metabolism, University of Geneva, Geneva, Switzerland,2Metabolic Unit, Department of Endocrinology and Metabolism, Cisanello Hospital, Pisa, Italy,3Department of Internal Medicine, Garibaldi-Nesima Hospital, University of Catania, Catania, Italy,4Cell Isolation and Transplantation Centre, University Hospital, Geneva, Switzerland,5Department of Nephrology, Leiden University Medical Centre, Leiden, The Netherlands,6INSERM U859, University Lille Nord de France, University Hospital of Lille, Lille, France
Abstract
Background:Genome-wide association studies have identified susceptibility genes for development of type 2 diabetes. We aimed to examine whether a subset of these (comprising FTO,IDE, KCNJ11, PPARGand TCF7L2) were transcriptionally restricted to or enriched in human beta cells by sorting islet cells into alpha and beta – specific fractions. We also aimed to correlate expression of these transcripts in both alpha and beta cell types with phenotypic traits of the islet donors and to compare diabetic and non-diabetic cells.
Methodology/Principal Findings:Islet cells were sorted using a previously published method and RNA was extracted, reverse transcribed and used as the template for quantitative PCR. Sorted cells were also analysed for insulin and glucagon immunostaining and insulin secretion from the beta cells as well as insulin, glucagon and GLP-1 content. All five genes were expressed in both alpha and beta cells, with significant enrichment ofKCNJ11in the beta cells and ofTCF7L2in the alpha cells. The ratio ofKCNJ11in beta to alpha cells was negatively correlated with BMI, whileKCNJ11expression in alpha cells was negatively correlated with age but not associated with BMI. Beta cell expression of glucagon,TCF7L2 and IDEwas increased in cells from islets that had spent more time in culture prior to cell sorting. In beta cells,KCNJ11,FTOand insulin were positively correlated with each other. Diabetic alpha and beta cells had decreased expression of insulin, glucagon and FTO.
Conclusions/Significance:This study has identified novel patterns of expression of type 2 diabetes susceptibility genes within sorted islet cells and suggested interactions of gene expression with age or BMI of the islet donors. However, expression of these genes in islets is less associated with BMI than has been found for other tissues.
Citation:Kirkpatrick CL, Marchetti P, Purrello F, Piro S, Bugliani M, et al. (2010) Type 2 Diabetes Susceptibility Gene Expression in Normal or Diabetic Sorted Human Alpha and Beta Cells: Correlations with Age or BMI of Islet Donors. PLoS ONE 5(6): e11053. doi:10.1371/journal.pone.0011053
Editor:Kathrin Maedler, University of Bremen, Germany
ReceivedJanuary 11, 2010;AcceptedMay 17, 2010;PublishedJune 10, 2010
Copyright:ß2010 Kirkpatrick et al. This is an open-access article distributed under the terms of the Creative Commons Attribution License, which permits unrestricted use, distribution, and reproduction in any medium, provided the original author and source are credited.
Funding:This work was funded by the Swiss National Science Foundation (310000-116750/1), the Eurodia 6th Framework Programme (LSHM-CT-2006-518153) and an EFSD-Lilly grant (2008). Human islets were obtained thanks to a grant from the Juvenile Diabetes Research Foundation (31-2008-416). The funders had no role in study design, data collection and analysis, decision to publish, or preparation of the manuscript.
Competing Interests:The authors have declared that no competing interests exist. * E-mail: [email protected]
Introduction
Type 2 diabetes, with the exception of rare monogenic forms of the disease [1], arises from interactions between the genetic background of the patient and their environment. While the environmental component, for example the impact of obesity, has been well studied [2], examining the impact of genetic background on this disease has been more difficult. The most powerful studies in this field have been genome-wide association studies seeking to correlate single nucleotide polymorphisms (SNPs) with incidence of diabetes in very large sample sizes [3,4,5]. These studies have uncovered or confirmed several candidates for genetic determi-nants of type 2 diabetes susceptibility. Subsequent to these
findings, other studies have sought to associate either SNPs in these genes, or expression of their RNA, with phenotypic characteristics of tissue donors. However, these have often focused on peripheral tissues such as adipose tissue, liver and muscle. Despite the importance of beta cell function to the development of diabetes, less attention has been given to the expression of these genes in human pancreatic islets (with the exceptions ofKCNJ11
and TCF7L2) due to the lesser availability of this tissue. In the present study we examined expression of FTO, IDE, KCNJ11,
between diabetes risk and SNPs, which are not necessarily related to functional differences in the gene, and for IDE it is as yet unclear if the risk SNP is located in the IDE or the adjacent HHEX locus). In the case ofKCNJ11andTCF7L2we wished to investigate the relative distribution of these transcripts between alpha and beta cells, while forFTO,PPARGandIDEwe aimed to find whether these genes are transcribed in islet cells at all. In all cases, we were interested to see whether expression correlated with age or BMI. We also examined insulin and glucagon mRNA expression, as positive controls for each cell type.
In peripheral tissue, correlations have been observed between the BMI of the tissue donors and mRNA expression of type 2 diabetes susceptibility genes includingFTO,PPARGandTCF7L2
[6,7,8,9,10,11]. Interestingly, high levels of FTO mRNA were not only associated with obesity but also with high levels of mRNA expression of the adipokines leptin, perilipin and visfatin [11]. In islets, TCF7L2 has been extensively studied, but generally by analyzing the effect of SNPs on islet function, donor phenotype or probability of developing diabetes. Studies manipulatingTCF7L2
expression in islets have yielded mixed results, with some showing that increasingTCF7L2 decreases glucose-induced insulin secre-tion and islet viability [12], while others show the opposite [13,14]. Interestingly, Lyssenko and colleagues showed that there was a positive correlation between insulin mRNA andTCF7L2mRNA in human islets, although increasing TCF7L2 mRNA also correlated negatively with glucose-stimulated insulin secretion [12]. However, recent work has suggested thatTCF7L2 mRNA and protein are oppositely regulated [15], so interpretation of results only examining TCF7L2 mRNA should be treated with caution. Moreover, several splice variants ofTCF7L2mRNA have been identified, with differing patterns of tissue-specific expression including one variant that is unique to pancreatic islets [16].
KCNJ11has been known to be a component of the ATP-sensitive potassium channel for many years, with clear implications for both insulin and glucagon secretion. Heterozygous activating point mutations in the protein have been identified in cases of permanent neonatal diabetes [17], in addition to the SNPs associated with mildly increased risk of type 2 diabetes [18,19,20]. However, its expression patterns within the human islet are not known, although it has been shown to be enriched in alpha cells in rat islets [21]. Less is known about the function ofIDEin islets, although studies in the INS cell line have shown that it is capable of degrading amylin as well as insulin, and that its amylin-degrading function may be important for the function of the beta cell by keeping it clear of amyloid-like aggregates [22,23]. AnIDE
knockout mouse exhibited hyperinsulinism and glucose intoler-ance, thought to be due to insufficient insulin clearance by the liver [24].
In this study we sorted human islet cells into beta and alpha fractions using a FACS-based method [25]. This has previously been used for investigating mRNA expression in purified beta cells [26]. It also possesses the advantage of providing both alpha and beta cell types, and with higher yield than can be obtained with laser capture microdissection [27]. Since type 2 diabetes is a bihormonal disease with dysregulation of alpha cell as well as beta cell function, this method is especially valuable since each cell type can be analysed in isolation. We hypothesised that genes which are known to be expressed in islets and which confer susceptibility to type 2 diabetes could display enrichment in the beta cells, or correlate with phenotypic characteristics of the islet donors, as has been found in other tissues [6,7,8,9,10,11]. We therefore aimed to examine the expression of the selected type 2 diabetes suscepti-bility genes in both fractions and search for correlations between gene expression in either fraction, or the ratio of expression
between the alpha and beta cells, with the age and BMI of the islet donors. In this context,PPARG should act as a negative control since it is thought to exert its influence on type 2 diabetes susceptibility through its action in other tissues (adipose tissue and liver) rather than the islet. Finding such correlations between islet cell-specific mRNA expression of type 2 diabetes susceptibility genes and phenotypic characteristics of the islet donors, or differences in gene expression between diabetic and non-diabetic islet cells, could therefore shed light on novel mechanisms of regulation of alpha or beta cell function. This study thus adds to the body of knowledge on the tissue-specific expression of these important genes and indicates further experimental directions to follow with regard to their effect on islet cell function.
Methods
Ethics Statement
Human pancreata were harvested from brain-dead organ donors after informed consent was obtained in writing from family members. Each islet isolation centre (University of Pisa, Geneva University Hospital, Leiden University Medical Centre and the University Hospital of Lille) had permission to isolate islets and to use them for scientific research if they are insufficient for clinical islet transplantation, in accordance with national laws and institutional ethical requirements. Ethical approval for this project was given by the Central Institutional Review Board on Clinical Research of Geneva University Hospital.
Islet and cell culture
Intact human islets and sorted islet cells were cultured in CMRL 1066 medium (5.6 mM glucose) supplemented with 10% FCS, 1 mM Hepes, 100 U/ml penicillin, 100mg/ml streptomycin and
100mg/ml gentamicin at a density of approximately 10,000 IEQ
per 20 ml medium. Islets were maintained in non-adherent 75 cm2 cell culture flasks (Corning) for at least one day before beta cell sorting to allow recovery from the stress of the islet isolation procedure and to expose all islets to uniform culture conditions. Details of islet donors are given in Table 1.
Beta cell purification
Dissociation of islet cells was achieved by incubation with constant agitation for 3 minutes at 37uC in 0.05% trypsin-EDTA (Invitrogen) supplemented with 3 mg/ml DNAse I (Roche) followed by pipetting vigorously to complete the dissociation. Labeling and sorting of alpha and beta cell fractions was performed as described [25] by Newport Green labeling [28] followed by FACS. Approximately 10,000 IEQ were used per isolation.
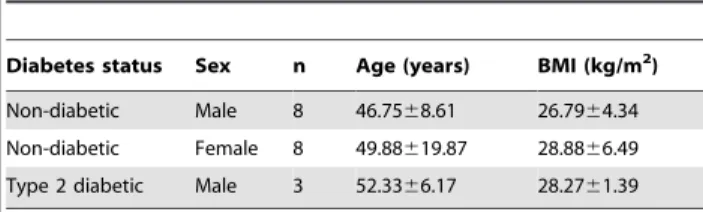
Table 1.Islet donor characteristics.
Diabetes status Sex n Age (years) BMI (kg/m2)
Non-diabetic Male 8 46.7568.61 26.7964.34 Non-diabetic Female 8 49.88619.87 28.8866.49 Type 2 diabetic Male 3 52.3366.17 28.2761.39
Age and BMI are expressed as mean6standard deviation. The SD of the age of the female islet donors is much larger than that of the male islet donors because the oldest and youngest islet donors were female; however, this did not affect the mean age.
Immunofluorescence
Sorted cells were spun down onto microscope slides by Cytospin, followed by fixation with 4% paraformaldehyde and washing in PBS. Cells were permeabilised in PBS+0.2% Triton X-100 for 15 minutes followed by blocking in PBS +0.5% BSA +0.05% Triton X-100 for 30 minutes. Cell spots were incubated with guinea pig anti-insulin and mouse anti-glucagon primary antibodies (diluted 1/200 in PBS), washed, and incubated with anti-guinea pig Alexa Fluor 568 and anti-mouse Alexa Fluor 488 (diluted 1/200 in PBS). Nuclei were stained with DAPI. The cells were examined by fluorescence microscopy and the percentage of insulin- and glucagon-positive cells in each fraction was quantified.
Insulin secretion static incubations
This was performed as described [25] with cells seeded at a density of 209000 cells per well in a 24-well plate, except that cells were also incubated with 5.6 mM glucose and with 20 mM KCl (in addition to 2.8 and 22.2 mM glucose). Insulin secretion and content were determined with an enzyme-linked immunoassay kit (SPI Bio).
Glucagon and GLP-1 quantification
Acid ethanol extracts from beta cells, in which insulin content had already been measured, were used for glucagon and GLP-1 measurements. Glucagon was quantified using a 125I-labelled glucagon radioimmunoassay kit, while GLP-1 was quantified using an ELISA kit specific for the biologically active 36 amide and 7-37 forms of GLP-1 (both from Millipore). Quantification was by interpolation from standard curves prepared with known concen-trations of glucagon or GLP-1, as appropriate. Values for each islet isolation were calculated from 12 replicates of 209000 cells each, extracted in 0.3 ml of 5% acetic acid in ethanol at220uC.
Quantitative RT-PCR
RNA from sorted cells (1009000-5009000) was extracted with the Qiagen RNEasy Micro kit including an on-column DNAse I digestion step. RNA was converted to cDNA using SuperScript II (Invitrogen). Primers were designed using Primer Express software (Applied Biosystems). Primer sequences are provided in Table 2.
Real time PCR was carried out on an ABI 7000 Sequence Detection system (Applied Biosystems) with the SYBR Green reagent using the standard curve method. Standard curve cDNA was prepared from total RNA of whole islets. Amplifications were performed in duplicate for all samples, and values normalised to the housekeeping gene RPS29.
Statistical analysis
Averaged data are displayed as mean6SEM unless otherwise stated for the indicated n number (islet isolations from n donors). Significance of differences in averaged gene expression data between cell fractions were calculated by unpaired T test assuming equal variance. Spearman correlation coefficients, correlation p values and multivariate ANOVA were calculated using the program SPSS Statistics 17.0 (SPSS, Chicago, USA). Correlations were corrected for multiple testing by the Benjamini-Hochberg false discovery rate (FDR) method [29] with the FDR set at 5%. A value of p,0.05 after FDR correction was considered significant.
Results
Confirmation of cell fraction purity and function Sorted alpha and beta cells were applied to microscope slides and co-immunostained for insulin and glucagon in order to detect the amount of alpha cells in the beta cell fraction, and vice versa (Figure 1A and 1B, Table 3). We consistently obtained high purity (89%) beta cells, but the alpha cell fraction had a higher proportion of insulin and glucagon double negative cells (75% glucagon positive, 19% double negative). We found 6.2% insulin positive cells in the alpha cell fraction and 4.7% glucagon positive cells in the beta cell fraction, confirming that this sorting method efficiently separates the cell types. The insulin secretory response of the beta cells to glucose and potassium was also tested (Figure 1C). Consistent with previous data [25], we found that these cells responded to high glucose (22.2 mM) and potassium chloride (20 mM), although there was some variability between donors at basal glucose. This suggests that, at least in the six samples tested for insulin secretion, the beta cells have remained healthy despite the stress of islet isolation followed by cell sorting. To try to account for the variability between samples, we tested for correlations between insulin secretion at low glucose, and age, BMI or islet culture time. No association between any of these variables was found, so at present we cannot account for the source of this variability.
Control gene profiling of sorted islet cell RNA
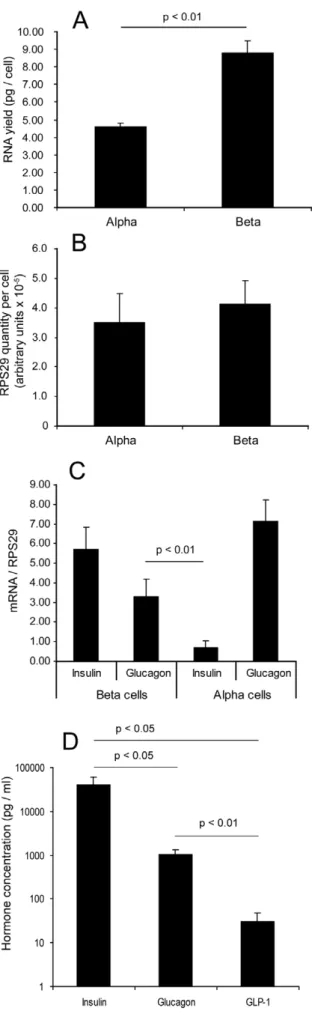
RNA concentrations were measured from samples of sorted cells where the exact number of cells was known, in order to calculate the yield of RNA per cell (Figure 2A). It was found that the beta cells had almost twice as much RNA per cell as the alpha cells (4.5860.22 pg/cell in the alpha cells but 8.7760.70 pg/cell in the beta cells, p,0.01), consistent with their larger size. It was therefore necessary to confirm that the control gene for quantitative PCR was not over-represented in beta cells. We measured transcription of the control gene RPS29 (ribosomal protein subunit 29) in cDNA prepared from these samples, quantified it using the standard curve method and divided by the number of cells from which the RNA was prepared. There was no significant difference in RPS29 transcript quantity per cell between the cell fractions (Figure 2B), suggesting that beta cells do not overproduce this transcript relative to alpha cells. All values for both cell fractions were within two standard deviations of the mean, suggesting that there is also no significant difference in RPS29 transcript quantity per cell between islet donors. This result Table 2.Quantitative PCR primer sequences.
Gene
NCBI accession no. of source
59primer 39primer
RPS29 NM 001032 GAGCCACCCGCGAAAAT CCGTGCCGGTTTGAACAG Insulin BT 007778 GCAGCCTTTGTGAACCAACA
TTCCCCGCACACTAGGTAGAGA Glucagon NM 002054 CAGGCAGACCCACTCAGTGA
CTGGTGAATGTGCCCTGTGA
FTO NM 001080432 GTTCACGGCCTGCACTCAT
CCCTGGCTGCTTTGCTTAAT
IDE NM 004969 CTCGGAACCTTGCTTCAACAC GGCCCGCTGAAGACGAT
KCNJ11 NM 000525 TTGGCAACACCGTCAAAGTG
GAGGCGAGGGTCAGAGCTT
PPARG NM 138712 GGCTTCATGACAAGGGAGTTTC
AAACTCAAACTTGGGCTCCATAAA
TCF7L2 NM 001146274 CAGATGAAATGGCCACTGCTT GCATCCTTGAGGGCTTGTCTA
confirmed that RPS29 is an appropriate control gene for quantitative PCR in this context and that it will not introduce bias when comparing relative amounts of other transcripts
between the alpha and beta cells. Having established that we had an appropriate control gene, we measured insulin and glucagon transcript levels normalised to RPS29 in both cell fractions from all non-diabetic donors (Figure 2C). As expected from the immunofluorescence experiments, high levels of insulin were seen in the beta cell fraction and glucagon in the alpha cell fraction. Insulin transcript in the alpha cells was low, as expected, but despite the small number of alpha cells seen in the beta cell fraction, glucagon transcript in the beta cells was unexpectedly high. There was no significant difference observed between male and female donors for either gene in either fraction (alpha cell glucagon had a tendency to be higher in RNA from male donors, but this did not achieve significance, p = 0.06).
Insulin, glucagon and GLP-1 content measurement Following our finding that glucagon mRNA was apparently highly expressed in the beta cells (Figure 2C) and in light of the discovery of GIP production in alpha cells by Fujita et al [30] we tested extracts of beta cells for insulin, glucagon and GLP-1 content. For the six sample sets in which insulin secretion and content had already been determined, we measured glucagon and GLP-1 content and compared these to the insulin content measurements (Figure 2D). The average concentrations of insulin, glucagon and GLP-1 were 39.96103pg/ml, 1029 pg/ml and 31 pg/ml, respectively. Converted to molar concentrations, these values correspond to 7000 pM insulin, 294 pM glucagon and 9 pM GLP-1. The molar concentration of glucagon is therefore 4.2% of the molar concentration of insulin (p,0.05) in these samples, in striking agreement with the 4.73% average contam-ination of alpha cells in the beta cell fraction (Table 3). Our rationale for measuring GLP-1 was that beta cells express the prohormone convertase PC1/3, which is capable of cleaving preproglucagon peptide to generate GLP-1 [31]. However, GLP-1 content was at the limit of detection of the assay and at only 0.14% of the molar concentration of insulin in these beta cell extracts (p,0.05), showing that the beta cells are not synthesising this peptide either. We therefore conclude that the glucagon content is due to the cross contamination by alpha cells, but that human beta cells are capable of glucagon mRNA transcription.
Type 2 diabetes susceptibility gene profiling of sorted islet cell RNA
We selected the genesFTO,IDE,KCNJ11,PPARGandTCF7L2
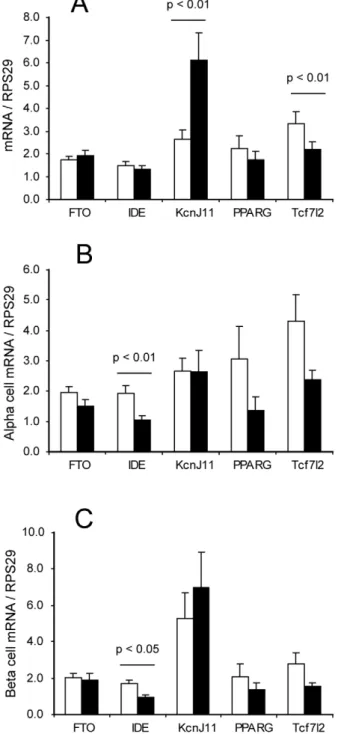
as candidates to test for expression in the sorted islet cells. Transcript levels of these genes were measured in both cell fractions from all non-diabetic donors and normalised to RPS29. The ratio of expression (beta cells/alpha cells) was also calculated. All transcripts were observed in both alpha and beta cell fractions, and for FTO, IDE and PPARG there was no difference in the abundance of the transcripts between the alpha and beta cells. However,KCNJ11 mRNA was enriched in the beta cells, while
TCF7L2mRNA was enriched (although to a lesser extent) in the
Figure 1. Characterization of alpha and beta cell fractions.A: Representative image of the beta cell fraction stained for insulin (red) and glucagon (green). B: Representative image of the alpha cell fraction stained likewise. C: Insulin secretion from sorted beta cells. Data are displayed as mean+SEM (islets from separate donors, n = 6 for all glucose concentra-tions and 5 for KCl). Statistical significance was assessed by one-tailed paired Student’s T test comparing stimulated to basal secretion each time. doi:10.1371/journal.pone.0011053.g001
Table 3.Quantification of insulin and glucagon positive cells.
Cell fraction Alpha Beta
Insulin positive (%) 6.2065.12 88.5568.76 Glucagon positive (%) 74.47611.12 4.7363.31 Double negative (%) 19.3366.63 6.7366.34
alpha cells (p,0.01 for both genes, Figure 3A). The data were analysed for sex-specific differences in the amounts of transcripts present in both cell fractions, as for insulin and glucagon, and the only difference observed was forIDEwhich was more abundant in male than in female cells for both cell types (Figure 3B and C, p,0.01 for the alpha cells and p,0.05 for the beta cells).
Correlation of insulin gene expression with age
Multivariate ANOVA was performed to test for any interaction effects between age, BMI and sex of the islet donors on gene expression, in both cell types and on the ratio of expression in beta to alpha cells. No interaction effects were observed in two-way (age vs. BMI, BMI vs. sex and age vs. sex) or three-way (age vs. BMI vs. sex) comparisons. We also confirmed that average age and BMI of the islet donors was not significantly different between the sexes (Table 1) and that they did not correlate with each other (r =20.195, p = 0.468). Having established that each of these variables could be considered separately, we calculated Spearman non-parametric correlation coefficients for correlations between insulin and glucagon mRNA expression and age or BMI of the islet donors, in both cell types. No association was observed between glucagon (in alpha or beta cells) and age or BMI. In the beta cells there was a slight negative association of insulin mRNA with donor age, although this did not reach significance after multiple testing correction (p = 0.056 after FDR).
Correlations of type 2 diabetes susceptibility gene expression with age or BMI
We calculated correlation coefficients forFTO, IDE, KCNJ11,
PPARGandTCF7L2mRNA expression with age or BMI in both cell types and for the ratio of expression in beta to alpha cells, for all samples together. No significant correlations with age or BMI were observed forIDE,PPARGorTCF7L2. However, the ratio of
KCNJ11 expression in beta to alpha cells for each donor was negatively correlated with BMI, suggesting that the enrichment of
KCNJ11 in the beta cells relative to the alpha cells is more pronounced in donors with low BMI and decreased in donors with high BMI (Figure 4A). No other correlation of gene expression with BMI was observed. We observed thatFTOexpression in beta cells had a slight negative correlation with donor age (although not quite at the level of significance after multiple testing correction, p = 0.067 after FDR), but no association with BMI. In the alpha cells, we also observed a negative correlation ofKCNJ11transcript with age (Figure 4B). We calculated pairwise correlation coefficients for all the transcripts against each other, which revealed that in beta cells insulin, KCNJ11 and FTO correlated positively with each other (Figure 5A, B and C). There was also a positive association betweenKCNJ11 and glucagon in the alpha cells (Figure 5D), and betweenTCF7L2andIDEin both cell types (Figure 5E, alpha, and F, beta).
Figure 2. Control gene expression in sorted islet cells.A: RNA yield (picograms per cell) from the sorted islet cell fractions, expressed as mean+SEM (n = 4). B: Housekeeping gene RPS29 transcript quantity per cell, mean+SEM of quantitative RT-PCR measurements normalised to cell number (n = 6). C: Insulin and glucagon mRNA expression in both cell fractions, normalised to RPS29, mean+SEM from all non-diabetic islet donors (n = 16). D: Insulin, glucagon and GLP-1 content of beta cell fractions expressed in pg/ml (note logarithmic axis), mean+SEM of 6 non-diabetic islet isolations which were also used for insulin secretion measurements in Figure 1C. Statistical significance of differences in hormone concentrations was by Student’s T test assuming equal variance.
Controlling for time spent in culture
Since the islet preparations had not all spent the same length of time in culture, we investigated whether the culture time had affected transcription of any of the genes. Calculation of correlation coefficients between mRNA expression and number
of days spent in culture showed that there was a positive association between culture time and expression of bothTCF7L2
and IDE in beta cells (Figure 6). In alpha cells, no correlation between culture time and gene expression was observed. For beta cell glucagon, although the correlation was not significant (p = 0.096), the two samples which had been cultured for 10 or 11 days prior to cell sorting had higher levels of glucagon transcript in the beta cells than the remainder of the samples which had been cultured for 7 days or less (Figure 7A). The high levels of glucagon in these two samples did not account for the average beta cell glucagon transcript being higher than the average alpha cell insulin transcript, as there was still significantly more beta cell glucagon than alpha cell insulin when the outlier values were excluded (Figure 7B, p,0.01 with or without the outliers). This finding suggests that the beta cells could dedifferentiate during islet culture with concomitant production of glucagon, although some non-alpha cell glucagon transcript is already present even in recently isolated islets.
Figure 3. Type 2 diabetes susceptibility gene expression in sorted islet cells.A: mRNA expression of type 2 diabetes susceptibility genes in alpha cells (white bars) and beta cells (black bars), expressed as mean + SEM of all non-diabetic islet donors (n = 16). Statistical significance of pairwise comparisons between alpha and beta cell expression was by Student’s T test assuming equal variance. B: Expression of the same data in alpha cells only with male (white bars) and female (black bars) islet donors considered separately (n = 8 each). C: Expression of the same data in beta cells only with male (white bars) and female (black bars) islet donors considered separately (n = 8 each). doi:10.1371/journal.pone.0011053.g003
Figure 4. Correlations of type 2 diabetes susceptibility gene expression with age or BMI.Filled square data points represent non-diabetic donors, empty squares represent non-diabetic donors. Trendlines, Spearman correlation coefficients (rho) and their corresponding p values are calculated on the basis of the non-diabetic data points only. A: Correlation of the ratio of enrichment ofKCNJ11mRNA in beta cells
relative to alpha cells with BMI. B: Correlation of alpha cellKCNJ11
mRNA with age.
Type 2 diabetes susceptibility gene expression in sorted cells from diabetic islets
Alpha and beta cells were sorted from three preparations of type 2 diabetic islets and gene expression analysed as for the non-diabetic donors. Beta cell insulin and alpha cell glucagon were significantly lower in the diabetic cells than in the non-diabetic cells (Figure 8A, p,0.05 for beta cell insulin and p,0.001 for alpha cell glucagon). However, no difference was observed in beta
cell glucagon transcripts between diabetic and non-diabetic cells. There was a tendency for glucagon to be proportionally higher relative to insulin in the diabetic beta cells (insulin/glucagon ratio was 5.5362.41 in non-diabetic beta cells but 0.9460.36 in diabetic beta cells), but this was not significant due to the variation in the non-diabetic cells (p = 0.078). Expression of the type 2 diabetes susceptibility genes in diabetic cells was similar (in amount and inKCNJ11 beta cell enrichment) to their expression in
non-Figure 5. Correlations of mRNA levels with each other.Filled square data points represent non-diabetic donors, empty squares represent diabetic donors. Trendlines, Spearman correlation coefficients (rho) and their corresponding p values are calculated on the basis of the non-diabetic data points only. A: Correlation of beta cell insulin andFTO. B: Correlation of beta cellKCNJ11andFTO. C: Correlation of beta cell insulin andKCNJ11.
D: Correlation of alpha cell glucagon andKCNJ11. E: Correlation of alpha cellTCF7L2andIDE. F: Correlation of beta cellTCF7L2andIDE.
diabetic cells (Figure 8B). However, significantly lower levels of
FTO mRNA were observed in both alpha and beta cells from diabetic islets (Figure 8C, p,0.05 for alpha and beta cells, diabetic versus non-diabetic). The individual values were compared to those of the non-diabetic donors for each of the correlations previously established, and they did not noticeably deviate from the trendlines except for low levels ofKCNJ11 in the alpha cells (Figures 4D and 5D).
Discussion
In this study we have examined expression of type 2 diabetes susceptibility genes in sorted islet cells in order to identify expression patterns associated with cell type or with phenotypic characteristics of the islet donors. We have found that the potassium channel subunit KCNJ11 is enriched in human beta cells relative to alpha cells. This was surprising, given our previous finding that in rat islets this gene is more highly expressed in the alpha cells [21], and emphasises the importance of not assuming that rodent models can completely recapitulate the situation in human tissue. The negative correlation between the beta cell enrichment of KCNJ11 and the BMI of the islet donors is
suggestive of a link between BMI and islet function. However, there is no way of determining whether increased BMI is a cause or consequence of lowerKCNJ11transcription in the beta cells. For example, it could be that increased fat mass puts more stress on the beta cell leading to decreased transcription of genes important for beta cell functionality, or alternatively that lower levels ofKCNJ11mRNA in the beta cell relative to the alpha cell may result in changed insulin/glucagon ratio and hyperglycaemia, leading eventually to increased lipid production by the liver and enhanced fat deposition in the adipose tissue. Although we cannot distinguish between these scenarios, this work suggests a novel connection between the ATP sensitive potassium channel and obesity.
It was also surprising, given the literature onFTOexpression in other tissue types, that we found no association between expression ofFTOand BMI in islet cells. The mechanism of action ofFTO in vivois yet to be confirmed, although it has been shown to function
in vitro as a DNA demethylase [32] and a transgenic mouse carrying a point mutation which decreases demethylase activity of
FTO in vitrois protected from high fat induced weight gain [33]. Expression of FTO, regardless of SNP status, was found to be increased in adipose tissue from obese individuals relative to those of normal weight [11]. However, we only observed a slight association with age. This is in agreement with Grunnetet al, who
Figure 6. Effect of islet culture time onTCF7L2andIDEmRNA expression in non-diabetic islets.A: Scatter plot of beta cellTCF7L2
mRNA against islet culture time prior to cell sorting. B: Scatter plot of beta cellIDEmRNA against islet culture time prior to cell sorting.
doi:10.1371/journal.pone.0011053.g006
Figure 7. Effect of islet culture time on beta cell glucagon transcript levels.A: Scatter plot of beta cell glucagon mRNA against islet culture time prior to cell sorting (non-diabetic islets only). B: Average insulin and glucagon levels in non-diabetic islets excluding those which were cultured for 10 or 11 days (n = 14).
recently found an age-dependent decline in FTO expression (in addition to associations with BMI and sex, depending on tissue type) in adipose tissue and skeletal muscle [34]. This study also reported correlations between FTO mRNA expression and the mRNA expression of various other functional genes, including
SLC2A4 (previously GLUT4), PPARGC1A and various genes involved in oxidative phosphorylation. This finding has interesting parallels with the correlation found by Zabenaet albetweenFTO
and adipokine expression in adipose tissue, and our findings that
FTO,KCNJ11and insulin are positively correlated with each other in human beta cells. We could envisage that FTO might be a master regulator of metabolic function in various tissues and that an age-dependent decline in FTO expression is involved in the decrease of metabolic function occurring during the aging process. The association betweenTCF7L2andIDEsuggests thatTCF7L2
may play a role in control of transcription ofIDE. If confirmed, this would suggest a novel way by whichTCF7L2contributes to beta cell viability, since IDE contributes to clearance of islet amyloid as well as insulin [23]. Intriguingly, on examination of the promoter of theIDEgene (NCBI accession no. NG_013012) we observed two sites with the sequence TGCAAAG at -756 and +240 bases relative to the transcription start site of IDE. This sequence is known to be a TCF binding site, and it is required for
TCF7L2-mediated regulation of cyclin D1 transcription in human colon cancer cells [35]. A recent study found thatPPARG could induce transcription ofIDEin primary neurons [36], but we did not find any association betweenIDEandPPARGin our islet cell investigations. Indeed, we did not observe any difference in
PPARG expression between cell types or between diabetic and non-diabetic samples, nor any association with phenotypic characteristics of the islet donors, as expected for a gene which exerts its major effect in other tissues than the islet. The positive association between TCF7L2, IDE and islet culture time might suggest that the beta cells are adopting a more alpha-cell-like state during islet culture, especially since average alpha cellTCF7L2
mRNA was found to be higher than average beta cellTCF7L2
(Figure 3A). Differences inTCF7L2mRNA expression have also been observed between functionally heterogeneous populations of rat beta cells, with the lower-responding ‘‘immature’’ beta cells expressing higher levels of TCF7L2 than the higher-responding ‘‘mature’’ population [37].
A surprising finding of this work was that the beta cell fraction displayed disproportionally high glucagon transcript relative to glucagon protein. Since the glucagon protein could be attributed to cross-contamination by alpha cells (4–5%), we conclude that the glucagon mRNA is produced, but is under post-transcriptional control, in the beta cells. This result is consistent with the findings of Katsuta et al [38] who discovered that insulin and glucagon are co-expressed in a subset of mature mouse beta cells. The mechanism of post-transcriptional regulation is unclear, but could involve islet cell-specific microRNAs. In this context, it is noteworthy that in the miR375 knockout mouse, beta cell mass was decreased and alpha cell mass increased, and the mice displayed hyperglucagonaemia [39]. It may be speculated that miR375 normally suppresses glucagon translation in the beta cell, which would be consistent with the phenotype of these mice. While islet culture time did not show a significant correlation with beta cell glucagon mRNA, it did appear to increase it after 7 days of islet culture. Increased beta cell glucagon after long periods of islet culture is in agreement with Russet al, who found that labeled adult human beta cells started to express glucagon protein during dedifferentiation [40]. However, despite the presence of the glucagon transcript in the beta cells, during examination of the immunofluorescence images no double (insulin and glucagon) positive cell was ever observed. This is also in agreement with Katsuta et al, who found co-transcription of islet hormones in sorted mouse beta cells, but no colocalisation of immunofluores-cence staining for the corresponding proteins [38]. It is still possible that other factors apart from islet culture time (such as
Figure 8. Insulin, glucagon and type 2 diabetes susceptibility gene expression in diabetic sorted islet cells. A: Differential expression of beta cell insulin and alpha cell glucagon in non-diabetic (white bars) compared to diabetic (black bars) islet cells. B: Expression levels of type 2 diabetes susceptibility gene in diabetic alpha cells (white bars) and beta cells (black bars). C: Differential expression ofFTO
in both cell fractions from non-diabetic (white bars) compared to diabetic (black bars) islet cells. Statistical comparison of diabetic to non-diabetic samples was by unpaired T test assuming unequal variance. n = 16 non-diabetic and 3 diabetic samples.
cause of death of the donor, or cold ischaemia time) could affect gene expression in the sorted cells, but in culturing the islets for at least 24 hours we hoped to normalise the environment of the islets in order to minimise the effects of such external factors.
Although it was not unexpected to find lower levels of insulin in the diabetic beta cells, it was surprising to find decreased alpha cell glucagon, especially since one of the hallmarks of diabetes is inappropriately increased glucagon secretion [41]. However, we have only examined mRNA expression, which may not reflect glucagon secretion or content. The higher proportion of alpha cells observed in diabetic islets by Denget al[42] may play a more important role in inappropriate glucagon release. However, this study also revealed lower maximal glucagon release during perifusion of diabetic islets when stimulated with KCl, possibly reflecting lower islet glucagon content. The decreased amount of
FTO observed in both cell types from the diabetic islets is also intriguing. In a previous study comparing gene expression in diabetic islets against normal islets using DNA microarrays,FTO
was not identified as a differentially regulated gene [43]. Further studies on the function of FTO in islets would be required to elucidate whether it plays a role in beta cell viability or dysfunction, and if so, how.
We acknowledge that this study is limited by a small number of samples, since the starting material can only be obtained from organ donors as opposed to peripheral tissue biopsies. Diabetic islets are less numerous and even more sensitive to the stress of the isolation process than normal islets ([42] and our own observa-tions), and it is not often that enough diabetic islets can be obtained to perform the cell sorting procedure on them. In addition, we cannot account for any effects of SNPs on gene
expression since the organ donors are not genotyped. This may explain why we were unable to reproduce the correlation between insulin andTCF7L2mRNA expression observed by Lyssenkoet al
in whole islets [12]. The primers used forTCF7L2in our study are located in exon 5, and would therefore have amplified all splice variants ofTCF7L2mRNA [16], so we would have been unable to observe isoform-specific correlations. In the case of FTO it has been reported that there was no association between SNPs and
FTOmRNA expression by both studies which have examined this parameter [11,34] so our data onFTOshould not be affected by not knowing the donors SNP status. We consider that our analysis of RNA expression of type 2 diabetes susceptibility genes in sorted alpha and beta cells has revealed interesting patterns of gene expression between cell types and between diabetic and non-diabetic samples, which may underpin future functional studies on the mechanisms of action of type 2 diabetes susceptibility genes.
Acknowledgments
We are grateful to Geraldine Parnaud for helping us establish the cell sorting method in our laboratory. We also acknowledge the technical assistance of Deborah Aeberhard and Dale Brighouse.
Author Contributions
Conceived and designed the experiments: CLK FP CW. Performed the experiments: CLK FP SP. Analyzed the data: CLK PM FP SP MB DB EJdK ME JKC FP CW. Contributed reagents/materials/analysis tools: PM MB DB EJdK ME JKC FP. Wrote the paper: CLK PM FP MB DB EJdK ME JKC FP CW.
References
1. Hattersley AT (1998) Maturity-onset diabetes of the young: clinical heteroge-neity explained by genetic heterogeheteroge-neity. Diabet Med 15: 15–24.
2. Cnop M (2008) Fatty acids and glucolipotoxicity in the pathogenesis of Type 2 diabetes. Biochem Soc Trans 36: 348–352.
3. Saxena R, Voight BF, Lyssenko V, Burtt NP, de Bakker PI, et al. (2007) Genome-wide association analysis identifies loci for type 2 diabetes and triglyceride levels. Science 316: 1331–1336.
4. Scott LJ, Mohlke KL, Bonnycastle LL, Willer CJ, Li Y, et al. (2007) A genome-wide association study of type 2 diabetes in Finns detects multiple susceptibility variants. Science 316: 1341–1345.
5. Zeggini E, Weedon MN, Lindgren CM, Frayling TM, Elliott KS, et al. (2007) Replication of genome-wide association signals in UK samples reveals risk loci for type 2 diabetes. Science 316: 1336–1341.
6. Brody F, Hill S, Celenski S, Kar R, Kluk B, et al. (2007) Expression of ectonucleotide pyrophosphate phosphodiesterase and peroxisome proliferator activated receptor gamma in morbidly obese patients. Surg Endosc 21: 941–944. 7. Frayling TM, Timpson NJ, Weedon MN, Zeggini E, Freathy RM, et al. (2007) A common variant in the FTO gene is associated with body mass index and predisposes to childhood and adult obesity. Science 316: 889–894.
8. Hindle AK, Brody F, Tevar R, Kluk B, Hill S, et al. (2009) TCF7L2 expression in diabetic patients undergoing bariatric surgery. Surg Endosc 23: 700–704. 9. Redonnet A, Bonilla S, Noel-Suberville C, Pallet V, Dabadie H, et al. (2002)
Relationship between peroxisome proliferator-activated receptor gamma and retinoic acid receptor alpha gene expression in obese human adipose tissue. Int J Obes Relat Metab Disord 26: 920–927.
10. Vidal-Puig AJ, Considine RV, Jimenez-Linan M, Werman A, Pories WJ, et al. (1997) Peroxisome proliferator-activated receptor gene expression in human tissues. Effects of obesity, weight loss, and regulation by insulin and glucocorticoids. J Clin Invest 99: 2416–2422.
11. Zabena C, Gonzalez-Sanchez JL, Martinez-Larrad MT, Torres-Garcia A, Alvarez-Fernandez-Represa J, et al. (2009) The FTO obesity gene. Genotyping and gene expression analysis in morbidly obese patients. Obes Surg 19: 87–95. 12. Lyssenko V, Lupi R, Marchetti P, Del Guerra S, Orho-Melander M, et al. (2007) Mechanisms by which common variants in the TCF7L2 gene increase risk of type 2 diabetes. J Clin Invest 117: 2155–2163.
13. Shu L, Sauter NS, Schulthess FT, Matveyenko AV, Oberholzer J, et al. (2008) Transcription factor 7-like 2 regulates beta-cell survival and function in human pancreatic islets. Diabetes 57: 645–653.
14. da Silva Xavier G, Loder MK, McDonald A, Tarasov AI, Carzaniga R, et al. (2009) TCF7L2 regulates late events in insulin secretion from pancreatic islet beta-cells. Diabetes 58: 894–905.
15. Shu L, Matveyenko AV, Kerr-Conte J, Cho JH, McIntosh CH, et al. (2009) Decreased TCF7L2 protein levels in type 2 diabetes mellitus correlate with downregulation of GIP- and GLP-1 receptors and impaired beta-cell function. Hum Mol Genet 18: 2388–2399.
16. Osmark P, Hansson O, Jonsson A, Ronn T, Groop L, et al. (2009) Unique splicing pattern of the TCF7L2 gene in human pancreatic islets. Diabetologia 52: 850–854.
17. Gloyn AL, Pearson ER, Antcliff JF, Proks P, Bruining GJ, et al. (2004) Activating mutations in the gene encoding the ATP-sensitive potassium-channel subunit Kir6.2 and permanent neonatal diabetes. N Engl J Med 350: 1838–1849. 18. Willer CJ, Bonnycastle LL, Conneely KN, Duren WL, Jackson AU, et al. (2007)
Screening of 134 single nucleotide polymorphisms (SNPs) previously associated with type 2 diabetes replicates association with 12 SNPs in nine genes. Diabetes 56: 256–264.
19. Gloyn AL, Weedon MN, Owen KR, Turner MJ, Knight BA, et al. (2003) Large-scale association studies of variants in genes encoding the pancreatic beta-cell KATP channel subunits Kir6.2 (KCNJ11) and SUR1 (ABCC8) confirm that the KCNJ11 E23K variant is associated with type 2 diabetes. Diabetes 52: 568–572. 20. Florez JC, Burtt N, de Bakker PI, Almgren P, Tuomi T, et al. (2004) Haplotype structure and genotype-phenotype correlations of the sulfonylurea receptor and the islet ATP-sensitive potassium channel gene region. Diabetes 53: 1360–1368.
21. Franklin I, Gromada J, Gjinovci A, Theander S, Wollheim CB (2005) Beta-cell secretory products activate alpha-cell ATP-dependent potassium channels to inhibit glucagon release. Diabetes 54: 1808–1815.
22. Bennett RG, Duckworth WC, Hamel FG (2000) Degradation of amylin by insulin-degrading enzyme. J Biol Chem 275: 36621–36625.
23. Bennett RG, Hamel FG, Duckworth WC (2003) An insulin-degrading enzyme inhibitor decreases amylin degradation, increases amylin-induced cytotoxicity, and increases amyloid formation in insulinoma cell cultures. Diabetes 52: 2315–2320.
24. Farris W, Mansourian S, Chang Y, Lindsley L, Eckman EA, et al. (2003) Insulin-degrading enzyme regulates the levels of insulin, amyloid beta-protein, and the beta-amyloid precursor protein intracellular domain in vivo. Proc Natl Acad Sci U S A 100: 4162–4167.
25. Parnaud G, Bosco D, Berney T, Pattou F, Kerr-Conte J, et al. (2008) Proliferation of sorted human and rat beta cells. Diabetologia 51: 91–100. 26. Boni-Schnetzler M, Thorne J, Parnaud G, Marselli L, Ehses JA, et al. (2008)
27. Marselli L, Thorne J, Ahn YB, Omer A, Sgroi DC, et al. (2008) Gene expression of purified beta-cell tissue obtained from human pancreas with laser capture microdissection. J Clin Endocrinol Metab 93: 1046–1053.
28. Lukowiak B, Vandewalle B, Riachy R, Kerr-Conte J, Gmyr V, et al. (2001) Identification and purification of functional human beta-cells by a new specific zinc-fluorescent probe. J Histochem Cytochem 49: 519–528.
29. Hochberg Y, Benjamini Y (1990) More powerful procedures for multiple significance testing. Stat Med 9: 811–818.
30. Fujita Y, Wideman RD, Asadi A, Yang GK, Baker R, et al. (2010) Glucose-dependent insulinotropic polypeptide is expressed in pancreatic islet alpha-cells and promotes insulin secretion. Gastroenterology 138: 1966–1975.
31. Ugleholdt R, Zhu X, Deacon CF, Orskov C, Steiner DF, et al. (2004) Impaired intestinal proglucagon processing in mice lacking prohormone convertase 1. Endocrinology 145: 1349–1355.
32. Gerken T, Girard CA, Tung YC, Webby CJ, Saudek V, et al. (2007) The obesity-associated FTO gene encodes a 2-oxoglutarate-dependent nucleic acid demethylase. Science 318: 1469–1472.
33. Church C, Lee S, Bagg EA, McTaggart JS, Deacon R, et al. (2009) A mouse model for the metabolic effects of the human fat mass and obesity associated FTO gene. PLoS Genet 5: e1000599.
34. Grunnet LG, Nilsson E, Ling C, Hansen T, Pedersen O, et al. (2009) Regulation and function of FTO mRNA expression in human skeletal muscle and subcutaneous adipose tissue. Diabetes 58: 2402–2408.
35. Tetsu O, McCormick F (1999) Beta-catenin regulates expression of cyclin D1 in colon carcinoma cells. Nature 398: 422–426.
36. Du J, Zhang L, Liu S, Zhang C, Huang X, et al. (2009) PPARgamma transcriptionally regulates the expression of insulin-degrading enzyme in primary neurons. Biochem Biophys Res Commun 383: 485–490.
37. Karaca M, Castel J, Tourrel-Cuzin C, Brun M, Geant A, et al. (2009) Exploring functional beta-cell heterogeneity in vivo using PSA-NCAM as a specific marker. PLoS One 4: e5555.
38. Katsuta H, Akashi T, Katsuta R, Nagaya M, Kim D, et al. (2009) Single pancreatic beta cells co-express multiple islet hormone genes in mice. Diabetologia 53: 128–138.
39. Poy MN, Hausser J, Trajkovski M, Braun M, Collins S, et al. (2009) miR-375 maintains normal pancreatic alpha- and beta-cell mass. Proc Natl Acad Sci U S A 106: 5813–5818.
40. Russ HA, Bar Y, Ravassard P, Efrat S (2008) In vitro proliferation of cells derived from adult human beta-cells revealed by cell-lineage tracing. Diabetes 57: 1575–1583.
41. Dunning BE, Gerich JE (2007) The role of alpha-cell dysregulation in fasting and postprandial hyperglycemia in type 2 diabetes and therapeutic implications. Endocr Rev 28: 253–283.
42. Deng S, Vatamaniuk M, Huang X, Doliba N, Lian MM, et al. (2004) Structural and functional abnormalities in the islets isolated from type 2 diabetic subjects. Diabetes 53: 624–632.