Rupak Bhattacharyya et al. (Eds) : ACER 2013,
pp. 33–45, 2013. © CS & IT-CSCP 2013 DOI : 10.5121/csit.2013.3204
Rupak Bhattacharyya
Department of Applied Science & Humanities, Global Institute of Management & Technology, Krishnagar- 741102, West Bengal, India
A
BSTRACTThis paper uses the concept of possibilistic risk aversion to propose a new approach for portfolio selection in fuzzy environment. Using possibility theory, the possibilistic mean, variance, standard deviation and risk premium of a fuzzy number are established. Possibilistic Sharpe ratio is defined as the ratio of possibilistic risk premium and possibilistic standard deviation of a portfolio. The Sharpe ratio is a measure of the performance of the portfolio compared to the risk taken. The higher the Sharpe ratio, the better the performance of the portfolio is and the greater the profits of taking risk. New models of fuzzy portfolio selection considering the possibilistic Sharpe ratio, return and skewness of the portfolio are considered. The feasibility and effectiveness of the proposed method is illustrated by numerical example extracted from Bombay Stock Exchange (BSE), India and is solved by multiple objective genetic algorithm (MOGA).
K
EYWORDSFuzzy portfolio selection problem, Possibilistic Sharpe ratio, Possibilistic risk premium, Utility function, Multiple objective genetic algorithm.
1.
I
NTRODUCTIONSince the Sharpe ratio has been derived in 1966 by William Sharpe [24], it has been one of the most referred risk/return measures used in finance, and much of this popularity can be attributed to its simplicity. The ratio's credibility has been boosted further when Professor Sharpe won a Nobel Memorial Prize in Economic Sciences in 1990. The Sharpe ratio is defined as the ratio between the risk premium and the standard deviation. It is a risk-adjusted measure of return that is often used to evaluate the performance of a portfolio. The ratio helps to make the performance of one portfolio comparable to that of another portfolio by making an adjustment for risk. The idea of the ratio is to see how much additional return you are receiving for the additional volatility of holding the risky asset over a risk-free asset - the higher the better. However, the problem with Sharpe ratio is the presence of standard deviation in the formula. The issue with this formula lies in its application to investments or securities that do not have normally distributed returns. Nevertheless, consideration of positively skewed returns can solve this problem.
In most of the research works on portfolio selection, the common assumptions are that the investor have enough historical data and that the situation of asset markets in future can be reflected with certainty by asset data in past. However, it cannot always be made with certainty. The usual feature of financial environment is uncertainty. Mostly, it is realized as risk uncertainty and is modelled by stochastic approaches. However, the term uncertainty has the second aspect- vagueness (imprecision or ambiguity) which can be modelled by fuzzy methodology. In this respect, to tackle the uncertainty in financial market, fuzzy, stochastic-fuzzy and fuzzy-stochastic methodologies are extensively used in portfolio modelling. By incurring fuzzy approaches quantitative analysis, qualitative analysis, experts’ knowledge and investors’ subjective opinions can be better integrated into a portfolio selection model. Authors like Konno and Suzuki [25], Leon et al. [26], Vercher [27], Bhattacharyya et al. [12] and others use fuzzy numbers to embody uncertain returns of the securities and they define the portfolio selection as a mathematical programming problem in order to select the best alternative. In possibilistic portfolio selection models, two types of approaches are noticed. The return of a security is considered either as a possibilistic variable or as a fuzzy number. In the later case, the possibilistic moments of the fuzzy numbers are considered. Possibilistic portfolio models integrate the past security data and experts’ judgment to catch variations of stock markets more plausibly. Tanaka and Guo [28] propose two kinds of portfolio selection models by utilizing fuzzy probabilities and exponential possibility distributions, respectively. Inuiguchi and Tanino [29] introduce a possibilistic programming approach to the portfolio selection problem under the minimax regret criterion. Lai
rate, risk and liquidity based on expected intervals. Terol et al. [45] formulate a fuzzy compromise programming to the mean-variance portfolio selection problem. Huang [46] proposes a mean-semivariance model for describing the asymmetry of fuzzy returns. Huang [47] extends the risk definition of variance and chance to a random fuzzy environment and formulates optimization models where security returns are fuzzy random variables.
In this paper, we have defined the possibilistic Sharpe ratio as the ratio between the possibilistic risk premium and possibilistic standard deviation. First, we have considered a bi-objective optimize problem that maximizes the possibilistic Sharpe ratio as well as the possibilistic skewness of the portfolio. As the Sharpe ratio prefers symmetric distribution, we maximize the skewness to get rid of this problem and to give more preference to positively skewed returns. We also have proposed six more models that represent different scenarios.
The construction of the paper is as follows. In section 2, the possibilistic mean, standard deviation, skewness and risk premium of fuzzy numbers are derived. The outcomes are used to define the possibilistic Sharpe ratio. In section 3, the portfolio selection models are modelled. In section 4, a multiple objective genetic algorithm is discussed. In section 5, an example is provided to illustrate the feasibility and effectiveness of the proposed model using stock price data in the form of triangular fuzzy numbers extracted from Bombay Stock exchange (BSE). Finally, in section 6, some conclusions are specified.
2.
P
OSSIBILISTICM
OMENTS ANDP
OSSIBILISTICR
ISKA
VERSIONPossibility theory is introduced by Zadeh [48] as an alternative to probability theory in the treatment of uncertainty. Fuzzy numbers represent a significant class of possibility distribution. The operations with fuzzy numbers can be done by Zadeh’s extension principle. Different authors have dealt with the notion of possibilistic moments of fuzzy numbers in different times. Dubois and Prade [49] propose the concept of interval-valued expectation of fuzzy numbers. Calsson and Fuller [50] define the possibilistic mean and variance of a fuzzy number where Fuller and Majlender [51] define the weighted possibilistic mean and variance of a fuzzy number. Liu and Liu [52] propose a definition of expected value of a fuzzy variable based on the possibilistic notion of credibility measure. Saeidifar and Pasha [53] define possibilistic moments of fuzzy numbers. Georgescu [54] proposes risk aversion by possibility theory and find out the risk premium by defining a new notion of possibilistic variance.
Definition 2.1 [54] Let Abe a fuzzy number. Also let its -level set [ A]α =[ a (1 α),a (2 α)]be such that a (1 α)≠a (2 α).The central value of [ A ]αis defined as
a (2 )
2 1
a (1 )
2 1
1 1
C([ A ] ) xdx ( a ( ) a ( )).
a ( ) a ( ) 2
= = +
−
α α
α α α
α α
Definition 2.2 [50] The expected value of a fuzzy numberAis defined by
1
2 1
0
E( A )= α[ a (α)+a (α)]d .α
1 1
2 2
1 1 2 2
0 0
1
2 2
1 2
0
Var( A)
POS[ A a ( )][a ( ) E( A)] d
POS[ A a ( )][a ( ) E( A)] d
=
([a ( ) E( A)]
[a ( ) E( A)] )d
α
α
α
α
α
α
α
α
α
α
=
≤
−
+
≥
−
−
+
−
Definition 2.4 The skewness of a fuzzy numberAis defined by
3 3
M ( A)
Skew( A)
,
( Var( A) )
=
where,
1 1
3 3
3 1 1 2 2
0 0
1
3 3
1 2
0
M ( A)
POS[ A a ( )][ a ( ) E( A)] d
POS[ A a ( )][ a ( ) E( A)] d
=
([ a ( ) E( A)]
[ a ( ) E( A)] )d .
=
≤
−
+
≥
−
−
+
−
α
α
α
α
α
α
α
α
α
α
Definition 2.5 [54] The possibilistic risk premium ρA=ρA, uassociated with the fuzzy number
A
and the utility function u is defined by,A
u( E( A )−ρ )=E( u( A )).
Let us assume that the utility function u is twice differentiable, strictly concave and increasing. Then the possibilistic risk premium
ρ
A has the formA
1 u ( E( A )) V ( A ) , 2 u ( E( A ))
′′ ≈ −
′
ρ
where,
a ( )
1 2
2
2 1
0 a (1 )
1
2 2
2 1 2 1
0 1
2 2
2 2 1 1 2 1
0
1
V( A) 2 ( x E( A)) dx d
a ( ) a ( )
2
= ( a ( ) E( A)) ( a ( ) E( A)) ( a ( ) E( A))( a ( ) E( A)) d
3
2
= ( a ( ) a ( )a ( ) a ( )) d 3E( A) ( a ( ) a ( )) d
3
α
α
α α
α
α
α
α
α
α
α α
α
α
α
α α α
α
α α
= − − − + − + − − + + − + 1 1 2 0 0 1
2 2 2
2 2 1 1
0
3E ( A) d
2
= ( a ( ) a ( )a ( ) a ( )) d E ( A).
3
α
α α
α
α
α
α α α
+
+ + −
Exponential utility of the form u x( )= −1 eκx
is unique in exhibiting constant absolute risk aversion (CARA) and has been used successfully in portfolio selection problem. In this literature, we consider the utility function as u(x) = 1 − e− 2x. Then we have,
2 x 2 x u ( E( A )) 4e
2; u ( E( A )) 2e
−
−
′′ −
= = −
′
so that, ρA≈V ( A ).
Definition 2.6 We define the possibilistic Sharpe ratio (PSR) of a fuzzy numberA as,
A V ( A )
PSR( A ) .
Var( A ) Var( A )
= ρ =
Example 2.7 Let A=( a,b,c )be a triangular fuzzy number. Then we have,
2 2 2
3 3 3 2 2 2
2 2 2 3
2 2 2
A
2 2 2
2 2
a 4b c
E( A)
,
6
1
Var( A)
[ a + b + c
ab bc ca],
18
[19(a
c ) 8b
42b( a
c ) (12b
15ac)(a c) 60abc]
Skew( A)
,
10 2( a + b + c
ab bc ca )
1
[a + 2b + c
2ab 2bc],
36
a + 2b + c
2ab 2bc
PSR
6 2 a + b + c
+
+
=
=
−
−
−
+
−
−
+
+
−
+
+
=
−
−
−
=
−
−
−
−
=
ρ
2
.
ab bc ca
−
−
−
The results are obtained by definitions 2.2, 2.3, 2.4, 2.5 and 2.6.
3.
P
OSSIBILISTIC PORTFOLIO SECTION MODELLet for i = 1, 2, …, n,
xi= the portion of the total capital invested in security i; i
p =fuzzy number representing the closing price of the ith security at present;
' i
p =fuzzy number representing the estimated closing price of the ith security for the next year;
di= fuzzy number representing the estimated dividend of the ith security for the next year;
i
r =fuzzy number representing the return of the ith security
'
i i i i p + d p
= .
p −
1 1 2 2 n n 1 1 2 2 n n
1 1 2 2 n n n
i i 1
i
Maximize PSR[r x r x .... r x ] Maximize Skew[r x r x .... r x ] subject to
E[r x r x .... r x ] ( 3.1 )
x 1
x 0,i 1,2,...,n.
α = + + + + + + + + + ≥ = ≥ =
The constraint E[r x1 1+r x2 2+.... r x ]+ n n ≥αensures that the expected return of the portfolio is no less than a minimum desired value . The second constraint
n i i 1
x 1
=
= is the well-known
capital budget constraint on the assets. The last constraint
[
xi≥0 i∀]
ensures that no short selling is allowed in the portfolio here.Note: The following models (3.2), (3.3), (3.4), (3.5), (3.6), (3.7) can also be considered by the investors depending on their priorities.
1 1 2 2 n n
1 1 2 2 n n
1 1 2 2 n n n
i i 1
i
Maximize PSR[r x
r x
.... r x ]
Maximize E[r x
r x
.... r x ]
subject to
Skew[r x
r x
.... r x ]
( 3.2 )
x
1
x
0,i 1,2,...,n.
β
=+
+
+
+
+
+
+
+
+
≥
=
≥
=
1 1 2 2 n n
1 1 2 2 n n 1 1 2 2 n n n
i i 1
i
Maximize Skew[r x r x .... r x ] subject to
E[r x r x .... r x ] PSR[r x r x .... r x ] ( 3.3 )
x 1
x 0,i 1,2,...,n.
α γ = + + + + + + ≥ + + + ≥ = ≥ =
1 1 2 2 n n
1 1 2 2 n n
1 1 2 2 n n n
i i 1
i
Maximize PSR[r x r x .... r x ]
subject to
E[r x r x .... r x ]
Skew[r x r x .... r x ]
( 3.4 )
x 1
x 0,i 1,2,...,n.
1 1 2 2 n n
1 1 2 2 n n
1 1 2 2 n n
n i i 1
i
Maximize E[r x r x .... r x ] subject to
PSR[r x r x .... r x ] Skew[r x r x .... r x ] ( 3.5 )
x 1
x 0 ,i 1,2 ,...,n.
γ β = + + + + + + ≥ + + + ≥ = ≥ = and
1 1 2 2 n n 1 1 2 2 n n
1 1 2 2 n n n
i i 1
i
Maximize PSR[r x r x .... r x ] Maximize E[r x r x .... r x ] Maximize Skew[r x r x .... r x ] subject to
( 3.6 )
x 1
x 0,i 1,2,...,n.
= + + + + + + + + + = ≥ =
where the values of , , would be specified by the investors according to their needs.
Theorem 3.1 Suppose r = (a , b , c ), [i=1,2,...,n]i i i i are independent triangular fuzzy numbers. Then the model (3.1) generates the multi-objective programming problem model (3.8).
2 2 2
n n n n n
i i i i i i i i i i
i = 1 i = 1 i = 1 i = 1 i = 1
n n n
i i i i i i
i = 1 i = 1 i = 1
1
M a xim ize a x + b x + c x a x b x 6 2
b x c x c x
( 3 .7 )
−
− −
1
2 2
n 2 n n
i i i i i i
i = 1 i = 1 i = 1
2
n n n n n
i i i i i i i i i i
i = 1 i = 1 i = 1 i = 1 i = 1
a x a x + 2 b x
+ c x 2 a x b x 2 b x c x
−
− −
2 2 2
n n n n n
i i i i i i i i i i
i = 1 i = 1 i = 1 i = 1 i = 1
n n n
i i i i i i
i = 1 i = 1 i = 1
1
M a xim ize a x + b x + c x a x b x 1 0 2
b x c x c x
−
− −
3
3 3
n 2 n n
i i i i i i
i = 1 i = 1 i = 1
3 2
n n n n
i i i i i i i i
i = 1 i = 1 i = 1 i = 1
a x 1 9 a x c x
8 b x 4 2 b x a x c x
−
+
− − +
2
2
n n n n n
i i i i i i i i i i
i = 1 i = 1 i = 1 i = 1 i = 1
n n
i i i i
i = 1 i = 1
1 2 b x 1 5 a x c x a x c x
+ 6 0 a x b x
+
− +
n i i i = 1
n n n n
i i i i i i i i
i = 1 i = 1 i = 1 i 1
c x s u b ject to
1
a x + 4 b x + c x , x 1, x 0 ,i 1, 2 ,..., n .
Proof: Since r = (a , b , c )i i i i are triangular fuzzy numbers, by extension Principle of Zadeh it follows that
n n n
1 1 2 2 n n i i i i i i
i = 1 i = 1 i = 1
r x +r x +.... r x = + a x , b x , c x , which is also a fuzzy number. Combining this with the results obtained in example 2.7, we are with the theorem.
4.
M
ULTIPLEO
BJECTIVEG
ENETICA
LGORITHMThe proposed portfolio selection model (3.7) is solved by using Multiple Objective Genetic Algorithm (MOGA). The MOGA proposed by Bhattacharyya et al. [55] is followed.
The following are followed for the development of the MOGA for the proposed model (3.7).
Representation: An n-dimensional real vector X = {x1, x2, …, xn} is used to represent a solution where each xi∈[ 0,1], i =1, 2,..., n.
Initialization: L such solutions X1, X2, …, XL are randomly generated such that each of them satisfies the constraints of the model. This solution set is the set P.
Cross Over and Mutation: Crossover operator is mainly responsible for the search of new strings. Crossover operates on two parent solutions at a time and generates offspring solutions by recombining both parent solution features. After selection of chromosomes for new population, the crossover operator is applied. Here the arithmetic cross over is used. Mutation is the unary operation by which genes present in a chromosome are changed. Here the usual mutation procedure is followed.
Proposed multi-objective genetic algorithm has the following two important components:
(a) Consider a population P of feasible solutions of (3.7) of size L. We like to partition P into subsets F1, F2, ..., Fk, such that every subset contain non-dominated solutions, but every solutions of Fi are not dominated by any solution of Fi+1, for i = 1,2,..., k-1. Let the number of solutions of P which dominate x is nx and the set of solutions of P that are dominated by x is Sx. Note that, as there are two objective functions, these require O(2L2) computations.
(b) To determine the distance of a solution from other solutions of a subset first sort the subset according to each objective function values in ascending order of magnitude. For both objective functions, the boundary solutions are assigned an infinite distance value (a large value). All other intermediate solutions are assigned a distance value for the objective, equal to the absolute normalized difference in the objective values of two adjacent solutions. The overall distance of a solution from others is calculated as the sum of individual distance values corresponding to each objective.
For detailed discussions on ‘the division of P(T) into disjoint subsets having non-dominated solutions’ and ‘distance of a solution of subset F from other solutions’, Roy et al. [56] can be consulted.
Using the above two operations proposed multi-objective genetic algorithm is formulated as:
1. Set probability of crossover Pc and probability of mutation Pm. 2. Set iteration counter T =1.
3. Generate initial population set of solution P(T) of size L. 4. Select solution P(T) for crossover and mutation.
5. Made crossover and mutation on selected solution and get the child set C(T). 6. Set P1=P( T ) C( T ).
7. Divide P1 into disjoint subsets having non-dominated solutions. Let these sets be F1, F2, ..., Fk. 8. Let P2 =F1 F2 ... F .n Select maximum integer L such that O( P )2 ≤L.
9. If O(P2) < L sort solutions of Fn+1 in descending order of their distance from other solutions of the subset. Then select first L - O(P2) solutions from Fn+1and add with P2.
10. Set T = T + 1 and P(T) = P2.
11. Go to step-4 if termination condition does not hold. 12. Output: P(T)
13. End algorithm.
Since in the above algorithm computational complexity of step-7 is O(2L2), step-9 is O(2NlogN)
and other steps are O(N), so overall time complexity of the algorithm is O(2N2).
In this MOGA, selection of new population after crossover and mutation on old population is done by creating a mating pool by combining the parent and offspring population and among them best L solutions are taken as solutions of new population. By this way, elitism is introduced in the algorithm.
5.
C
ASE STUDY:
B
OMBAYS
TOCKE
XCHANGEIn this section we apply our portfolio selection model on the data set extracted from Bombay stock exchange (BSE). Bombay Stock Exchange is the oldest stock exchange in Asia with a rich heritage of over 133 years of existence. What is now popularly known as BSE was established as "The Native Share & Stock Brokers' Association" in 1875. It is the first stock exchange in India which obtained permanent recognition (in 1956) from the Government of India under the Securities Contracts (Regulation) Act (SCRA) 1956. Today, BSE is the world's number 1
exchange in terms of the number of listed companies and the world's 5th in handling of transactions through its electronic trading system. The companies listed on BSE command a total market capitalization of USD Trillion 1.06 as of July, 2009. The BSE Index, SENSEX, is India's first and most popular stock market benchmark index. Sensex is tracked worldwide. It constitutes
30 stocks representing 12 major sectors. It is constructed on a 'free-float' methodology, and is sensitive to market movements and market realities. Apart from the SENSEX, BSE offers 23
indices, including 13 sectoral indices.
Table 5.1 Stocks and their returns
Company Return (ri)
Reliance Energy (RE) (-0.008, 0.031,0.067) Larsen and Toubro (LT) (-0.003, 0.043, 0.087) Tata Steel (TS) (0.009, 0.030, 0.052) Bharat Heavy Electricals Limited (BH) (-0.002, 0.036, 0.083) State Bank if India (SB) (-0.010, 0.033, 0.079)
With respect to the above data, we consider the following portfolio selection model:
1 1 2 2 3 3 4 4 5 5 1 1 2 2 3 3 4 4 5 5
1 1 2 2 3 3 4 4 5 5 1 2 3 4 5
1 2 3 4 5
Maximize PSR[r x r x r x r x r x ] Maximize Skew[r x r x r x r x r x ] subject to
( 5.1 )
E[r x r x r x r x r x ] 0.04 x ,x ,x ,x ,x 0
x +x +x +x +x 1
+ + + +
+ + + +
+ + + + ≥
≥ =
We apply theorem 3.1 to convert model (5.1) into the deterministic model (3.7). To solve it, the proposed MOGA is used. The cross over and mutation probabilities are chosen as 0.6 and 0.2
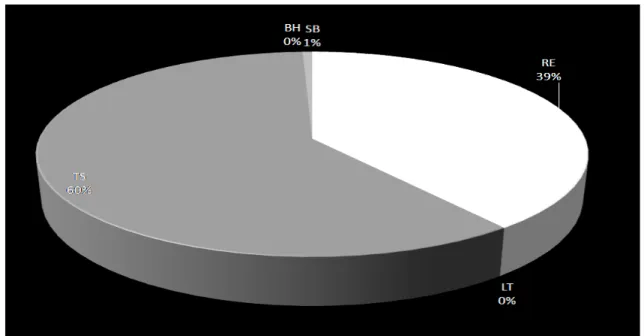
respectively. The number of iterations is 100. The solution is obtained as shown in Table 5.2. Table 5.2 Portfolio
x1 x2 x3 x4 x5
0.3936170 0.00000 0.00000 0.6000000 0.00638296
Table 5.2 shows that the investor should invest 39.36%, 60% and 0.64% of the total money in the
1st, 4th and 5th stocks. The portfolio is explained via the pie chart given in Figure 5.2.
6.
C
ONCLUSIONSIn this paper, a new framework of fuzzy portfolio selection is introduced. Instead of following the return-risk framework, this work concentrates on the risk-aversion nature of the investors and set up a possibilistic Sharpe ratio –skewness portfolio selection problem. To do so, the possibilistic Sharpe ratio is defined. As the Sharpe ratio prefers symmetric distribution, we consider skewness to get rid of this drawback. The model is tested on a data set collected from BSE.
In near future, we will apply these portfolio selection models and solution method to other asset allocation problems, combinational optimization models and multi-period problems to find optimal investment strategy under complex market situations. Some other algorithms such as ACO (ant colony optimization), PSO (particle swarm optimization), VEGA (vector evaluation genetic algorithm), NEGA (Nondominated sorting genetic algorithm), NPGA (Niched Pareto genetic algorithm) and PAES (Pareto archived evolution strategy) may be employed to solve the problem, especially when the data set is significantly large.
R
EFERENCES[1] H. Markowitz, Portfolio selection, Journal of Finance 7(1952) 77–91.
[2] T. Lai, Portfolio selection with skewness: a multiple – objective approach, Review of the Quantitative Finance and Accounting 1 (1991) 293-305.
[3] H. Konno, H. Shirakawa, A mean- absolute deviation-skewness portfolio optimization model, Annals of Operations Research 45 (1993) 205-220.
[4] H. Konno, K. Suzuki, A mean-variance-skewness optimization model, Journal of the Operations Research Society of Japan 38 (1995) 137- 187.
[5] P. Chunhachinda, P. Dandapani, S. Hamid, A. J. Prakash, Portfolio selection and skewness: evidence from international stock markets, Journal of Banking and Finance 21 (1997) 143–167.
[6] S. C. Liu, S. Y. Wang, W. H. Qiu, A mean- variance- skewness model for portfolio selection with transaction costs, International Journal of System Science 34 (2003) 255- 262.
[7] A. J. Prakash, C. Chang, T. E. Pactwa, Selecting a portfolio with skewness: recent evidence from US, European and Latin American equity markets, Journal of Banking and Finance 27 (2003) 1375- 1390. [8] W. Briec, K. Kerstens, O. Jokung, Mean-variance- skewness portfolio performance gauging: a general
shortage function and dual approach, Management Science 53 (2007) 135- 149.
[9] L. Yu, S. Y. Wang, K. Lai, Neural network based mean- variance-skewness model for portfolio selection, Computers and Operations Research 35 (2008) 34 – 46.
[10] R. Bhattacharyya, M. B. Kar, S. Kar, D. Dutta Majumder, Mean- entropy- skewness fuzzy portfolio selection by credibility theory approach, In: S. Chaudhury et al. (Eds.): PReMI 2009. LNCS 5909, pp- 603–608, 2009.
[11] Bhattacharyya, R.; Kar, S. Possibilistic mean-variance-skewness portfolio selection models. International Journal of Operations Research 8 (2011) 44 – 56.
[12] R. Bhattacharyya, S. Kar, D. Dutta Majumder, Fuzzy mean–variance–skewness portfolio selection models by interval analysis, Computers and Mathematics with Applications 61 (2011) 126-137. [13] A. Chatterjee, R. Bhattacharyya, S. Mukherjee, S. Kar, Optimization of mean-semivariance-skewness
portfolio selection model in fuzzy random environment, In: ICOMOS 2010, American Institute of Physics conference proceedings, pp- 516-521.
[14] H. Markowitz, Portfolio selection: efficient diversification of investments, New York: Wiley, 1959. [15] A. D. Roy, Safety first and the holding of assets, Econometrics 20 (1952), 431– 449.
[16] G. Castellacci, M. J. Siclari, The practice of delta–gamma VaR: implementing the quadratic portfolio model, European Journal of Operational Research 150 (2003) 529–545.
[17] J. Philippe, Value at risk: the new benchmark for controlling market risk, Irwin Professional Publishing, Chicago, 1996.
[19] G. C. Philippatos, N. Gressis, Conditions of equivalence among E–V, SSD, and E–H portfolio selection criteria: The case for uniform, normal and lognormal distributions, Management Science 21 (1975) 617–625.
[20] D. N. Nawrocki, W. H. Harding, State-value weighted entropy as a measure of investment risk, Applied Economics 18 (1986) 411–419.
[21] M. R. Simonelli, Indeterminacy in portfolio selection, European Journal of Operational Research 163 (2005) 170-176.
[22] X. Huang, Mean-entropy models for fuzzy portfolio selection, IEEE Transactions on Fuzzy Systems 16(2008) 1096–1101.
[23] Z. Qin, X. Li, X. Ji, Portfolio selection based on fuzzy cross-entropy, Journal of Computational and Applied Mathematics, 228(2009) 188- 196.
[24] W. F. Sharpe, Mutual fund performance, Journal of Business, 39 (1966) 119 – 138.
[25] H. Konno, K. Suzuki, A mean-variance-skewness optimization model, Journal of the Operations Research Society of Japan 38 (1995) 137- 187.
[26] T. Leon, V. Liern, E. Vercher, Viability of infeasible portfolio selection problems: a fuzzy approach, European Journal of Operational Research 139 (2002) 178-189.
[27] E. Vercher, J. D. Bermudez, J. V. Segura, Fuzzy portfolio optimization under downside risk measures, Fuzzy Sets and Systems 158(2007) 769 – 782.
[28] H. Tanaka, P. Guo, Portfolio selection based on upper and lower exponential possibility distributions, European Journal of Operational Research 114(1999) 115 – 126.
[29] M. Inuiguchi, T. Tanino, Portfolio selection under independent possibilistic information, Fuzzy Sets and Systems 115(2000) 83–92.
[30] K. K. Lai, S. Y. Wang, J. P. Xu, S. S. Zhu, Y. Fang, A class of linear interval programming problems and its application to portfolio selection, IEEE Transactions on Fuzzy Systems 10(2002) 698–704. [31] S. Y. Wang, S. S. Zhu, On fuzzy portfolio selection problems, Fuzzy Optimization and Decision
Making 1(2002) 361- 377.
[32] S. Giove, S. Funari, C. Nardelli, An interval portfolio selection problems based on regret function, European Journal of Operational Research 170(2006) 253–264.
[33] M. Ida, Solutions for the portfolio selection problem with interval and fuzzy coefficients, Reliable Computing 10(2004) 389–400.
[34] C. Carlsson, R. Fuller, P. Majlender, A possibilistic approach to selecting portfolios with highest utility score, Fuzzy Sets and Systems 131(2002) 13–21.
[35] Y. Fang, K. K. Lai, S. Y. Wang, Portfolio rebalancing model with transaction costs based on fuzzy decision theory, European Journal of Operational Research 175(2006) 879– 893.
[36] X. Wang, W. J. Xu, W. G. Zhang, M. L. Hu, Weighted possibilistic variance of fuzzy number and its application in portfolio theory, Lecture Notes in Artificial Intelligence 3613(2005) 148–155.
[37] W. G. Zhang, Y. L. Wang, Portfolio selection: possibilistic mean-variance model and possibilistic efficient frontier, Lecture Notes in Computer Science 3521(2005) 203–213.
[38] V. Lacagnina, A. Pecorella, A stochastic soft constraints fuzzy model for a portfolio selection problem, Fuzzy Sets and Systems 157(2006) 1317–1327.
[39] C. Lin, B. Tan, P. J. Hsieh, Application of the fuzzy weighted average in strategic portfolio management, Decision Sciences 36(2005) 489–511.
[40] X. Huang, Two new models for portfolio selection with stochastic returns taking fuzzy information, European Journal of Operational Research 180(2007) 396–405.
[41] W. Fei, Optimal consumption and portfolio choice with ambiguity and anticipation, Information Sciences 177(2006) 5178– 5190.
[42] W. G. Zhang, Y. L. Wang, Z. P. Chen, Z. K. Nie, Possibilistic mean-variance models and efficient frontiers for portfolio selection problem, Information Sciences 177(2007) 2787-2801.
[43] J. Li, J. Xu, A class of possibilistic portfolio selection model with interval coefficients and its application, Fuzzy Optimization and Decision Making 6(2007) 123–137.
[44] M. A. Parra, A. B. Terol, M. R. Urfa, A fuzzy goal programming approach to portfolio selection, European Journal of Operational Research 133(2001) 287- 297.
[45] A. B. Terol, B. P. Gladish, M. A. Parra, M. R. Urfa, Fuzzy compromise programming for portfolio selection, Applied Mathematics and Computation 173(2006) 251 – 264.
[46] X. Huang, Mean-semivariance models for fuzzy portfolio selection, Journal of Computational and Applied Mathematics 217(2008), 1–8.
[48] L. A. Zadeh, Fuzzy sets as a basis for a theory of possibility, Fuzzy Sets and Systems 1 (1978) 3–28. [49] D. Dubois, H. Prade, The mean value of a fuzzy number, Fuzzy Sets and Systems 24 (1987) 279–300. [50] C. Carlsson, R. Fuller, On possibilistic mean value and variance of fuzzy numbers, Fuzzy Sets and
Systems 122 (2001) 315–326.
[51] R. Fuller, P. Majlender, On weighted possibilistic mean and variance of fuzzy numbers, Fuzzy Sets and Systems 136 (2003) 363–374.
[52] B. Liu, Y. K. Liu, Expected value of fuzzy variable and fuzzy expected value models, IEEE Transactions on Fuzzy Systems 10 (2002) 445-450.
[53] A. Saeidifar, E. Pasha, The possibilistic moments of fuzzy numbers and their applications, Journal of Computation and Applied Mathematics 223(2009) 1028 – 1042.
[54] I. Georgescu, Possibilistic risk aversion, Fuzzy Sets and Systems 160 (2009) 2608 – 2619.
[55] R. Bhattacharyya, P. Kumar, S. Kar, Fuzzy R&D portfolio selection of interdependent projects, Computers and Mathematics with Applications 62 (2011) 3857–3870.
[56] A. Roy, S. Kar, M. Maiti, A deteriorating multi-item inventory model with fuzzy costs and resources based on two different defuzzification techniques, Applied Mathematical Modelling 32 (2008) 208 – 223.
AUTHORS
Dr. Rupak Bhattacharyya is presently working as an Associate Professor in Mathematics and HOD in the Department of Applied Science & Humanities of Global Institute of Management & Technology, Krishnagar, West Bengal, India. Dr. Bhattacharyya received his PhD degree from National Institute of Technology, Durgapur. The Operational Research Society of India confers the Professor M N Gopalan Award on Dr. Bhattacharyya for the best Doctoral Thesis in Operational Research of 2011. He has more than eight years of teaching and research experience. He has more than 20 International