ACPD
10, 14209–14239, 2010Occurrence of gas phase ammonia in the area of Beijing
A. Ianniello et al.
Title Page
Abstract Introduction
Conclusions References
Tables Figures
◭ ◮
◭ ◮
Back Close
Full Screen / Esc
Printer-friendly Version Interactive Discussion
Discussion
P
a
per
|
Dis
cussion
P
a
per
|
Discussion
P
a
per
|
Discussio
n
P
a
per
|
Atmos. Chem. Phys. Discuss., 10, 14209–14239, 2010 www.atmos-chem-phys-discuss.net/10/14209/2010/ doi:10.5194/acpd-10-14209-2010
© Author(s) 2010. CC Attribution 3.0 License.
Atmospheric Chemistry and Physics Discussions
This discussion paper is/has been under review for the journal Atmospheric Chemistry and Physics (ACP). Please refer to the corresponding final paper in ACP if available.
Occurrence of gas phase ammonia in the
area of Beijing (China)
A. Ianniello1, F. Spataro1, G. Esposito1, I. Allegrini1, E. Rantica1, M. P. Ancora1, M. Hu2, and T. Zhu2
1
CNR - Institute of Atmospheric Pollution Research, Via Salaria Km 29.3, CP10, 00015 Monterotondo S., Rome, Italy
2
State Key Joint Laboratory for Environmental Simulation and Pollution Control, College of Environmental Sciences and Engineering, Peking University, Beijing, China
Received: 6 May 2010 – Accepted: 27 May 2010 – Published: 9 June 2010 Correspondence to: A. Ianniello ([email protected])
ACPD
10, 14209–14239, 2010Occurrence of gas phase ammonia in the area of Beijing
A. Ianniello et al.
Title Page
Abstract Introduction
Conclusions References
Tables Figures
◭ ◮
◭ ◮
Back Close
Full Screen / Esc
Printer-friendly Version Interactive Discussion
Discussion
P
a
per
|
Dis
cussion
P
a
per
|
Discussion
P
a
per
|
Discussio
n
P
a
per
|
Abstract
The atmospheric concentrations of gaseous ammonia have been measured during two field campaigns in the winter and in the summer of 2007 at Beijing (China). These mea-surements were carried out by means of diffusion annular denuders coated with phos-phorous acid. The results were discussed from the standpoint of seasonal and diurnal
5
variations and meteorological effects. The daily average NH3 concentrations were in the range of 0.20–44.38 µg/m3and showed regular seasonal variations with higher con-centrations during summer and with lower during winter. The seasonal trends seemed to be largely affected by air temperature because of agricultural sources. No diurnal variability was observed for gaseous NH3levels in both winter and summer seasons.
10
The highest ammonia value of 105.67 µg/m3was measured in the early morning during the summer period when stable atmospheric conditions occurred. The diurnal winter and summer trends of ammonia were nearly independent on the air temperatures but they were affected by wind direction suggesting a strong local source influences. Am-monia was also correlated with the atmospheric mixing in the boundary layer, and, with
15
NOx and CO air concentrations supporting the hypothesis that the traffic may be also an important source of ammonia in Beijing.
1 Introduction
Gaseous ammonia (NH3) is the third most abundant nitrogen containing compound and is the primary alkaline trace gas in the atmosphere. The importance of ammonia
20
in urban area is related to its role as a precursor for secondary aerosols (Erisman and Schaap, 2004). It neutralizes atmospheric acids such as nitric acid (HNO3), hydrochlo-ric acid (HCl) and sulphuhydrochlo-ric acid (H2SO4), formed by oxidation of nitrogen oxides (NOx) and sulphur dioxide (SO2), respectively (Krupa, 2003), thereby affecting the acidity of cloud water and aerosols (Heeb et al., 2006; Roelle and Aneja, 2002). The
reac-25
ACPD
10, 14209–14239, 2010Occurrence of gas phase ammonia in the area of Beijing
A. Ianniello et al.
Title Page
Abstract Introduction
Conclusions References
Tables Figures
◭ ◮
◭ ◮
Back Close
Full Screen / Esc
Printer-friendly Version Interactive Discussion
Discussion
P
a
per
|
Dis
cussion
P
a
per
|
Discussion
P
a
per
|
Discussio
n
P
a
per
|
main chemical sink for ammonia in the atmosphere is the reaction with H2SO4, yielding ammonium sulphate [(NH4)2SO4] and ammonium bisulphate [NH4HSO4] salts. Reac-tions with HNO3 and HCl yield ammonium nitrate (NH4NO3) and ammonium chloride (NH4Cl) salts in particulate phase. These NH+4 aerosols contribute significantly to fine particle mass (size<2.5 µm) and have implications for human health (Brunekreef and
5
Holgate, 2002). They limit atmospheric visibility and global radiation budgets (Horvat, 1992; Sutton et al., 1994).
The most recent consideration for NH3emissions on the global scale is concerning with the climate change. NH3 has a relatively short residence time of about 1 to 5 d. When airborne, it is either readily converted to ammonium aerosols, due to their
ex-10
tended lifetime (about 1–15 d), these particles may be transported far from the pollutant sources (Aneja et al., 2001) causing consequences to remote sensitive ecosystems as well as transboundary air pollution (Krupa, 2003). In fact, after deposition, NH+4 aerosols can contribute to acidification and eutrophication of sensitive habitats, with consequent changes in soil, plant and animal communities (Sutton et al., 1993;
Fang-15
meier et al., 1994). Thus, since NH3 is either readily converted to NH+4 or subjected to dry deposition, high concentrations are expected only close to the surface and near to emission sources (Ferm, 1998). Although the main source of atmospheric ammonia is agriculture, other sources include industries, landfills, household products, biomass burning, motor vehicles, and wild animals.
20
Only few studies on ammonia emissions in China are available. The total NH3 emis-sion from China exceeds that from Europe by at least 27% (Zhao and Wang, 1994). About 80% of NH3emission in China is from agriculture. This is the distinguishing fea-ture which is different from developed countries. In China, the biggest contributors are livestock (which contributes about 30%–60%) and the application of nitrogenous
fertil-25
ACPD
10, 14209–14239, 2010Occurrence of gas phase ammonia in the area of Beijing
A. Ianniello et al.
Title Page
Abstract Introduction
Conclusions References
Tables Figures
◭ ◮
◭ ◮
Back Close
Full Screen / Esc
Printer-friendly Version Interactive Discussion
Discussion
P
a
per
|
Dis
cussion
P
a
per
|
Discussion
P
a
per
|
Discussio
n
P
a
per
|
al., 2003; Goebes et al., 2003). The characteristics of agricultural sources determine the temporal and spatial NH3distribution in many locations. The ammonia concentra-tion in northern cities of China is relatively high during the spring and summer period due to farming, while in southern cities no obvious seasonal variation occurs because farmland is extended during all four seasons.
5
In addition to NH3, the relative humidity, the temperature, and the insolation are also important factors influencing the formation, temporal and spatial distribution of secondary particles. But the interactions between these factors are so complex that no uniform result is forthcoming. According to studies of the ammonia level in China, in Beijing, some research has shown that the concentration of secondary particles are
10
higher in the winter probably due to the high SO2emissions and low wind speed, which aid the formation of SO2−
4 . Another study has shown that summer has the highest
secondary particle concentration, because of the large NH3 emissions and sufficient temperature and humidity to ensure the oxidation of SO2 to SO24− (He et al., 2001, 2002).
15
The contribution of vehicles to non-agricultural NH3emissions has been considered to be negligible up to 1995 (Sutton et al., 1995). Recent studies, however, show that ammonia concentration in urban environments has also increased due to over-reduction of nitrogen oxide compounds in catalytic converters in automobiles exhaust and industrial and power station control systems (Sutton et al., 2000). From
measure-20
ments in a roadway tunnel, Fraser and Cass (1998) concluded that the contribution of motor vehicle emissions had risen from 2% to 15% of the total ammonia emission in the Los Angeles area since the introduction of catalysts. Road side measurements in the UK, in the USA and Europe have shown strong links between ammonia emissions and traffic (Kean et al., 2000; Kirchner et al., 2002; Perrino et al., 2002; Cape et al.,
25
2004). Perrino et al. (2002) found a close link between ammonia and CO emissions in a series of experiments conducted in Rome. These results indicated that petrol-engine vehicles constitute a major source of urban ammonia.
ACPD
10, 14209–14239, 2010Occurrence of gas phase ammonia in the area of Beijing
A. Ianniello et al.
Title Page
Abstract Introduction
Conclusions References
Tables Figures
◭ ◮
◭ ◮
Back Close
Full Screen / Esc
Printer-friendly Version Interactive Discussion
Discussion
P
a
per
|
Dis
cussion
P
a
per
|
Discussion
P
a
per
|
Discussio
n
P
a
per
|
years. Long-term measurements have shown strong daily and seasonal variations in ammonia concentrations which depend mainly on temperature, relative humidity (RH), rainfall, and winds (Yamamoto et al., 1988, 1995; Lee D. S. et al., 1999; Bari et al., 2003; Vogt et al., 2005). Bimodal diurnal variations in NH3 concentrations with peaks occurring during periods of peak traffic have been observed in some studies (Kirchner
5
et al., 2002; Perrino et al., 2002; Li et al., 2006), confirming vehicles as a significant source of NH3. Data about ammonia concentrations in the urban areas of China, es-pecially of Beijing, are very rare. Median ammonia concentrations ranged from 20 to 1 ppb on a monthly basis according to measurements carried out in Asia (Carmichael et al., 2003). Yao et al. (2003) measured NH3 concentrations in Beijing in summer
10
2001 and spring 2002. The concentrations were found from 4.6 to 42.4 µg/m3with the highest concentration detected in July. Recent real-time measurements of ammonia were conducted in the Pearl River Delta, China, from 4 October to 4 November 2004 (Hu et al., 2008). During this study the average concentration of NH3was 7.3 µg/m3.
With increasing concern over the potential environmental damage caused by
at-15
mospheric transport and subsequent deposition of NH3, it is very important to have reliable methods to accurately monitor its pollution level and emission pattern. Such information may then be used effectively to develop potential abatement strategies for NH3.
Sampling of NH3is difficult because it is easily adsorbed on surfaces and is difficult to
20
separate and discriminate from volatile ammonium salts. Annular denuder techniques are considered to be able to overcome these critical sources of error. In general, such systems are designed with a vertically positioned denuder tube to eliminate the sedi-mentation of particles (Possanzini et al., 1983; Allegrini et al., 1987, 1999; Febo et al., 1989; Perrino et al., 1990). This sampling technique is able to accurately determine
25
gaseous ammonia and particulate ammonium without disturbing the partition existing in the atmosphere at the time of the sampling and without mutual interferent (Perrino et al., 1999, 2002).
concen-ACPD
10, 14209–14239, 2010Occurrence of gas phase ammonia in the area of Beijing
A. Ianniello et al.
Title Page
Abstract Introduction
Conclusions References
Tables Figures
◭ ◮
◭ ◮
Back Close
Full Screen / Esc
Printer-friendly Version Interactive Discussion
Discussion
P
a
per
|
Dis
cussion
P
a
per
|
Discussion
P
a
per
|
Discussio
n
P
a
per
|
trations carried out during 2007 in Beijing, China, by using annular denuder based methods. The data are analyzed and presented here to investigate the daily and sea-sonal variations in ammonia concentrations and also to examine the contribution of traffic to ammonia levels in Beijing. The study is a part of a Sino-Italian collaboration project (Blue Sky of Beijing: Research on Regional Air Pollution Project) and also part
5
of the international collaborative research CAREBEIJING (Campaigns of Air Quality Research in Beijing and Surrounding Region).
2 Experimental
Measurements were carried out in the campus of Peking University, located at North of Beijing (39◦59′23′′N, 116◦18′19′′E), not very far from Olympic sites in winter, from 23
10
January to 14 February 2007, and in summer, from 2 to 31 August 2007. The atmo-spheric ammonia concentrations were determined by means annular diffusion denud-ers coated with a solution of 1% phosphorous acid in 1:9 water and ethanol (Perrino and Gherardi, 1999) on a 24-h basis starting at midnight. The air samples on a 2-h basis (intensive measurements) were also carried out on 9 and 10 February during
15
the winter period and on 13–15 and 17–21 August and during the summer period. Problems occurred on 9 February between 10:00 and 12:00 in the morning and on 19 August between 22:00 and 00:00, thus data from these events were not considered. The annular denuder sampling method and the analytical procedures were described in several past works (Possanzini et al., 1983; Allegrini et al., 1987, 1999; Febo et al.,
20
1989; Perrino et al., 1990, 2001a; Beine et al., 2001; Ianniello et al., 2002).
After collection, the denuders and filters were extracted and samples were analyzed within 24-h by using Ion Chromatography (IC) (Dionex DX 120 connected with au-tosampler DX AS50 for anions and DX ICS90 connected with auau-tosampler DX AS40 for cations).
25
ACPD
10, 14209–14239, 2010Occurrence of gas phase ammonia in the area of Beijing
A. Ianniello et al.
Title Page
Abstract Introduction
Conclusions References
Tables Figures
◭ ◮
◭ ◮
Back Close
Full Screen / Esc
Printer-friendly Version Interactive Discussion
Discussion
P
a
per
|
Dis
cussion
P
a
per
|
Discussion
P
a
per
|
Discussio
n
P
a
per
|
sampling volume was about 23.10 m3 for a 24-h sampling period. In these operative conditions the collection efficiency for ammonia was higher than 99% and the detection limit, based on three times the standard deviations of field blanks, was 0.06 µg/m3 for a sampling time of 24 h. Precision of these measurements was 1.22%.
Although this paper was focused on atmospheric ammonia, the denuder system also
5
sampled other gaseous as well as particulate species. In fact, the denuder line con-sisted of two sodium fluoride coated denuders for the simultaneous collection of HCl and HNO3, followed by two sodium carbonate coated denuders for the collection of HONO and SO2. A fifth denuder in the line is coated with phosphorous acid for the collection of NH3. Downstream of the denuder train a cyclone collects coarse particles
10
(>2.5 µm of cut size at flow rate of 15 l/min), while fine particles (<2.5 µm at flow rate of 15 l/min) are collected on a filter pack set in series. The filter pack consisted of one Teflon, one Nylon filter, and one paper filter impregnated with phosphorous acid. The last two back-up filters were used to measure the volatile ammonium salts indicated with term of evolved salts. The particulate chloride, nitrate, sulphate, sodium,
ammo-15
nium, potassium, magnesium and calcium coarse and fine fractions were measured and analyzed.
Information about the mixing properties of the lower boundary layer were obtained by means of a Stability Monitor (OPSIS SM200) during the summer period. This in-strument collects atmospheric particles and determines their short life radioactivity due
20
ACPD
10, 14209–14239, 2010Occurrence of gas phase ammonia in the area of Beijing
A. Ianniello et al.
Title Page
Abstract Introduction
Conclusions References
Tables Figures
◭ ◮
◭ ◮
Back Close
Full Screen / Esc
Printer-friendly Version Interactive Discussion
Discussion
P
a
per
|
Dis
cussion
P
a
per
|
Discussion
P
a
per
|
Discussio
n
P
a
per
|
3 Results and discussion
3.1 Seasonal variation
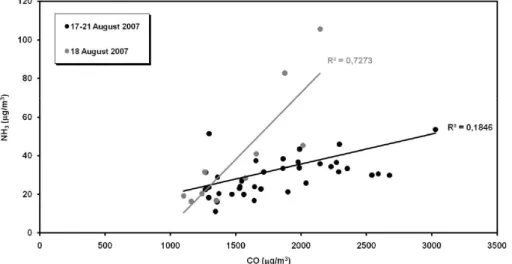
The temporal patterns of gaseous ammonia determined by means of the diffusion lines in the winter and summer periods are reported in Fig. 1. Table 1 shows summary statistics for NH3concentrations (µg/m3) and air temperature (T) values (◦C) measured
5
during the two sampling periods in Beijing.
The seasonal variations are evaluated applying the paired t-test to determine the significance at the 0.05 level (p≤0.05) of differences among the mean of components by examining the amount of variation between the samples. NH3 exhibited a distinct and significant (p <0.001) seasonal variation with higher concentrations in summer
10
than in winter (Fig. 1). This seasonality has also been observed by other papers and is in agreement with the temperature dependence of NH3 emissions from animal waste, natural and fertilized soils, and vegetations (Langford and Fehsenfeld, 1992; Langford et al., 1992; Yamamoto et al., 1995, Asman et al., 1998; Lefer et al., 1999; Aneja et al., 2000; Robarge et al., 2002; Pryor et al., 2001), which are at low values during winter.
15
NH3 temporal patterns, with higher values during warm conditions and lower values during the cold months, confirm that the air temperature is one key parameters deter-mining seasonal cycle in ammonia concentrations in Beijing. Thus, in agreement with past studies, higher ammonia emissions occurred when air temperature increased, suggesting intense local sources for NH3during the summer season.
20
3.2 Diurnall variation
3.2.1 Winter
During the intensive measurements at PKU in Beijing, the wind speed reached a maxi-mum value of 8.8 m/s on 9 February at 14:00 and the wind blew mainly from north-west (53%) (Fig. 2). The air temperature increased at 08:00 reaching maxima values
ACPD
10, 14209–14239, 2010Occurrence of gas phase ammonia in the area of Beijing
A. Ianniello et al.
Title Page
Abstract Introduction
Conclusions References
Tables Figures
◭ ◮
◭ ◮
Back Close
Full Screen / Esc
Printer-friendly Version Interactive Discussion
Discussion
P
a
per
|
Dis
cussion
P
a
per
|
Discussion
P
a
per
|
Discussio
n
P
a
per
|
tween 12:00 and 14:00 of about 13.98◦C. In addition, the solar radiation also reached higher values of about 13 W/m2on 9–10 February at 13:00 while the relative humidity decreased during all the intensive measurements starting on 9 February at 06:00 in the morning.
The mean level of ammonia within ± one standard deviation for the entire data
5
(N=23) was 5.22±3.75 µg/m3. Ammonia hardly showed any diurnal variation in win-ter period (Fig. 3), in agreement with past studies (Lefer et al., 1999; Danalatos and Glavas, 1999; Walker et al., 2004). Data were grouped into day (between 06:00 and 18:00) and night (between 18:00 and 06:00) periods. Day and night hours were based on sunrise and sunset times within each sampling period. On applyingttest to day and
10
night samples, diurnal variation was not found to be statistically significant (p=0.18). Having a short lifetime of about one day, ammonia would be expected to peak in the middle of the day as higher emissions are expected in that part of the day. This oc-curred on 9 and 10 February between 08:00 and 10:00 but higher ammonia emissions occurred also in other periods of the day, as measured after sunset and night, during
15
the intensive measurements. Night time high ammonia levels can be attributed to sta-ble atmosphere during the night time (Cadle et al., 1982; Perrino et al., 2002) while the higher mixing height in the middle of the day balanced the higher ammonia emissions resulting in little diurnal variation (Singh et al., 2001).
The source of NH3 is at ground level, thus NH3 concentrations might be generally
20
lower at higher wind speeds because of turbulent diffusion. Previous studies have reported an inverse relationship between ground-level concentrations of trace gases, such as ammonia, and wind speed (Katsoulis, 1996; D. S. Lee et al., 1999; Robarge et al., 2002). This inverse relationship between natural-log transformed NH3 con-centrations and wind speeds (Robarge et al., 2002) did not occur at significant level
25
(R2=0.18,p <0.001) considering concentrations measured only on 9 February 2007. In addition, highest NH3 concentrations were also associated with low wind speeds during this day.
tem-ACPD
10, 14209–14239, 2010Occurrence of gas phase ammonia in the area of Beijing
A. Ianniello et al.
Title Page
Abstract Introduction
Conclusions References
Tables Figures
◭ ◮
◭ ◮
Back Close
Full Screen / Esc
Printer-friendly Version Interactive Discussion
Discussion
P
a
per
|
Dis
cussion
P
a
per
|
Discussion
P
a
per
|
Discussio
n
P
a
per
|
perature and humidity dependence during the winter field campaign, as observed else-where (Langford and Fehsenfeld, 1992; Yamamoto et al., 1995; Burkhardt et al., 1998; Horvath and Sutton, 1998; Pryor et al., 2001; Olszyna et al., 2005; Vogt et al., 2005). This may reflect the influence of other factors, such as local sources and wind direc-tion, in determining ambient concentrations of NH3 (Burkhardt et al., 1998; Huber and
5
Kreutzer, 2002; Vogt et al., 2005). Figure 3 shows also that most of the time, NH3was coming nearly from northwest direction (85%). Highest NH3concentrations were also associated with these predominant northwest winds, reflecting the large contribution due to agricultural activity and fertilizer use. Thus, wind direction and speed influenced the variability of atmospheric NH3concentrations during the winter season in Beijing.
10
Atmospheric equilibrium of NH3, HNO3 and HCl with aerosol containing NH4NO3 and NH4Cl may increase NH3 gaseous concentrations at higher temperatures, while surface-atmosphere exchange of NH3 also tends toward emission in warm (and dry) conditions. In fact, the presence of local sources probably explains why the tempera-ture did not determine NH3concentrations in Beijing.
15
While agriculture is the main source of atmospheric ammonia in Beijing, the contribu-tion of vehicles, equipped with catalytic converters, to non-agricultural NH3 emissions has recently been considered. Therefore, in order to examine the contribution of traf-fic to NH3 concentrations it may be useful to compare the ammonia concentrations with those of primary non-reactive pollutants mainly emitted by motor-vehicle exhausts
20
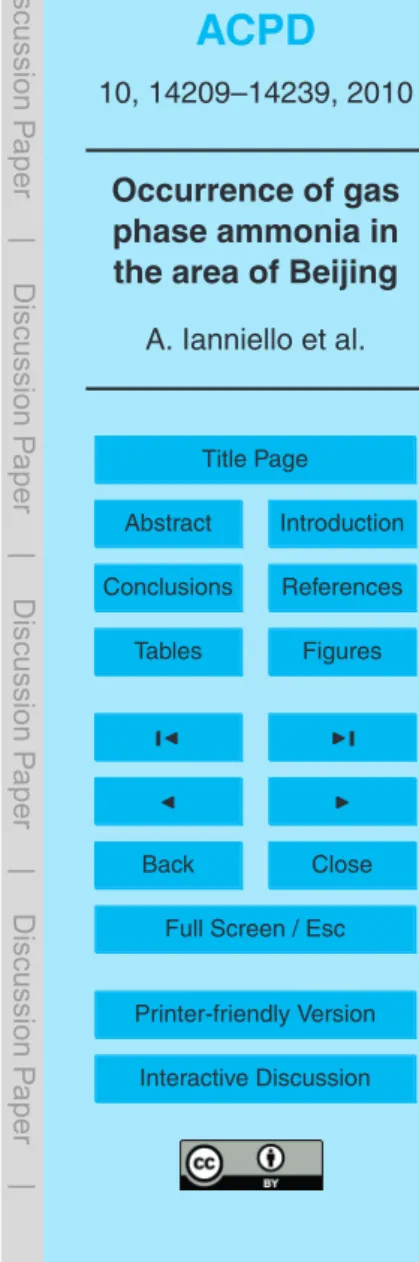
(Perrino et al., 2002), such as carbon dioxide (CO) and nitrogen oxides (NOx). CO data were not collected during the winter period, but we can consider the time trend of NOx since it has been estimated that the transport sector is responsible for about 35–40% of NOxemissions in Beijing (He et al., 2002; Meng et al., 2008, Chak and Yao, 2008). The scatter plot of NH3concentration vs. NOxconcentration during the intensive winter
25
ACPD
10, 14209–14239, 2010Occurrence of gas phase ammonia in the area of Beijing
A. Ianniello et al.
Title Page
Abstract Introduction
Conclusions References
Tables Figures
◭ ◮
◭ ◮
Back Close
Full Screen / Esc
Printer-friendly Version Interactive Discussion
Discussion
P
a
per
|
Dis
cussion
P
a
per
|
Discussion
P
a
per
|
Discussio
n
P
a
per
|
was obtained considering concentrations measured on 9 February during the formation of the highest peaks of ammonia and nitrogen oxides (Fig. 4). However, the amount of scatter about these regression lines indicates that other ammonia sources not linked to NOxare also significant. These are due to human and agricultural sources and solvent use.
5
These results confirm that NH3 evolution is governed by at least three main param-eters: wind direction, wind speed and traffic emissions.
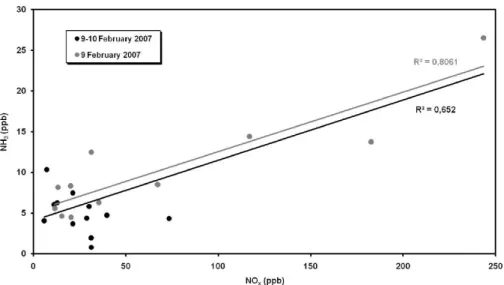
3.2.2 Summer
During the intensive measurements the wind speed reached a maximum value of 3 m/s at 18:00 in the afternoon, the wind blew mainly from south (36%) and northwest (25%)
10
(Fig. 5). In addition, the air temperature and relative humidity reached a value of about 35◦C and 90%, respectively.
The mean level of ammonia within ± one standard deviation for the entire data
(N=47) was 31.84±16.57 µg/m3. As in winter, the diurnal variation of ammonia is
not statistically significant (p=0.53) in the summer (Fig. 6). Usually, broad peaks of
15
NH3 concentrations were observed in the morning (between 06:00, and 10:00), as higher ammonia emissions occurred in summer, with one exception of 19 August at 20:00 in the evening. As suggested by other studies, the transport of NH3from down-wind sources was the cause of higher daytime concentrations, while dry deposition and conversion to aerosol may exceed the contribution from transport at night, resulting in
20
higher concentrations during the day. However, the diurnal pattern of ammonia did not show a clear and well-defined temperature dependence during the summer field campaign, as it was in the winter.
In addition, ammonia concentrations showed a dependency of wind direction. The NH3concentrations from northwest, southwest and south sector were observed nearly
25
activ-ACPD
10, 14209–14239, 2010Occurrence of gas phase ammonia in the area of Beijing
A. Ianniello et al.
Title Page
Abstract Introduction
Conclusions References
Tables Figures
◭ ◮
◭ ◮
Back Close
Full Screen / Esc
Printer-friendly Version Interactive Discussion
Discussion
P
a
per
|
Dis
cussion
P
a
per
|
Discussion
P
a
per
|
Discussio
n
P
a
per
|
ity and fertilizer use. In fact, a moderate but a significant linear correlation (R2=0.29, p <0.001) was detected between natural-log transformed ammonia concentrations and wind speeds (Robarge et al., 2002).
These higher ammonia values during the day can be also attributed to stable atmo-sphere conditions. The analysis of the temporal pattern of natural radioactivity (Fig. 6)
5
shows that the convective mixing of the atmosphere occurs between the late morning (12:00–13:00 a.m.) of the previous day and the early morning of the subsequent day (03:00–04:00 a.m.). Subsequently, a rapid increase of natural radioactivity determines atmospheric stability with high values at 06:00 and at 08:00 in the morning. In these conditions, pollution events are generally favoured. This implies that most of the
traf-10
fic emission is injected into a stagnant atmosphere causing the sharp increase in the concentration of ammonia, which reached the remarkable value of 105.67 µg/m3 (18 August 2007), one of the highest values during the intensive measurements. During the same hours CO and NOx concentrations reached the levels of 2.15 mg/m3 and 112.6 µg/m3(Fig. 6), respectively, and this is an indication of a common origin of these
15
pollutants, i.e., traffic emission (Perrino et al., 2002; Edgerton et al., 2007).
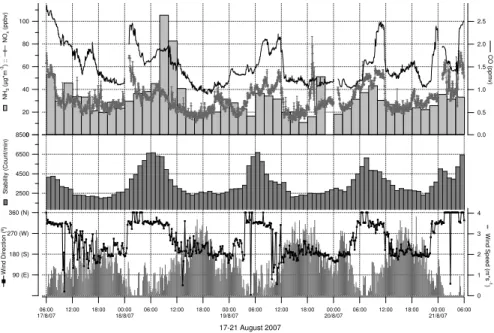
The data of Fig. 6 show that NH3, CO and NOx had similar temporal patterns, but the correlations between these species were not good. A weak but significant linear correlation occurred between NH3and CO (R2=0.18,p <0.001) (Fig. 7). For the NH3 and NOxdata, the correlation did not occur (Fig. 8). However, for the CO and NOxdata,
20
the best relationships, with a correlation coefficients of 0.72 (Fig. 7) and 0.39 (Fig. 8), respectively, were obtained considering concentrations measured only on 18 August 2007 during the formation of the higher peaks of ammonia and low winds supporting the hypothesis that the traffic is also a important mobile source of NH3. However, the correlation between NH3and NOx are weaker than that in the winter, suggesting that
25
other, non-traffic sources, became significant. The higher temperatures in the summer will increase ammonia emission from agricultural sources, resulting in the breakdown in the relationship between the two gases.
dis-ACPD
10, 14209–14239, 2010Occurrence of gas phase ammonia in the area of Beijing
A. Ianniello et al.
Title Page
Abstract Introduction
Conclusions References
Tables Figures
◭ ◮
◭ ◮
Back Close
Full Screen / Esc
Printer-friendly Version Interactive Discussion
Discussion
P
a
per
|
Dis
cussion
P
a
per
|
Discussion
P
a
per
|
Discussio
n
P
a
per
|
sociation of particulate ammonium nitrate (Langford et al., 1992; H. S. Lee et al., 1999; Possanzini et al., 1999). Volatilization of NH3from the aerosol phase may be significant enough to dominate over traffic emissions during the summer (Whitehead et al., 2007) and mask any correlations with traffic related pollutants. It is known that volatile am-monium salts collected on the Teflon filter (NH4Cl and NH4NO3) dissociate to HCl and
5
HNO3, a phenomenon which depends mainly upon meteorological conditions (air tem-perature and relative humidity), on the aerosol composition, and on the acidity of the particles. In this work the gases evolved from the front Teflon filters were recovered on the back-up Nylon and phosphorous acid-impregnated filters. Data from 2h sampling over the 17–21 August period showed that Teflon filters exhibited a nearly complete
10
depletion of nitrate and chloride (>90%) which were recovered on Nylon filters. This indicated that nitrate and chloride were almost entirely associated to ammonium. In-deed, a comparison of µmol amount of NH+4 with µmol amounts of anions (NO−3+Cl−) determined on the back-up filters showed a good correlation (R2=0.80, p <0.001). However, the diurnal variation in NH3 concentrations had a similar trend as for NH+4,
15
with one exception of 17 August. During this day, the formation of aerosol NH+4 lead to the decrease of NH3concentrations and vice versa. This behaviour could be explained with the displacement of the thermodynamic equilibrium between ammonium salts and their gaseous precursors. While for the other days (18–21 August), the fact that the NH3and NH+4 exhibited similar patterns is due to dissolution of a significant fraction of
20
NH3in humid aerosols under high relative humidity conditions (Hesterberg et al., 1996; Krupa, 2003; Trebs et al., 2004, 2005; Hu et al., 2008). In fact, the concentrations of ammonia and ammonium reach the maximum values at the same time (between 06:00 and 10:00). Possible evaporation of NH3from wet surfaces due to temperature increase just after sunrise, when relative humidities were still high might have caused a
25
significant fraction of gaseous NH3 to dissolve in still deliquescent aerosols, therefore enhancing aerosol NH+4.
ACPD
10, 14209–14239, 2010Occurrence of gas phase ammonia in the area of Beijing
A. Ianniello et al.
Title Page
Abstract Introduction
Conclusions References
Tables Figures
◭ ◮
◭ ◮
Back Close
Full Screen / Esc
Printer-friendly Version Interactive Discussion
Discussion
P
a
per
|
Dis
cussion
P
a
per
|
Discussion
P
a
per
|
Discussio
n
P
a
per
|
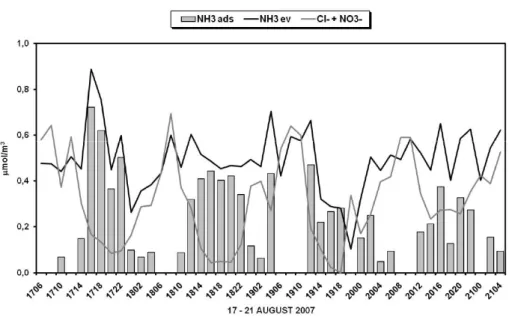
in principle we should find equimolecular amounts of anions (Cl−+NO−3) and of evapo-rated ammonia (NH3ev) determined on the back-up filters. On the contrary, the results reported in Fig. 9 show that during the intensive measurements in the summer period, ammonia frequently exceeded the sum of chloride and nitrate. This unbalance can be regarded as an additional phenomenon which adds ammonia to the dissociation of
5
ammonium nitrate and chloride; a possible explanation is the presence of other anions (e.g. organic matter) or of gaseous ammonia adsorbed or dissolved in deliquescent aerosol (NH3ads), as said before, which is desorbed from the collected fine partic-ulate matter during the sampling and is then recovered on the back-up acid-coated filters, as already seen in previous studies (Perrino and Gherardi, 1999). This
unbal-10
anced amount of ammonia, ranged from 0.06 µmol/m3 (1.15 µg/m3) to 0.72 µmol/m3 (13 µg/m3) with an average value of about 0.26 µmol/m3 (4.75 µg/m3) during the sum-mer sampling period. The value of 0 indicated that ammonia is in balance on back-up filters (Fig. 9). The unbalanced ammonia, clearly adsorbed on particles, can be a fur-ther source of atmospheric ammonia during specific meteorological conditions such as
15
dry and warm and windy environments.
These results confirm that NH3evolution is governed in summer by at least four main parameters: wind direction, wind speed, atmospheric mixing and traffic emissions.
4 Conclusions
The atmospheric concentrations of NH3have been measured at an urban site (Peking
20
University) in Beijing in the winter and summer of 2007. All data were analyzed to investigate temporal variations, meteorological effects and special features of the gas-particulate equilibrium. According to the results, the following conclusions were reached:
– The NH3concentrations showed regular seasonal variations, having significantly
25
ACPD
10, 14209–14239, 2010Occurrence of gas phase ammonia in the area of Beijing
A. Ianniello et al.
Title Page
Abstract Introduction
Conclusions References
Tables Figures
◭ ◮
◭ ◮
Back Close
Full Screen / Esc
Printer-friendly Version Interactive Discussion
Discussion
P
a
per
|
Dis
cussion
P
a
per
|
Discussion
P
a
per
|
Discussio
n
P
a
per
|
dominated by air temperature.
– The NH3concentrations didn’t show any diurnal variation in both winter and sum-mer seasons.
– The effects of wind direction and of the atmospheric mixing on the NH3 concen-trations were the two most significant meteorological parameters. The NH3
con-5
centrations were slightly affected by wind speed.
Moderate correlations were obtained between NH3 and gas pollutants, such as NOx and CO, indicating an influence by traffic emissions.
Acknowledgements. We would like to thank the “Blue Sky of Beijing: Research on regional
Air Pollution Pproject”, the Beijing Municipal Environmental Protection Bureau and the Italian
10
Ministry for the Environment; Land and Sea (IMELS) of Italy for the financial support through the Sino-Italian Cooperation Program, and the Beijing Council of Science and Technology (HB200504-6, HB200504-2) for supporting Peking University to organize the field study CARE-BEIJING.
References
15
Allegrini, I., De Santis, F., Di Palo, V., Febo, A., Perrino, C., Possanzini, M., and Liberti, A.: Annular denuder method for sampling reactive gases and aerosols in the atmosphere, Sci. Total Environ., 67, 1–16, 1987.
Allegrini, I., Ianniello, A., Montagnoli, M., Sparapani, R., and Mazzioti Gomez de Teran, C.: Carbon coated annular denuders and ion chromatographic measurements for the
determi-20
nation of nitrogen-containing species (NO2and NOy) in remote atmospheres, J. Chromatogr.
A, 846, 265–268, 1999.
Aneja, V. P., Chauhan, J. P., and Walker, J. T.: Characterization of atmospheric ammonia emis-sions from swine waste storage and treatment lagoons, J. Geophys. Res., 105, 11535– 11545, 2000.
25
ACPD
10, 14209–14239, 2010Occurrence of gas phase ammonia in the area of Beijing
A. Ianniello et al.
Title Page
Abstract Introduction
Conclusions References
Tables Figures
◭ ◮
◭ ◮
Back Close
Full Screen / Esc
Printer-friendly Version Interactive Discussion
Discussion
P
a
per
|
Dis
cussion
P
a
per
|
Discussion
P
a
per
|
Discussio
n
P
a
per
|
Asman, W. A., Sutton, M. A., and Schjorring, J. K.: Ammonia: emission, atmospheric transport, and deposition, New Phytol., 139, 27–48, 1998.
Bari, A., Ferraro, V., Wilson, L. R, Luttinger, D., and Husain, L.: Measurements of gaseous HONO, HNO3, SO2, HCl, NH3, particulate sulfate and PM2.5in New York, NY, Atmos.
Envi-ron., 37, 2825–2835, 2003.
5
Battye, W., Aneja, V. P., and Roelle, P.: Evaluation and improvement of ammonia emissions inventories, Atmos. Environ., 37, 3873–3883, 2003.
Beine, H. J., Allegrini, I., Sparapani, R., Ianniello, A., and Valentini, F.: Three years of springtime trace gas and particle measurements at Ny- ˚Alesund, Svalbard, Atmos. Environ., 35, 3645– 3658, 2001.
10
Bouwman, A. F., Lee, D. S., Asman, W. A. H., Dentener, F. J., Van der Hoek, K. W., and Olivier, J. G. J.: A global high-resolution emission inventory for ammonia, Global Biogeochem. Cy., 11, 561–587, 1997.
Brunekreef, B. and Holgate, S. T.: Air pollution and health, Lancet, 360, 1233–1242, 2002. Burkhardt, J., Sutton, M. A., Milford, C., Storeton-West, R. L., and Fowler, D.: Ammonia
con-15
centrations at a site in southern Scotland from 2 yr of continuous measurements, Atmos. Environ., 32, 325–331, 1998.
Cadle, S. H., Countessand, R. J., and Kelley, N. A.: Nitric acid and ammonia in urban and rural locations, Atmos. Environ., 16, 2501–2506, 1982.
Cape, J. N., Tang, Y. S., Van Dijk, N., Love, L., Sutton, M. A., and Palmer, S. C. F.:
Concentra-20
tions of ammonia and nitrogen dioxide at roadside verges, and their contribution to nitrogen deposition, Environ. Pollut., 132, 469–478, 2004.
Carmichael, G. R., Ferm, M., Thongboonchoo, N., Woo, J.-H., Chan, L. Y., Murano, K., Viet, P. H., Mossberg, C., Bala, R., Boonjawat, J., Upatum, P., Mohan, M., Adhikary, S. P, Shrestha, A. B, Pienaar, J. J., Brunke, E. B., Chen, T., Jie, T., Guoan, D., Peng, L. C., Dhiharto, S.,
25
Harjanto, H., Jose, A. M., Kimani, W., Kirouane, A., Lacaux, J.-P., Richard, S., Barturen, O., Cerda, J. C., Athayde, A., Tavares, T., Cotrina, J. S., and Bilici, E.: Measurements of sulfur dioxide, ozone and ammonia concentrations in Asia, Africa, and South America using passive samplers, Atmos. Environ., 37, 1293–1308, 2003.
Chak, C. K. and Yao, X.: Air pollution in mega cities in China – A review, Atmos. Environ., 42,
30
1–42, 2008.
ACPD
10, 14209–14239, 2010Occurrence of gas phase ammonia in the area of Beijing
A. Ianniello et al.
Title Page
Abstract Introduction
Conclusions References
Tables Figures
◭ ◮
◭ ◮
Back Close
Full Screen / Esc
Printer-friendly Version Interactive Discussion
Discussion
P
a
per
|
Dis
cussion
P
a
per
|
Discussion
P
a
per
|
Discussio
n
P
a
per
|
Edgerton, E. S., Saylor, R. D., Hartsell, B. E., Jansen, J. J., and Hansen, D. A.: Ammonia and ammonium measurements from the southeastern United States, Atmos. Environ., 41, 3339–3351, 2007.
Erisman, J. W. and Schaap, M.: The need for ammonia abatement with respect to secondary PM reductions in Europe, Environ. Pollut., 129, 159–163, 2004.
5
Fangmeier, A., Hadwiger-Fangmeier, A., van der Eerden, L., and Jaeger, H. J.: Effects of atmospheric ammonia on vegetation – A review, Environ. Pollut., 86, 43–82, 1994.
Febo, A., De Santis, F., Perrino, C., and Giusto, M.: Evaluation of laboratory and field perfor-mance of denuder tubes: a theoretical approach, Atmos. Environ., 23, 1517–1530, 1989. Ferm, M.: Atmospheric ammonia and ammonium transport in Europe and critical loads: a
10
review, Nutr. Cycl. Agroecosys., 51, 5–17, 1998.
Fraser M. P. and Cass G. R.: Detection of excess ammonia emissions from in use vehicles and the implications for fine particle control, Environ. Sci. Technol., 32, 1053–1057, 1998. Goebes, M. D., Strader, R., and Davidson, C.: An ammonia emission inventory for fertilizer
application in the United States, Atmos. Environ., 37, 2539–2550, 2003.
15
He, K., Yang, F., Ma, Y., Zhang, Q., Yao, X., Chan, C. K., Cadle, S., Chan, T., and Mulawa, P.: The characteristics of PM2.5in Beijing, China, Atmos. Environ., 35, 4959–4970, 2001.
He, K., Huo, H., and Zhang, Q.: Urban air pollution in china: Current Status, Characteristics, and Progress, Annu. Rev. Energ. Env.., 27, 397–431, 2002.
He, C.-E., Liu, X., Fangmeier, A., and Zhang, F.: Quantifying the total airborne nitrogen input
20
into agroecosystems in the North China Plain, Agr. Ecosyst. Environ., 121, 395–400, 2007. Heeb, N. V., Forss, A.-M., Br ¨uhlmann, S., L ¨uscher, R., Saxer, C. J., and Hug, P.: Three-way
catalyst-induced formation of ammonia velocity- and acceleration-dependent emission fac-tors, Atmos. Environ., 40, 5986–5997, 2006.
Hesterberg, R., Blatter, A., Fahrni, M., Rosset, M, Neftel, A., Eugster, W., and Wanner, H.:
25
Deposition of nitrogen-containing compounds to an extensively managed grassland in central Switzerland, Environ. Pollut., 91, 21–34, 1996.
Horvath, H.: Effects on visibility, weather and climate, in: Atmospheric acidity: sources, conse-quences and abatement, edited by: Radojevic, M. and Harrison, R. M., chapter 13, London: Elsevier Applied Science, 1992.
30
Horvath, L. and Sutton, M. A.: Long term record of ammonia and ammonium concentrations at K-puszta, Hungary, Atmos. Environ., 32, 339–344, 1998.
water-ACPD
10, 14209–14239, 2010Occurrence of gas phase ammonia in the area of Beijing
A. Ianniello et al.
Title Page
Abstract Introduction
Conclusions References
Tables Figures
◭ ◮
◭ ◮
Back Close
Full Screen / Esc
Printer-friendly Version Interactive Discussion
Discussion
P
a
per
|
Dis
cussion
P
a
per
|
Discussion
P
a
per
|
Discussio
n
P
a
per
|
soluble ions in PM2.5 at a coastal site in the Pearl River Delta, China, Atmos. Environ., 22,
6310–6320, 2008.
Huber, C. and Kreutzer, K.: Three years of continuous measurements of atmospheric ammonia concentrations over a forest stand at the Hoglwald site in southern Bavaria, Plant Soil, 240, 13–22, 2002.
5
Ianniello, A., Beine, H. J., Sparapani, R., Di Bari, F., Allegrini, I., and Fuentes, J. D.: Denuder measurements of gas and aerosol species above Arctic snow surfaces at Alert 2000, Atmos. Environ., 36, 5299–5309, 2002.
Katsoulis, B. D.: The relationship between synoptic, mesoscale and microscale meteorological parameters during poor air quality events in Athens, Greece, Sci. Total Environ., 181, 13–24,
10
1996.
Kean, A. J., Harley, R. A., Littlejohn, D., and Kendall, G. R.: On-road measurement of ammonia and other motor vehicle exhaust emissions, Environ. Sci. Technol., 34, 3535–3539, 2000. Kirchner, M., Braeutigam, S., Feicht, E., and L ¨oflund, M.: Ammonia emissions from vehicles
and the effects on ambient air concentrations, Fresen. Environ. Bull., 11, 454–458, 2002.
15
Krupa, S. V.: Effects of atmospheric ammonia (NH3) on terrestrial vegetation: A review, Environ.
Pollut., 124, 179–221. 2003.
Langford, A. O. and Fehsenfeld, F. C.: The role of natural vegetation as a source or sink for atmospheric ammonia: a case study, Science, 255, 581–583, 1992.
Langford, A. O., Fehsenfeld, F. C., Zachariassen, J., and Schimel, D. S.: Gaseous ammonia
20
fluxes and background concentrations in terrestrial ecosystems of the United States, Global Biogeochem. Cy., 6, 459–483, 1992.
Lee, D. S., Dollard, G. J., Derwent, R. G., and Pepler, S.: Observations on gaseous and aerosols components of atmosphere and their relationships, Water Air Soil Poll., 113, 175– 202, 1999.
25
Lee, H. S., Kang, C. M., Kang, B. W., and Kim, H. K.: Seasonal variations of acidic air pollutants in Seoul, South Korea, Atmos. Environ., 33, 3143–3152, 1999.
Lefer, B. L., Talbot, R. W., and Munger, J. W.: Nitric acid and ammonia at a rural northeastern US site, J. Geophys Res., 104, 1645–1661, 1999.
Li, Y., Schwab, J. J., and Demerjian, K. L.: Measurements of ambient ammonia
us-30
ACPD
10, 14209–14239, 2010Occurrence of gas phase ammonia in the area of Beijing
A. Ianniello et al.
Title Page
Abstract Introduction
Conclusions References
Tables Figures
◭ ◮
◭ ◮
Back Close
Full Screen / Esc
Printer-friendly Version Interactive Discussion
Discussion
P
a
per
|
Dis
cussion
P
a
per
|
Discussion
P
a
per
|
Discussio
n
P
a
per
|
Meng, Z. Y., Ding, G. A., Xu, X. B., Xu, X. D., Yu, H. Q., and Wang, S. F.: Vertical distributions of SO2and NO2 in the lower atmosphere in Beijing urban areas, China, Sci. Total Environ.,
390, 456–465, 2008.
Olivier, J. G. J., Bouwman, A. F., Van der Hoek, K. W., and Berdowski, J. J. M.: Global air emission inventories for anthropogenic sources of NOx, NH3, and N2O in 1990, Environ.
5
Pollut., 102, 135–148, 1998.
Olszyna, K. J., Bairai, S. T., and Tanner, R. L.: Effect of ambient NH3levels on PM2.5
composi-tion in the Great Smoky Mountains Nacomposi-tional Park, Atmos. Environ., 39, 4593–4606, 2005. Perrino, C., De Santis, F., and Febo, A.: Criteria for the choice of a denuder sampling technique
devoted to the measurement of atmospheric nitrous and nitric acids, Atmos. Environ., 24A,
10
617–626, 1990.
Perrino, C. and Gherardi, M.: Optimization of the coating layer for the measurement of ammonia by diffusion denuders, Atmos. Environ., 33, 4579–4587, 1999.
Perrino, C., Ramirez, D., and Allegrini, I.: Monitoring acidic air pollutants near Rome by means of diffusion lines: development of a specific quality control procedure, Atmos. Environ., 35,
15
331–341, 2001a.
Perrino, C., Pietrodangelo, A., and Febo, A.: An atmospheric stability index based on radon progeny measurements for the evaluation of primary urban pollution, Atmos. Environ., 35, 5235–5244, 2001b.
Perrino, C., Catrambone, M., Di Menno Di Bucchianico, A., and Allegrini, I.: Gaseous ammonia
20
in the urban area of Rome, Italy, and its relationship with traffic emissions, Atmos. Environ., 36, 5385–5394, 2002.
Possanzini, M., Febo A., and Liberti A.: New design of a high performance denuder for the sampling of atmospheric pollutants, Atmos. Environ., 17, 2605–2610, 1983.
Possanzini, M., De Santis, F., and Di Palo, V.: Measurements of nitric acid and ammonium salts
25
in lower Bavaria, Atmos. Environ., 33, 3597–3602, 1999.
Pryor, S. C., Barthelmie, R. J., Sørensen, L. L., and Jensen, B.: Ammonia concentrations and fluxes over a forest in the midwestern USA, Atmos. Environ., 35, 5645–5656, 2001.
Robarge, W. P., Walker, J. T., McCulloch, R. B., and Murray, G.: Atmospheric concentrations of ammonia and ammonium at an agricultural site in the southeast United States, Atmos.
30
Environ., 36, 1661–1674, 2002.
ACPD
10, 14209–14239, 2010Occurrence of gas phase ammonia in the area of Beijing
A. Ianniello et al.
Title Page
Abstract Introduction
Conclusions References
Tables Figures
◭ ◮
◭ ◮
Back Close
Full Screen / Esc
Printer-friendly Version Interactive Discussion
Discussion
P
a
per
|
Dis
cussion
P
a
per
|
Discussion
P
a
per
|
Discussio
n
P
a
per
|
Singh, S. P., Satsangi, G. S., Khare, P., Lakhani, A., Maharaj Kumari, K., and Srivastava, S. S.: Multiphase measurement of atmospheric ammonia, Chemosphere – Global Change Science 3, 107–116, 2001.
Streets, D. G., Bond, T. C., Carmichael, G. R., Fernandes, S. D., Fu, Q., He, D., Klimont, Z., Nelson, S. M., Tsai, N. Y., Wang, M. Q., Woo, J. H., and Yarber, K. F.: An inventory of gaseous
5
and primary aerosol emissions in Asia in the year 2000, J. Geophys Res., 108(D21), 8809, doi:10.1029/2002JD003093, 2003.
Sutton, M. A., Pitcairn, C. E. R., and Fowler, D.: The exchange of ammonia between the atmosphere and plant communities, Adv. Ecol. Res., 24, 301–393, 1993.
Sutton, M. A., Asman, W. A. H., and Schjørring, J. K.: Dry deposition of reduced nitrogen,
10
Tellus, 46B, 255–273, 1994.
Sutton, M. A., Place, C. J., Eager, M., Fowler, D., and Smith, R. L.: Assessment of the magni-tude of ammonia emissions in the United Kingdom, Atmos. Environ., 29, 1393–1411, 1995. Sutton, M. A., Dragosits, U., Tang, Y. S., and Fowler, D.: Ammonia emissions from
non-agricultural sources in the UK, Atmos. Environ., 34, 855–869, 2000.
15
Trebs, I., Meixner, F. X., Slanina, J., Otjes, R., Jongejan, P., and Andreae, M. O.: Real-time measurements of ammonia, acidic trace gases and water-soluble inorganic aerosol species at a rural site in the Amazon Basin, Atmos. Chem. Phys., 4, 967–987, doi:10.5194/acp-4-967-2004, 2004.
Trebs, I., Metzger, S., Meixner, F. X., Helas, G. N., Hoffer, A., Rudich, Y., Falkovich, A. H.,
20
Moura, M. A. L., da Silva, R. S., Artaxo, P., Slanina, J., and Andreae, M. O.: The NH+4
-NO−
3-Cl
−
-SO2−
4 -H2O aerosol system and its gas phase precursors at a pasture site in the
Amazon Basin: How relevant are mineral cations and soluble organic acids? J. Geophys. Res.-Atmos., 110(D7), D07303, doi:10.1029/2004JD005478, 2005.
Vogt, E., Held, A., and Klemm, O.: Sources and concentrations of gaseous and particulate
25
reduced nitrogen in the city of M ¨unster (Germany), Atmos. Environ., 39, 7393–7402, 2005. Walker, J. T., Whitall, D. R., Robarge, W., and Paerl, H. W.: Ambient ammonia and ammonium
aerosol across a region of variable ammonia emission density, Atmos. Environ., 38, 1235– 1246, 2004.
Whitehead, J. D., Longley, I. D., and Gallagher, M. W.: Seasonal and diurnal variation in
at-30
mospheric ammonia in an urban environment measured using a quantum cascade laser absorption spectrometer, Water Air Soil Poll., 183, 317–329, 2007.
ACPD
10, 14209–14239, 2010Occurrence of gas phase ammonia in the area of Beijing
A. Ianniello et al.
Title Page
Abstract Introduction
Conclusions References
Tables Figures
◭ ◮
◭ ◮
Back Close
Full Screen / Esc
Printer-friendly Version Interactive Discussion
Discussion
P
a
per
|
Dis
cussion
P
a
per
|
Discussion
P
a
per
|
Discussio
n
P
a
per
|
variation of atmospheric ammonia and particulate ammonium concentrations in the urban atmosphere of Yokohama over a 5-year period, Atmos. Environ., 22, 2621–2623, 1988. Yamamoto, N., Nishiura, H., Honjo, T., Ishikawa, Y., and Suzuki, K.: A long-term study of
at-mospheric ammonia and particulate ammonium concentrations in Yokohama, Japan, Atmos. Environ., 29, 97–103, 1995.
5
Yao, X., Lau, A. P. S., Fang, M., Chan, C. K., and Hu, M.: Size distributions and formation of ionic species in atmospheric particulate pollutants in Beijing, China: 1-inorganic ions, Atmos. Environ., 37, 2991–3000, 2003.
Zhao, D. and Wang, A.: Estimation of anthropogenic ammonia emissions in Asia, Atmos. Envi-ron., 28, 687–694, 1994.
ACPD
10, 14209–14239, 2010Occurrence of gas phase ammonia in the area of Beijing
A. Ianniello et al.
Title Page
Abstract Introduction
Conclusions References
Tables Figures
◭ ◮
◭ ◮
Back Close
Full Screen / Esc
Printer-friendly Version Interactive Discussion
Discussion
P
a
per
|
Dis
cussion
P
a
per
|
Discussion
P
a
per
|
Discussio
n
P
a
per
|
Table 1.Statistics for NH3andT during the winter and summer campaign at PKU site.
Winter Summer
NH3(µg/m 3
) T (◦C) NH3(µg/m 3
) T (◦C)
Nof cases 23 23 30 30
Minimum 0.20 −0.71 14.87 22.19
Maximum 14.08 8.06 44.38 32.37
Median 5.12 3.05 24.33 28.80
Mean 5.47 3.51 25.39 28.27
ACPD
10, 14209–14239, 2010Occurrence of gas phase ammonia in the area of Beijing
A. Ianniello et al.
Title Page
Abstract Introduction
Conclusions References
Tables Figures
◭ ◮
◭ ◮
Back Close
Full Screen / Esc
Printer-friendly Version Interactive Discussion
Discussion
P
a
per
|
Dis
cussion
P
a
per
|
Discussion
P
a
per
|
Discussio
n
P
a
per
|
Page 1/ 1
ACPD
10, 14209–14239, 2010Occurrence of gas phase ammonia in the area of Beijing
A. Ianniello et al.
Title Page
Abstract Introduction
Conclusions References
Tables Figures
◭ ◮
◭ ◮
Back Close
Full Screen / Esc
Printer-friendly Version Interactive Discussion
Discussion
P
a
per
|
Dis
cussion
P
a
per
|
Discussion
P
a
per
|
Discussio
n
P
a
per
|
Fig. 2.Wind plot showing the frequency distribution of wind directions and speeds (grey scale) of the intensive winter measurements. The radius axis represents the occurrence from 0% to 60%.
ACPD
10, 14209–14239, 2010Occurrence of gas phase ammonia in the area of Beijing
A. Ianniello et al.
Title Page
Abstract Introduction
Conclusions References
Tables Figures
◭ ◮
◭ ◮
Back Close
Full Screen / Esc
Printer-friendly Version Interactive Discussion
Discussion
P
a
per
|
Dis
cussion
P
a
per
|
Discussion
P
a
per
|
Discussio
n
P
a
per
|
25
20
15
10
5
0
NH
3
(µg*m
-3)
00:00 9/2/07
06:00 12:00 18:00 00:00 10/2/07
06:00 12:00 18:00 00:00 11/2/07
9-10 February 2007
8
6
4
2
0
Wind Speed (m*s
-1
)
90 (E) 180 (S) 270 (W) 360 (N)
Wind Direction (º)
250
200
150
100
50
0
NO
x (ppbv)
Fig. 3. Diurnal trends of NH3, NOx, wind speed and direction during the intensive winter
ACPD
10, 14209–14239, 2010Occurrence of gas phase ammonia in the area of Beijing
A. Ianniello et al.
Title Page
Abstract Introduction
Conclusions References
Tables Figures
◭ ◮
◭ ◮
Back Close
Full Screen / Esc
Printer-friendly Version Interactive Discussion
Discussion
P
a
per
|
Dis
cussion
P
a
per
|
Discussion
P
a
per
|
Discussio
n
P
a
per
|
Page 1/ 1
ACPD
10, 14209–14239, 2010Occurrence of gas phase ammonia in the area of Beijing
A. Ianniello et al.
Title Page
Abstract Introduction
Conclusions References
Tables Figures
◭ ◮
◭ ◮
Back Close
Full Screen / Esc
Printer-friendly Version Interactive Discussion
Discussion
P
a
per
|
Dis
cussion
P
a
per
|
Discussion
P
a
per
|
Discussio
n
P
a
per
|
100
80
60
40
20
0
NH
3
(µg*m
-3) ::
NO
x
(ppbv)
06:00 17/8/07
12:00 18:00 00:00 18/8/07
06:00 12:00 18:00 00:00 19/8/07
06:00 12:00 18:00 00:00 20/8/07
06:00 12:00 18:00 00:00 21/8/07
06:00
17-21 August 2007
8500
6500
4500
2500
Stability (Count/min)
4
3
2
1
0
Wind Speed (m*s
-1
)
90 (E) 180 (S) 270 (W) 360 (N)
Wind Direction (º)
2.5
2.0
1.5
1.0
0.5
0.0
CO (ppmv)
Fig. 6.Diurnal trends of NH3, NOx, CO, atmospheric stability, wind speed and direction during
ACPD
10, 14209–14239, 2010Occurrence of gas phase ammonia in the area of Beijing
A. Ianniello et al.
Title Page
Abstract Introduction
Conclusions References
Tables Figures
◭ ◮
◭ ◮
Back Close
Full Screen / Esc
Printer-friendly Version Interactive Discussion
Discussion
P
a
per
|
Dis
cussion
P
a
per
|
Discussion
P
a
per
|
Discussio
n
P
a
per
|
Page 1/ 1
ACPD
10, 14209–14239, 2010Occurrence of gas phase ammonia in the area of Beijing
A. Ianniello et al.
Title Page
Abstract Introduction
Conclusions References
Tables Figures
◭ ◮
◭ ◮
Back Close
Full Screen / Esc
Printer-friendly Version Interactive Discussion
Discussion
P
a
per
|
Dis
cussion
P
a
per
|
Discussion
P
a
per
|
Discussio
n
P
a
per
|
Page 1/ 1
Fig. 9. Comparison between the amounts of evaporated ammonia (NH3ev) and of its anions
(Cl− +NO−
3) on the back-up filters and trend of unbalanced ammonia (NH3ads on particulate) during