TCD
9, 2597–2623, 2015Revealing glacier flow and surge dynamics from animated satellite image sequences
F. Paul
Title Page
Abstract Introduction
Conclusions References
Tables Figures
◭ ◮
◭ ◮
Back Close
Full Screen / Esc
Printer-friendly Version
Interactive Discussion
Discussion
P
a
per
|
Discussion
P
a
per
|
Discussion
P
a
per
|
Discussion
P
a
per
|
The Cryosphere Discuss., 9, 2597–2623, 2015 www.the-cryosphere-discuss.net/9/2597/2015/ doi:10.5194/tcd-9-2597-2015
© Author(s) 2015. CC Attribution 3.0 License.
This discussion paper is/has been under review for the journal The Cryosphere (TC). Please refer to the corresponding final paper in TC if available.
Revealing glacier flow and surge
dynamics from animated satellite image
sequences: examples from the Karakoram
F. Paul
Department of Geography, University of Zurich, Zurich, Switzerland
Received: 20 February 2015 – Accepted: 1 April 2015 – Published: 27 April 2015 Correspondence to: F. Paul ([email protected])
TCD
9, 2597–2623, 2015Revealing glacier flow and surge dynamics from animated satellite image sequences
F. Paul
Title Page
Abstract Introduction
Conclusions References
Tables Figures
◭ ◮
◭ ◮
Back Close
Full Screen / Esc
Printer-friendly Version
Interactive Discussion
Discussion
P
a
per
|
Discussion
P
a
per
|
Discussion
P
a
per
|
Discussion
P
a
per
|
Abstract
Although animated images are very popular on the Internet, they have so far found only limited use for glaciological applications. With long time-series of satellite images be-coming increasingly available and glaciers being well recognized for their rapid changes and variable flow dynamics, animated sequences of multiple satellite images reveal
5
glacier dynamics in a time-lapse mode, making the otherwise slow changes of glacier movement visible and understandable for a wide public. For this study animated im-age sequences were created from freely available imim-age quick-looks of orthorectified Landsat scenes for four regions in the central Karakoram mountain range. The ani-mations play automatically in a web-browser and might help to demonstrate glacier
10
flow dynamics for educational purposes. The animations revealed highly complex pat-terns of glacier flow and surge dynamics over a 15-year time period (1998–2013). In contrast to other regions, surging glaciers in the Karakoram are often small (around 10 km2), steep, debris free, and advance for several years at comparably low annual rates (a few hundred m a−1). The advance periods of individual glaciers are generally
15
out of phase, indicating a limited climatic control on their dynamics. On the other hand, nearly all other glaciers in the region are either stable or slightly advancing, indicating balanced or even positive mass budgets over the past few years to decades.
1 Introduction
Analysis of sequential satellite images has become a common tool for deriving glacier
20
changes through time in all parts of the world. A “standard” way of documenting these changes in scientific journals is the overlay of glacier outlines from different points in time on one of the images used for the analysis (e.g. Baumann et al., 2009; Bham-bri et al., 2014; Paul et al., 2004). In the case of multiple images being available and changes mostly taking place at the glacier terminus (e.g. during an advance or retreat
25
TCD
9, 2597–2623, 2015Revealing glacier flow and surge dynamics from animated satellite image sequences
F. Paul
Title Page
Abstract Introduction
Conclusions References
Tables Figures
◭ ◮
◭ ◮
Back Close
Full Screen / Esc
Printer-friendly Version
Interactive Discussion
Discussion
P
a
per
|
Discussion
P
a
per
|
Discussion
P
a
per
|
Discussion
P
a
per
|
them (e.g. Jiskot and Juhlin, 2009) or colour coded (McNabb and Hock, 2014; Quincey et al., 2011; Rankl et al., 2014). In case of complex interactions taking place between two glaciers (e.g. a tributary is merging with another glacier or a surge is resulting in looped moraines), phases of the changes are illustrated showing sequential im-ages side-by-side (e.g. Belò et al., 2008; Bhambri et al., 2013; Copland et al., 2011;
5
Mukhopadhyay and Khan, 2014) or by two-dimensional drawings of changes in major moraine patterns (e.g. Hewitt, 2007; Meier and Post, 1969).
Although these representations of changing glaciers are scientifically sound and ex-act, they have some limitations in demonstrating what is going on. The key issue is related to the limited ability of the human brain to recognize differences between two
10
(static) images when shown side-by-side or to translate various outlines of terminus po-sitions into the correct sequence of changes, in particular when they are out of phase for a couple of glaciers. On the other hand, the human brain recognizes movement well and tends to compensate missing parts in a sequence of animated images due to the slow processing of visual information, also known as the “phi-phenomenon” (e.g.
15
MacGillivray, 2007). This also helps in translating time-lapse photography into contin-uous motion thus making the dynamic nature of otherwise slowly moving objects or natural phenomena visible (e.g. cloud development, aurora, tides). While cameras with an interval timer were not common a decade ago and related footage was rare, today’s widespread availability of webcams allows pictures to be taken remotely and
automati-20
cally each day (or any period) at regular intervals. This could be particularly interesting when glaciers are imaged, as their movement is normally much too slow to be recog-nized (e.g. www.chasingice.com).
At the satellite scale, the application of “flicker” images (basically a rapid alterna-tion of at least two images taken a few years apart) for demonstrating glacier changes
25
TCD
9, 2597–2623, 2015Revealing glacier flow and surge dynamics from animated satellite image sequences
F. Paul
Title Page
Abstract Introduction
Conclusions References
Tables Figures
◭ ◮
◭ ◮
Back Close
Full Screen / Esc
Printer-friendly Version
Interactive Discussion
Discussion
P
a
per
|
Discussion
P
a
per
|
Discussion
P
a
per
|
Discussion
P
a
per
|
With the now free availability of long time-series (starting in 1984) of orthorectified satellite imagery from Landsat (e.g. Wulder et al., 2012), it is possible to combine se-quential satellite images into longer sequences (>10 years) and demonstrate glacier flow and dynamic changes over large regions. This provides new insights into such phenomena as the mutual interaction of different glaciers, fast and slow flow of different
5
glacier segments, advance and retreat patterns, surge characteristics, down-wasting, and the dynamics of supra and pro-glacial lakes. Depending on the time step between the original images and the velocity of the glaciers, the impression of more or less continuous flow can be obtained by animating the individual images at high speed.
One of the most fascinating regions for such an application is the Karakoram
moun-10
tain range with its many surging glaciers (e.g. Copland et al., 2011; Gardelle et al., 2013; Hewitt, 2007; Rankl et al., 2014). According to Jiskoot (2011), a surging glacier oscillates between a period of slow or normal flow (for tens to hundreds of years) and an active or surge phase with flow velocities being increased by a factor of 10 to 1000 over a shorter period (a few months to years) that sometimes results in marked frontal
15
advances (km scale). All three components (time periods for both phases, velocities, terminus advance) reportedly vary over a wide range, resulting in an unclear separation from non-surge-type glaciers that might, for example, just advance over an extended period of time (Meier and Post, 1969). The surge-type behaviour often becomes evident from distortions of the normally parallel alignment of medial and/or lateral moraines.
20
Such distortions may result from the speed-up of either a specific section of a glacier or the merging of a surging tributary with the main glacier.
With this study the power of animated sequences of orthorectified satellite images is demonstrated by revealing the laminar flow of non-surge-type glaciers, the different flow patterns of surge-type glaciers, and how lakes and debris patterns on the glacier
25
TCD
9, 2597–2623, 2015Revealing glacier flow and surge dynamics from animated satellite image sequences
F. Paul
Title Page
Abstract Introduction
Conclusions References
Tables Figures
◭ ◮
◭ ◮
Back Close
Full Screen / Esc
Printer-friendly Version
Interactive Discussion
Discussion
P
a
per
|
Discussion
P
a
per
|
Discussion
P
a
per
|
Discussion
P
a
per
|
animations for educational purposes, basically for everybody interested in seeing how glaciers flow and how glaciers are changing through time. The animations use the very old (>25 years) image format GIF, which has its drawbacks in terms of the number of colours that can be used (only 256), but to my knowledge it is the only format that allows a looping of high-frequency animations with screen-size images. The format has
5
recently becoming increasingly popular on the Internet (e.g. giphy.com) for short repet-itive animations due to its easy use (no special software required) and relatively small file size.
Details of image processing are described below, followed by a discussion of what the animations reveal about glacier and landscape dynamics in four selected regions
10
in the central Karakoram. The discussion provides some initial perspectives on the interpretation of the changes.
2 Study region, data sets and methods
The study region is located in the central Karakoram mountain range to the north of and including the large and well-studied Baltoro Glacier (Fig. 1). Four regions are selected
15
for the animations: (1) Baltoro, (2) Panmah, (3) Skamri/Sarpo Laggo, and (4) Shaks-gam. All regions are well known for their many surging glaciers (for an overview see Copland et al., 2011 or Rankl et al., 2014) of which several have been studied in more detail (Diolaiuti et al., 2003; Hewitt, 2007; Quincey et al., 2011; Rankl et al., 2014). The region is characterized by very steep and high terrain (often reaching more than
20
7000 m a.s.l.) with numerous multi-basin valley glaciers, that often have further tributary glaciers in the ablation region (Iturrizaga, 2011). Several valley glaciers in this region exhibit extended periods (>10 years) of strong advance and/or fast flow (Rankl et al., 2014). The anomalous glacier behaviour in the study region (mass gain and advancing glaciers over the past two decades) relative to most other regions of the world has been
25
TCD
9, 2597–2623, 2015Revealing glacier flow and surge dynamics from animated satellite image sequences
F. Paul
Title Page
Abstract Introduction
Conclusions References
Tables Figures
◭ ◮
◭ ◮
Back Close
Full Screen / Esc
Printer-friendly Version
Interactive Discussion
Discussion
P
a
per
|
Discussion
P
a
per
|
Discussion
P
a
per
|
Discussion
P
a
per
|
number of surging glaciers in the region might have a non-climatic explanation (e.g. Hewitt, 2005; Jiskoot, 2011). Further details about the topo-climatic characteristics of the region can be found in Hewitt (2014).
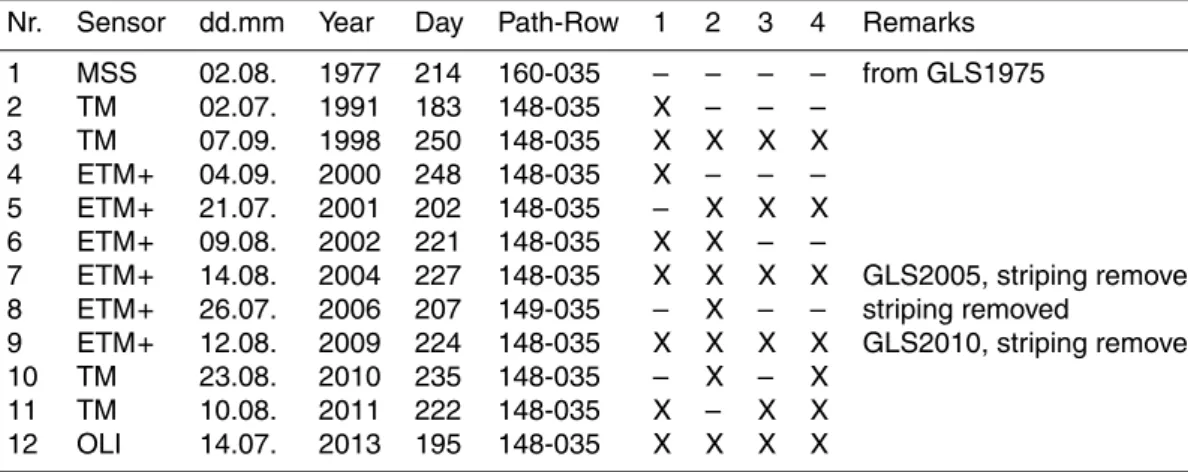
The region is completely covered by Landsat scene 148-35 (path-row) and partly also by scene 149-35 (Fig. 1). Useful Landsat scenes (sensors TM, ETM+and OLI)
5
acquired near the end of the ablation period (end of summer) are available for ten in-dividual years since 1998 and one scene from 1991 (see Table 1). A Landsat MSS scene (path-row: 160-35) from August 1977 was used to provide information on previ-ous glacier extents, but is not integrated in the animations. The scene from 1991 was only used for the Baltoro sub-region. Only the orthorectified quick-looks of all scenes
10
were downloaded from earthexplorer.usgs.gov and used for the animations. They are provided as false colour composites at the original 30 m resolution showing glaciers in light blue to cyan, clouds in white, water in dark blue, and bare terrain in pink to pur-ple. All scenes are processed in a standardized way at USGS (with colours balanced) and are provided with several extra files listing projection information and geolocation
15
for easy import into GIS software. Most images have too much snow cover to allow creation of glacier outlines for an inventory.
The animations are created by displaying all images in GIS software (e.g. QGIS, ArcMap), exporting the maps to a 24 bit image file, converting all images to gif format with xv (that has to my knowledge the best conversion of the 24 bit colour space to
20
8 bit), and creation of the animated gif image with a delay of 1/10 s usingconvertfrom ImageMagick. Annotated versions of the four sub-regions are shown in Figs. 2 to 5 for orientation and as a reference (using the 2004 scene). In general, the temporal diff er-ence between two images in the animation is two years, but sometimes (depending on cloud conditions) it is three or even more. The respective scenes used are marked in
25
TCD
9, 2597–2623, 2015Revealing glacier flow and surge dynamics from animated satellite image sequences
F. Paul
Title Page
Abstract Introduction
Conclusions References
Tables Figures
◭ ◮
◭ ◮
Back Close
Full Screen / Esc
Printer-friendly Version
Interactive Discussion
Discussion
P
a
per
|
Discussion
P
a
per
|
Discussion
P
a
per
|
Discussion
P
a
per
|
3 Results
3.1 Terminus fluctuations
A wide range of dynamic changes is visible in the animations. In sub-region (1) covering Baltoro Glacier and its numerous tributaries (Fig. 2), nearly all glaciers show laminar flow. Despite the well recognizable high velocity of the main glacier, its terminus
re-5
mains in about the same position and supra-glacial lakes on the surface come and go. There are two surge-type glaciers in the north and one in the south (Liligo), but they are too small to leave an impact on the main glacier in terms of deformed moraines. Four rather small glaciers in the south-west corner of the image (south of the Baltoro terminus) show a mixture of surging and rapid advance that has not been mentioned
10
in previous studies.
In the Panmah region (Fig. 3, sub-region 2), the most obvious features of the an-imation are the variability in late summer snow extent, and the differences between the behaviour of normal vs. fast-flowing (or surging) glaciers. While the larger tongues of Biafo, Choktoi and Nobande Sobonde (NS) glaciers show the laminar flow of
non-15
surge-type glaciers, several (partly tributary) glaciers show unsteady fast flow (i.e. ac-tive surging), partly colliding with other glaciers and creating the well-known distorted and looped moraines (see also Hewitt, 2007). The termini of many of the much smaller surrounding glaciers are either stationary or slowly advancing, i.e. in terms of past mass budgets they seem to be healthy. Also visible is the asynchronous nature of the
20
advance/retreat (or down-wasting) phases. While some glaciers had just finished their surge (before 1998), others started to surge (1st Feriole), were already in full surge mode (e.g. Shingchukpi) or began to surge later (e.g. in 2006 for Drenmang). It is also noteworthy that even fluctuations of glacier tongues with a width of only one or two pix-els at the terminus can easily be followed in the animation, also helping in identifying
25
their terminus positions.
TCD
9, 2597–2623, 2015Revealing glacier flow and surge dynamics from animated satellite image sequences
F. Paul
Title Page
Abstract Introduction
Conclusions References
Tables Figures
◭ ◮
◭ ◮
Back Close
Full Screen / Esc
Printer-friendly Version
Interactive Discussion
Discussion
P
a
per
|
Discussion
P
a
per
|
Discussion
P
a
per
|
Discussion
P
a
per
|
surging after the year 2000, others just finished their surge and showed the character-istic down-wasting with a separation of the lowermost ice mass after some years. In sub-region (3) several small but comparably long glaciers are surging and some collide with a larger main glacier (e.g. Skamri or Sarpo Laggo) becoming a tributary. A wide range of terminus advance rates is also apparent. The latter is in particular evident in
5
sub-region 4 (cf. Fig. 5) showing some very slowly advancing glaciers and others that advance rapidly. In this latter case the advancing North Crown Glacier has re-activated the ice remnants from a previous surge of a similar-sized neighbouring glacier into its own surge, resulting in a strong advance over a short period of time.
3.2 Identifying surge-type glaciers
10
It seems that neither advance rates nor flow velocities enable a clear identification of surge-type glaciers as the wide range of possible values (observed for surging glaciers) overlap with those observed at non-surge-type glaciers. Moreover, surge-type glaciers can have nearly any size and characteristic, from very small (<1 km2) and steep, to large (>10 km2) and flat. Another typical characteristic of most surge-type glaciers
15
(e.g. those not flowing into a larger main glacier from the beginning) is their elongated tongue of uniform width after a surge (compared to their original geometry) and the way this extended tongue is separated from the main glacier by thinning a few years after the surge stopped. In general, the separation occurs at about 1/4 to 1/3 of the surge length when measured from the terminus, pointing to thicker ice at the surge front
20
compared to the rest of the tongue (as ablation should be higher at lower elevations). In the animation, the post-surge separation of the ice mass in the ablation region looks like droplets that slowly separate from a dripping water tap, though for a liquid with a much higher viscosity than water.
The duration of the two surge phases (active and quiescent) varies considerably
25
TCD
9, 2597–2623, 2015Revealing glacier flow and surge dynamics from animated satellite image sequences
F. Paul
Title Page
Abstract Introduction
Conclusions References
Tables Figures
◭ ◮
◭ ◮
Back Close
Full Screen / Esc
Printer-friendly Version
Interactive Discussion
Discussion
P
a
per
|
Discussion
P
a
per
|
Discussion
P
a
per
|
Discussion
P
a
per
|
phase of only a few years for 1st Feriole Glacier. A long surge duration was also ob-served for a small valley glacier in Greenland (Jiskoot and Juhlin, 2009), but in general the surge characteristics of the glaciers in this region are different from those in Alaska or Svalbard described by Murray et al. (2003). It might thus be appropriate to introduce a new “Karakoram surge type”, having a long duration of the surge phase with slow to
5
medium advance rates of the terminus and typical surge distances of a few km. How-ever, several exceptions to this description exist even in the small region investigated here, especially for tributary glaciers that contribute to the flow of a larger main glacier anyway (e.g. Drenmang, Moni, South Skamri).
3.3 Surface elevation changes
10
On closer examination, surface elevation changes can also be followed along the lateral moraines. In sub-region 2 (Fig. 3), no elevation changes are visible for Choktoi Glacier over the 15 year-period, but surface lowering can be seen for the lower part of NS (despite the three glaciers that surged into it), Sarpo Laggo and Skamri glaciers (both in sub-region 3), and an increase is visible in the upper part of NS (above the Drenmang
15
tributary), maybe as a result of the massive 2006 surge, blocking the ice flux at this location. Surface increase and later lowering is well visible for the upper part of the Drenmang Glacier in sub-region (2) and the North-Crown Glacier in sub-region (4), more or less revealing how the surge front is moving down glacier. These regions of thickening and lowering are also visible in Fig. 9 of the study by Gardelle et al. (2013),
20
who determined elevation changes over the 2000–2008 period from DEM differencing.
3.4 Lakes and debris cover
Another form of variability can be seen for the numerous (hundreds) supra-glacial lakes and ponds covering the lower parts of Baltoro Glacier (in region 1), NS (in sub-region 2) and several other glaciers. These lakes seem to be rather short lived (about
25
TCD
9, 2597–2623, 2015Revealing glacier flow and surge dynamics from animated satellite image sequences
F. Paul
Title Page
Abstract Introduction
Conclusions References
Tables Figures
◭ ◮
◭ ◮
Back Close
Full Screen / Esc
Printer-friendly Version
Interactive Discussion
Discussion
P
a
per
|
Discussion
P
a
per
|
Discussion
P
a
per
|
Discussion
P
a
per
|
to a one-year period. Most of the lakes have about the same size but change their shape rather strongly within a year. For Baltoro Glacier it is apparent that supra-glacial lakes often form in zones of compressive flow (where larger tributaries join), indicating that surface meltwater is not efficiently drained. More stationary lakes can be seen out-side of lateral moraines, but also their size changes over time. One glacier (Mundu) in
5
sub-region (1) has regular and similar-sized patches of debris on its surface indicating periodic rock fall activity.
3.5 Accumulation region
Flow dynamics in the accumulation region are more difficult to follow due to lack of traceable features and the high variability of snow extent. However, some dynamic
fea-10
tures are visible, especially in sub-region (1) below the image centre. These features include deep crevasses and high flow velocities in the steepest parts of glacier head-walls. The flow speed here is so high that the 2–3 year time step between images fails to provide the impression of continuous flow.
3.6 Shaking terrain
15
Finally, sub-region (2) is showing locally shaking terrain, mostly along mountain peaks and ridges. This is the result of artifacts in the DEM used for orthorectification of the satellite images and that different DEMs have been used. As this shaking is concen-trated on regions outside of glaciers (i.e. “stable” terrain), an algorithm calculating flow velocity would obtain a considerable surface displacement in these regions, which need
20
TCD
9, 2597–2623, 2015Revealing glacier flow and surge dynamics from animated satellite image sequences
F. Paul
Title Page
Abstract Introduction
Conclusions References
Tables Figures
◭ ◮
◭ ◮
Back Close
Full Screen / Esc
Printer-friendly Version
Interactive Discussion
Discussion
P
a
per
|
Discussion
P
a
per
|
Discussion
P
a
per
|
Discussion
P
a
per
|
4 Discussion
4.1 Identifying surge-type glaciers
The Karakoram region is well known for its many surging glaciers, but counting them is challenging as the frequently used criteria for their identification only partly apply. The criteria can be divided into morphological and dynamic categories (e.g. Jiskoot, 2011).
5
The former include: looped or distorted medial moraines, a glacier tongue that is cov-ered by seracs during a surge, a post-surge disconnection of the tongue well behind the terminus, and rapid down-wasting after the surge with the formation of potholes and remaining stranded ice bergs (e.g. Yde and Knudsen, 2005). Dynamic criteria include (among others): the terminus advance rate, the total advance over a given
pe-10
riod, the duration of the advance and retreat (or quiescent) phase, the relative advance compared to the pre-advance glacier length, absolute values of surface velocity, sig-nificant velocity changes in specific regions of a glacier, surge periodicity, and rapid thickness changes in the ablation and accumulation regions. For these dynamic crite-ria, the values for surging glaciers can be one to three orders of magnitude higher than
15
for non-surge-type glaciers (e.g. Jiskoot, 2011). However, they can also be in a similar range thus limiting the possibilities for a clear separation.
Glaciers that have been classified as being of surge type according to the above cri-teria (typically only the morphologic approaches are used) or that have been observed to surge in the past, have also been analysed in regard to their topographic
character-20
istics (e.g. area, perimeter, length, slope, median elevation) by Clarke et al. (1986) for glaciers in the Yukon Territory and Barrand and Murray (2006) or Rankl et al. (2014) for the Karakoram. The latter two studies revealed a tendency for surge-type glaciers to be longer, less steep, and more fully debris covered than non-surge-type glaciers of similar size.
25
TCD
9, 2597–2623, 2015Revealing glacier flow and surge dynamics from animated satellite image sequences
F. Paul
Title Page
Abstract Introduction
Conclusions References
Tables Figures
◭ ◮
◭ ◮
Back Close
Full Screen / Esc
Printer-friendly Version
Interactive Discussion
Discussion
P
a
per
|
Discussion
P
a
per
|
Discussion
P
a
per
|
Discussion
P
a
per
|
most of the above criteria. They are often small (2–10 km2range) and debris free (apart from medial moraines), they have slopes ranging from flat (region 2) to steep (region 3), advance rates from slow to fast (e.g. 1st Feriole vs. Drenmang), variable morphological evidence of past surge activity (in particular the small and steep ones have none), “surge” durations from 1–2 to>15 years, and sometimes partly very short stationary
5
phases, i.e. some of them seem pulsating between two stages (e.g. Kotlyakov et al., 2008 and references therein). These differences from surging glaciers in other regions of the world might require adding a Karakoram surge-type category, and a discussion of how slow and prolonged the advance can be for it to be considered the outcome of a surge. How the behaviour of this type can be explained in terms of ice dynamics
10
might be a subject for future research.
Regarding the characteristics of the surge-type glaciers described here (small, steep, debris free) compared to those found in other studies, it seems that this is related to a yet missing but required separation of the surging glaciers from the much larger main glaciers receiving the surges (see Fig. 3 in Rankl et al., 2014). In nearly all cases, the
15
tributaries surge into a larger main glacier (e.g. Skamri, Sarpo Laggo, NS) creating the distorted and/or looped moraines on the surface. Interestingly, these larger glaciers show nearly stagnant terminus positions combined with down-wasting in the ablation region, implying that the mass contributed by the surges is not sufficient to have any effects down-glacier.
20
4.2 Climatic influences
Interpreting glacier changes in this region in climatic terms is challenging and not just because of the lack of climate data from high-elevation stations. It seems evident that nearly all glaciers (also small ones) are healthy as expressed by their either stable or advancing termini (Bhrambhatt et al., 2015; Rankl et al., 2014). This implies that past
25
condi-TCD
9, 2597–2623, 2015Revealing glacier flow and surge dynamics from animated satellite image sequences
F. Paul
Title Page
Abstract Introduction
Conclusions References
Tables Figures
◭ ◮
◭ ◮
Back Close
Full Screen / Esc
Printer-friendly Version
Interactive Discussion
Discussion
P
a
per
|
Discussion
P
a
per
|
Discussion
P
a
per
|
Discussion
P
a
per
|
tions, these glaciers might not show elevation changes that can be measured reliably using satellite data or repeat DEMs as they are too small. On the other hand, trend analysis of ICESat data (Gardner et al., 2013; Kääb et al., 2012) and volume changes derived from DEM differencing (Gardelle et al., 2013) reveal substantial thickening in the ablation area for most of the larger actively surging glaciers, consistent with the
5
here reported changes. As the measured mass gain of these glaciers (the mass loss in the accumulation region is more difficult to quantify) is over a longer term in fact a mass loss, it would be more safe to exclude these glaciers from climate change impact stud-ies if these are related to time scales shorter than a full surge cycle.
4.3 Repeat surges
10
Many of the glaciers in the study region have reportedly surged during the past cen-tury (cf. Copland et al., 2011) and historic satellite imagery (e.g. the MSS scene from 1977) reveals different extents of the surge-type glaciers analysed here. For exam-ple, 1st Feriole Glacier was in contact to Panmah Glacier back in 1977 and the high-resolution satellite image from 6. June 2014 available in Google Earth (Fig. 6) reveals
15
that the glacier is still in full surge mode and might again re-establish contact with Pan-mah Glacier in two or three years, resulting in a ca. 40 year surge cycle. A tributary of Sarpo Laggo Glacier in sub-region 3 (Nr. 45 in Copland et al., 2011; Nr. 16 in Rankl et al., 2014) had been in contact with the main glacier back in 1977, 1991 and again in 2007, resulting in a ca. 15-year cycle. In Fig. 7 an image of its surge front from
20
July 2006 is shown, about 1.5 years before the glacier came in contact with Sarpo Laggo Glacier. It would be interesting to analyse if surges occur regularly also for other glaciers in the region.
4.4 Special image conditions
Finally, it has to be noted that animations like the ones presented here over a period
25
TCD
9, 2597–2623, 2015Revealing glacier flow and surge dynamics from animated satellite image sequences
F. Paul
Title Page
Abstract Introduction
Conclusions References
Tables Figures
◭ ◮
◭ ◮
Back Close
Full Screen / Esc
Printer-friendly Version
Interactive Discussion
Discussion
P
a
per
|
Discussion
P
a
per
|
Discussion
P
a
per
|
Discussion
P
a
per
|
2004, 2006, and 2009 (see Table 1), all normally suffering from severe striping due to the malfunction of the ETM+ scan line corrector since 2003. Luckily, this striping has been reduced to a large extent (some artefacts are still visible) by USGS for these scenes, likely by replacing the missing information from other scenes. Surprisingly, this had no noticeable effect on the boundaries or surface features of the quickly changing
5
glaciers, e.g. due to clouds or different snow conditions. It implies that great care has been taken to correct the striping in these three scenes (e.g. two of the ETM+scenes are also in the Global Land Survey dataset of 2005 and 2010 and have been processed in this way) and/or that the replacement scenes were acquired close to the date of the corrected scenes, for example by Landsat TM.
10
Another important issue is the high-quality and consistent orthorectification of all satellite scenes by USGS. Although in sub-region (2) some mountains shake due to differences in the DEMs used for the correction, such effects are not noticeable in the other sub-regions, i.e. they stay within one pixel. Without this consistency it would not be possible to reveal glacier flow dynamics with such clarity.
15
4.5 Educational use of the animations
There is certainly some potential for using the animations also for educational pur-poses, for example regarding the displayed dynamic changes (glaciers, snow line, lakes, rivers). This requires knowledge about the number of scenes used and the time period covered (see Table 1). Remote sensing related questions might focus on the
20
spectral properties of ice and snow and the false colour composites used (resulting in well-visible glaciers), spatial resolution and visibility of details, or the value of long-term time series and free data availability. The latter might be further explored in summer schools (e.g. Manakos et al., 2007) or classroom experiments (e.g. creating animations for other regions or with a different speed), as all image quick-looks that have been used
25
TCD
9, 2597–2623, 2015Revealing glacier flow and surge dynamics from animated satellite image sequences
F. Paul
Title Page
Abstract Introduction
Conclusions References
Tables Figures
◭ ◮
◭ ◮
Back Close
Full Screen / Esc
Printer-friendly Version
Interactive Discussion
Discussion
P
a
per
|
Discussion
P
a
per
|
Discussion
P
a
per
|
Discussion
P
a
per
|
5 Conclusions
This study discussed and presented (in the Supplement) animated satellite image se-quences from four regions in the Karakoram mountain range. The high-repetition rate of 1/10 s per frame gives the impression of a continuous flow and reveals the high variability in flow dynamics among the different glaciers with a clarity that is not
possi-5
ble from static images (side-by-side comparison) or colour coded glacier outlines from different points in time. Though changes are not determined in a quantitative way, the animations are likely of particular interest for educational purposes as the time-lapse mode reveals changes that are otherwise difficult to observe. Such animations might also be created for other regions in the world to reveal glaciers dynamics and
interac-10
tions.
Whereas the largest and often debris-covered glaciers in the region (e.g. Baltoro, Bi-afo, Choktoi, Sarpo Laggo) show normal (laminar) flow characteristics, their tributaries and several small to medium-sized (and often debris free) glaciers show unstable flow with surge-like dynamics. The latter glaciers exhibit a continuum of terminus advance
15
rates, surge and quiescent phase durations as well as mean surface slopes that dif-fer from descriptions of surge-type glaciers in regions such as Alaska or Svalbard. In particular, the smaller surge-type glaciers often show no morphological evidence of surging such as looped or distorted medial moraines and their surges can only be rec-ognized through time-series image analysis. Several of the larger glaciers with often
20
completely debris-covered tongues (e.g. Nobande Sobonde, Sarpo Laggo, Skamri, K2 Glacier) have stationary fronts and show considerable surface lowering, despite the mass contributions from the surging tributaries. The study revealed that these large main glaciers are not surging themselves but get distorted in their flow by their surging tributaries.
25
TCD
9, 2597–2623, 2015Revealing glacier flow and surge dynamics from animated satellite image sequences
F. Paul
Title Page
Abstract Introduction
Conclusions References
Tables Figures
◭ ◮
◭ ◮
Back Close
Full Screen / Esc
Printer-friendly Version
Interactive Discussion
Discussion
P
a
per
|
Discussion
P
a
per
|
Discussion
P
a
per
|
Discussion
P
a
per
|
time scale (e.g. elevation changes from DEM differencing). Several further geomorpho-logic changes are visible (e.g. short-lived supra-glacial lakes, variability of river beds, thickening and thinning of glaciers, regions of fast and slow flow, contribution of trib-utaries) that might be of interest for a more detailed analysis. The time series will certainly become more valuable in the future with further satellite scenes being added.
5
The Supplement related to this article is available online at doi:10.5194/tcd-9-2597-2015-supplement.
Acknowledgements. This study has been performed in the framework of the ESA project Glaciers_cci (4000109873/14/I-NB). All Landsat data were provided by USGS from earthexplorer.usgs.gov. S. Allen, P. Rastner and the scientific editor M. Sharp provided helpful
10
comments to improve the manuscript.
References
Barrand, N. E. and Murray, T.: Multivariate controls on the incidence of glacier surging in the Karakoram Himalaya, Arct. Antarct. Alp. Res., 38, 489–498, 2006.
Baumann, S., Winkler, S., and Andreassen, L. M.: Mapping glaciers in Jotunheimen,
South-15
Norway, during the ”Little Ice Age” maximum, The Cryosphere, 3, 231–243, doi:10.5194/tc-3-231-2009, 2009.
Belò, M., Mayer, C., Smiraglia, C., and Tamburini, A.: The recent evolution of Liligo glacier, Karakoram, Pakistan, and its present quiescent phase, Ann. Glaciol., 48, 171–176, 2008. Brahmbhatt, R. M., Bahuguna, I. M., Rathore, B. P., Singh, S. K., Rajawat, A. S., Shah, R. D.,
20
and Kargel, J. S.: Satellite monitoring of glaciers in the Karakoram from 1977 to 2013: an overall almost stable population of dynamic glaciers, The Cryosphere Discuss., 9, 1555– 1592, doi:10.5194/tcd-9-1555-2015, 2015.
Bolch, T., Kulkarni, A., Kääb, A., Huggel, C., Paul, F., Cogley, J. G., Frey, H., Kargel, J. S., Fujita, K., and Scheel, M.: The state and fate of Himalayan glaciers, Science, 336, 310–314,
25
TCD
9, 2597–2623, 2015Revealing glacier flow and surge dynamics from animated satellite image sequences
F. Paul
Title Page
Abstract Introduction
Conclusions References
Tables Figures
◭ ◮
◭ ◮
Back Close
Full Screen / Esc
Printer-friendly Version
Interactive Discussion
Discussion
P
a
per
|
Discussion
P
a
per
|
Discussion
P
a
per
|
Discussion
P
a
per
|
Clarke, G. K. C., Schmok, J. P., Ommanney, C. S. L., and Collins, S. G.: Characteristics of surge-type glaciers, J. Geophys. Res., 91, 7165–7180, 1986.
Copland, L., Sylvestre, T., Bishop, M. P., Shroder, J. F., Seong, Y. B., Owen, L. A., Bush, A., and Kamp, U.: Expanded and recently increased glacier surging in the Karakoram, Arct. Antarct. Alp. Res., 43, 503–516, 2011.
5
Diolaiuti, G., Pecci, M., and Smiraglia, C.: Liligo Glacier, Karakoram, Pakistan: a reconstruction of the recent history of a surge-type glacier, Ann. Glaciol., 36, 168–172, 2003.
Gardelle, J., Berthier, E., and Arnaud, Y.: Slight mass gain of Karakoram glaciers in the early twenty-first century, Nat. Geosci., 5, 322–325, 2012.
Gardelle, J., Berthier, E., Arnaud, Y., and Kääb, A.: Region-wide glacier mass balances
10
over the Pamir-Karakoram-Himalaya during 1999–2011, The Cryosphere, 7, 1263–1286, doi:10.5194/tc-7-1263-2013, 2013.
Gardner, A. S., Moholdt, G., Cogley, J. G., Wouters, B., Arendt, A. A., Wahr, J., Berthier, E., Hock, R., Pfeffer, W. T., Kaser, G., Ligtenberg, S. R. M., Bolch, T., Sharp, M. J., Hagen, J. O., van den Broecke, M. R., and Paul, F.: A consensus estimate of glacier contributions to sea
15
level rise: 2003 to 2009, Science, 340, 852–857, 2013.
Hewitt, K.: Glaciers receive a surge of attention in the Karakoram Himalaya, EOS T. Am. Geo-phys. Un., 79, 104–105, 1998.
Hewitt, K.: The Karakoram Anomaly? Glacier expansion and the “Elevation Effect”, Karakoram Himalaya, Mt. Res. Dev., 25, 332–340, 2005.
20
Hewitt, K.: Tributary glacier surges: an exceptional concentration at Panmah Glacier, Karako-ram Himalaya, J. Glaciol., 53, 181–188, 2007.
Hewitt, K.: Glaciers of the Karakoram Himalaya. Glacial Environments, Processes, Hazards and Resources, Springer, Dordrecht, 2014.
Iturrizaga, L.: Trends in 20th century and recent glacier fluctuations in the Karakoram
Moun-25
tains, Z. Geomorphol., 55, 205–231, 2011.
Janes, T. J. and Bush, A. B. G.: The role of atmospheric dynamics and climate change on the possible fate of glaciers in the Karakoram, J. Climate, 25, 8308–8327, 2012.
Jiskoot, H.: Glacier surging, in: : Encyclopedia of Snow, Ice and Glaciers, edited by: Singh, V. P., Singh, P., and Haritashya, U. K., Springer, Heidelberg, 415–428, 2011.
30
TCD
9, 2597–2623, 2015Revealing glacier flow and surge dynamics from animated satellite image sequences
F. Paul
Title Page
Abstract Introduction
Conclusions References
Tables Figures
◭ ◮
◭ ◮
Back Close
Full Screen / Esc
Printer-friendly Version
Interactive Discussion
Discussion
P
a
per
|
Discussion
P
a
per
|
Discussion
P
a
per
|
Discussion
P
a
per
|
Jiskoot, H., Murray, T., and Boyle, P. J.: Controls on the distribution of surge-type glaciers in Svalbard, J. Glaciol., 46, 412–422, 2000.
Kääb, A.: Combination of SRTM3 and repeat ASTER data for deriving alpine glacier flow ve-locities in the Bhutan Himalaya, Remote Sens. Environ., 94, 463–474, 2005.
Kääb, A. and Vollmer, M.: Surface geometry, thickness changes and flow fields on creeping
5
mountain permafrost: automatic extraction by digital image analysis, Permafrost Periglac., 11, 315–326, 2000.
Kääb, A., Isakowski, Y., Paul, F., Neumann, A., and Winter, R.: Glaziale und periglaziale Prozesse: Von der statischen zur dynamischen Visualisierung, Kartographische Nachrichten, 53, 206–212, 2003.
10
Kääb, A., Berthier, E., Nuth, C., Gardelle, J., and Arnaud, Y.: Contrasting patterns of early twenty-first-century glacier mass change in the Himalayas, Nature, 488, 495–498, 2012. Kotlyakov, V. M., Osipova, G. B., and Tsvetkov, D. G.: Monitoring surging glaciers of the Pamirs,
central Asia, from space, Ann. Glaciol., 48, 125–134, 2008.
MacGillivray, C.: How Psychophysical perception of motion and image relates to animation
prac-15
tice, in: IEEE 4th International Conference on Computer Graphics, Imaging and Visualization (CGIV 2007), 14–16 August 2007, Bangkok, Thailand, 81–88, 2007.
McNabb, R. and Hock, R.: Alaska tidewater glacier terminus positions, 1948–2012, J. Geophys. Res., F119, 153–167, 2014.
Meier, M. F. and Post, A.: What are glacier surges?, Can. J. Earth Sci., 6, 807–817, 1969.
20
Mukhopadhyay, B. and Khan, A.: Rising river flows and glacial mass balance in central Karako-ram, J. Hydrol., 513, 192–203, 2014.
Murray, T., Strozzi, T., Luckman, A., Jiskoot, H., and Christakos, P.: Is there a single surge mechanism? Contrasts in dynamics between glacier surges in Svalbard and other regions, J. Geophys. Res., 108, 2237, doi:10.1029/2002JB001906, 2003.
25
Paul, F., Kääb, A., Maisch, M., Kellenberger, T. W., and Haeberli, W.: Rapid disintegra-tion of Alpine glaciers observed with satellite data, Geophys. Res. Lett., 31, L21402, doi:10.1029/2004GL020816, 2004.
Paul, F., Bolch, T., Kääb, A., Nagler, T., Nuth, C., Scharrer, K., Shepherd, A., Strozzi, T., Tic-coni, F., Bhambri, R., Berthier, E., Bevan, S., Gourmelen, N., Heid, T., Jeong, S., Kunz, M.,
30
TCD
9, 2597–2623, 2015Revealing glacier flow and surge dynamics from animated satellite image sequences
F. Paul
Title Page
Abstract Introduction
Conclusions References
Tables Figures
◭ ◮
◭ ◮
Back Close
Full Screen / Esc
Printer-friendly Version
Interactive Discussion
Discussion
P
a
per
|
Discussion
P
a
per
|
Discussion
P
a
per
|
Discussion
P
a
per
|
algorithms for creating glacier area, elevation change and velocity products, Remote Sens. Environ., in press, 2015.
Quincey, D. J., Braun, M., Glasser, N. F., Bishop, M. P., Hewitt, K., and Luckman, A.: Karako-ram glacier surge dynamics, Geophys. Res. Lett., 38, L18504, doi:10.1029/2011GL049004, 2011.
5
Racoviteanu, A. E., Paul, F., Raup, B., Khalsa, S. J. S., and Armstrong, R.: Challenges and rec-ommendations in mapping of glacier parameters from space: results of the 2008 Global Land Ice Measurements from Space (GLIMS) workshop, Boulder, Colorado, USA, Ann. Glaciol., 50, 53–69, 2010.
Rankl, M., Kienholz, C., and Braun, M.: Glacier changes in the Karakoram region mapped
10
by multimission satellite imagery, The Cryosphere, 8, 977–989, doi:10.5194/tc-8-977-2014, 2014.
Raymond, C. F.: How do glaciers surge? A review, J. Geophys. Res., 92, 9121–9134, 1987. Scambos, T. A., Dutkiewicz, M. J., Wilson, J. C., and Bindschadler, R. A.: Application of image
cross-correlation to the measurement of glacier velocity using satellite image data, Remote
15
Sens. Environ., 42, 177–186, 1992.
Wulder, M. A., Masek, J. G., Cohen, W. B., Loveland, T. R., and Woodcock, C. E.: Opening the archive: how free data has enabled the science and monitoring promise of Landsat, Remote Sens. Environ., 122, 2–10, 2012.
Yde, J. C. and Knudsen, N. T.: Glaciological features in the initial quiescent phase of
Kuanner-20
TCD
9, 2597–2623, 2015Revealing glacier flow and surge dynamics from animated satellite image sequences
F. Paul
Title Page
Abstract Introduction
Conclusions References
Tables Figures
◭ ◮
◭ ◮
Back Close
Full Screen / Esc
Printer-friendly Version
Interactive Discussion
Discussion
P
a
per
|
Discussion
P
a
per
|
Discussion
P
a
per
|
Discussion
P
a
per
|
Table 1.Overview of the Landsat scenes used to create the animations (Nr. 2–14) for the four sub-regions shown in Figs. 2 to 5. The MSS scene is added for completeness. Abbreviations: Sensor column: MSS: MultiSpectral Scanner, TM: Thematic Mapper, ETM+: Enhanced The-matic Mapper+, OLI: Operational Land Imager, dd.mm: day.month, Day: day number within a year, region codes in columns 7–10 denote 1: Baltoro, 2: Panmah, 3: Skamri, 4: Shaksgam, GLS: Global Land Survey.
Nr. Sensor dd.mm Year Day Path-Row 1 2 3 4 Remarks 1 MSS 02.08. 1977 214 160-035 – – – – from GLS1975 2 TM 02.07. 1991 183 148-035 X – – –
3 TM 07.09. 1998 250 148-035 X X X X 4 ETM+ 04.09. 2000 248 148-035 X – – – 5 ETM+ 21.07. 2001 202 148-035 – X X X 6 ETM+ 09.08. 2002 221 148-035 X X – –
7 ETM+ 14.08. 2004 227 148-035 X X X X GLS2005, striping removed 8 ETM+ 26.07. 2006 207 149-035 – X – – striping removed
9 ETM+ 12.08. 2009 224 148-035 X X X X GLS2010, striping removed 10 TM 23.08. 2010 235 148-035 – X – X
TCD
9, 2597–2623, 2015Revealing glacier flow and surge dynamics from animated satellite image sequences
F. Paul
Title Page
Abstract Introduction
Conclusions References
Tables Figures
◭ ◮
◭ ◮
Back Close
Full Screen / Esc
Printer-friendly Version
Interactive Discussion
Discussion
P
a
per
|
Discussion
P
a
per
|
Discussion
P
a
per
|
Discussion
P
a
per
|
586
Figure 1.Landsat scene (pan-band) of the study region showing footprints of the four sub-regions depicted in Figs. 2 to 5. The green square in the inset shows the approximate location of the study region (map taken from www.worldmapsonline.com). Image centre is at 36◦N, and
76.3◦E.
TCD
9, 2597–2623, 2015Revealing glacier flow and surge dynamics from animated satellite image sequences
F. Paul
Title Page
Abstract Introduction
Conclusions References
Tables Figures
◭ ◮
◭ ◮
Back Close
Full Screen / Esc
Printer-friendly Version
Interactive Discussion
Discussion
P
a
per
|
Discussion
P
a
per
|
Discussion
P
a
per
|
Discussion
P
a
per
|
Figure 2.Sub-region 1 (Baltoro) shows the tongue of Baltoro Glacier and its surrounding trib-utaries. SG (orange): actively surging glacier, SG (white): surge-type glacier, A: advancing glacier. The Landsat scene 148-035 is from 14 August 2004.
TCD
9, 2597–2623, 2015Revealing glacier flow and surge dynamics from animated satellite image sequences
F. Paul
Title Page
Abstract Introduction
Conclusions References
Tables Figures
◭ ◮
◭ ◮
Back Close
Full Screen / Esc
Printer-friendly Version
Interactive Discussion
Discussion
P
a
per
|
Discussion
P
a
per
|
Discussion
P
a
per
|
Discussion
P
a
per
|
21
TCD
9, 2597–2623, 2015Revealing glacier flow and surge dynamics from animated satellite image sequences
F. Paul
Title Page
Abstract Introduction
Conclusions References
Tables Figures
◭ ◮
◭ ◮
Back Close
Full Screen / Esc
Printer-friendly Version
Interactive Discussion
Discussion
P
a
per
|
Discussion
P
a
per
|
Discussion
P
a
per
|
Discussion
P
a
per
|
22
TCD
9, 2597–2623, 2015Revealing glacier flow and surge dynamics from animated satellite image sequences
F. Paul
Title Page
Abstract Introduction
Conclusions References
Tables Figures
◭ ◮
◭ ◮
Back Close
Full Screen / Esc
Printer-friendly Version
Interactive Discussion
Discussion
P
a
per
|
Discussion
P
a
per
|
Discussion
P
a
per
|
Discussion
P
a
per
|
Figure 6.The still advancing (surging) tongue of 1st Feriole Glacier in the Panmah sub-region. The image is a screenshot from Google Maps acquired on 6 June 2014.
TCD
9, 2597–2623, 2015Revealing glacier flow and surge dynamics from animated satellite image sequences
F. Paul
Title Page
Abstract Introduction
Conclusions References
Tables Figures
◭ ◮
◭ ◮
Back Close
Full Screen / Esc
Printer-friendly Version
Interactive Discussion
Discussion
P
a
per
|
Discussion
P
a
per
|
Discussion
P
a
per
|
Discussion
P
a
per
|