BGD
12, 10679–10706, 2015
Impacts of prescribed burning on soil greenhouse
gas fluxes
Y. Zhao et al.
Title Page
Abstract Introduction
Conclusions References
Tables Figures
◭ ◮
◭ ◮
Back Close
Full Screen / Esc
Printer-friendly Version Interactive Discussion
Discussion
P
a
per
|
Discussion
P
a
per
|
Discussion
P
a
per
|
Discussion
P
a
per
|
Biogeosciences Discuss., 12, 10679–10706, 2015 www.biogeosciences-discuss.net/12/10679/2015/ doi:10.5194/bgd-12-10679-2015
© Author(s) 2015. CC Attribution 3.0 License.
This discussion paper is/has been under review for the journal Biogeosciences (BG). Please refer to the corresponding final paper in BG if available.
Impacts of prescribed burning on soil
greenhouse gas fluxes in a suburban
native forest of south-eastern
Queensland, Australia
Y. Zhao1,2,*, Y. Z. Wang1,3,*, Z. H. Xu1, and L. Fu1,4
1
Environmental Futures Research Institute and School of Natural Sciences, Griffith University, Nathan, Brisbane, Queensland 4111, Australia
2
Institute of Geographical Sciences and Natural Resources Research, Chinese Academy of Sciences, Beijing, 100101, China
3
Key Laboratory of Pollution Processes and Environmental Criteria, College of Environmental Science and Engineering, Nankai University, Tiantjin 300071, China
4
Key Laboratory of Digital Earth Science, Institute of Remote Sensing and Digital Earth, Chinese Academy of Sciences, Beijing 100101, China
*
These authors contributed equally to this work.
BGD
12, 10679–10706, 2015
Impacts of prescribed burning on soil greenhouse
gas fluxes
Y. Zhao et al.
Title Page
Abstract Introduction
Conclusions References
Tables Figures
◭ ◮
◭ ◮
Back Close
Full Screen / Esc
Printer-friendly Version Interactive Discussion
Discussion
P
a
per
|
Discussion
P
a
per
|
Discussion
P
a
per
|
Discussion
P
a
per
|
Received: 15 June 2015 – Accepted: 20 June 2015 – Published: 09 July 2015
Correspondence to: Z. H. Xu ([email protected])
Published by Copernicus Publications on behalf of the European Geosciences Union.
BGD
12, 10679–10706, 2015
Impacts of prescribed burning on soil greenhouse
gas fluxes
Y. Zhao et al.
Title Page
Abstract Introduction
Conclusions References
Tables Figures
◭ ◮
◭ ◮
Back Close
Full Screen / Esc
Printer-friendly Version Interactive Discussion
Discussion
P
a
per
|
Discussion
P
a
per
|
Discussion
P
a
per
|
Discussion
P
a
per
|
Abstract
Prescribed burning is a forest management practice that is widely used in Australia to reduce the risk of damaging wildfires. It can affect both carbon (C) and nitrogen (N) cycling in the forest and thereby influence the soil–atmosphere exchange of major greenhouse gases, i.e. carbon dioxide (CO2), methane (CH4) and nitrous oxide (N2O).
5
To quantify the impact of a prescribed burning (conducted on 27 May 2014) on green-house gas exchange and the potential controlling mechanisms, we carried out a series of field measurements before (August 2013) and after (August 2014 and November 2014) the fire. Gas exchange rates were determined at 4 replicate sites which were burned during the combustion and another 4 adjacent unburned sites located in green
10
islands, using a set of static chambers. Surface soil properties including temperature, pH, moisture, soil C and N pools were also determined either by in situ measurement or by analysing surface 10 cm soil samples. All of the chamber measurements indi-cated a net sink of atmospheric CH4, with mean CH4 uptake ranging from 1.15 to 1.99 mg m−2day−1. The burning significantly enhanced CH
4uptake as indicated by the
15
significant higher CH4uptake rates at the burned sites measured in August 2014. While within the next 3 months the CH4 uptake rate was recovered to pre-burning levels. Mean CO2emission from forest soils ranged from 2721.76 to 7113.49 mg m−2day−1. The effect of prescribed burning on CO2emission was limited within the first 3 months, as no significant difference was observed between the burned and the adjacent
un-20
burned sites in both August and November 2014. The temporal dynamics of the CO2 emission presented more seasonal variations, rather than burning effects. The N2O emission at the studied sites was quite low, and no significant impact of burning was observed. The changes in understory plants and litter layers, surface soil temperature, C and N substrate availability and microbial activities, resulting from the burning, were
25
the factors that controlled the greenhouse gas exchanges. Our results suggested that the low intensity prescribed burning would decrease soil CO2 emission and increase CH4 uptake, however, this effect would be present within a relative short period. Only
BGD
12, 10679–10706, 2015
Impacts of prescribed burning on soil greenhouse
gas fluxes
Y. Zhao et al.
Title Page
Abstract Introduction
Conclusions References
Tables Figures
◭ ◮
◭ ◮
Back Close
Full Screen / Esc
Printer-friendly Version Interactive Discussion
Discussion
P
a
per
|
Discussion
P
a
per
|
Discussion
P
a
per
|
Discussion
P
a
per
|
slight changes in the surface soil during the combustion and very limited damages in the mineral soils supported the quick recovery of the greenhouse gas exchange rates.
1 Introduction
As the result of continuously increasing greenhouse gas emissions, global climate change studies have predicted a drier future with high probability of increasing
temper-5
atures, lower average rainfall and increase in the frequency and severity of droughts and extreme weather events (Zhao et al., 2013; Sherwood and Fu, 2014; Fu et al., 2015). As for Australia, climate changes were also identified as key drivers of the in-creases in days with high fire risk weather and probability of severe wildfires (Murphy and Timbal, 2008; Fest, 2013). In response to these predictions, the use of prescribed
10
burning is increased in Australia forest management to protect both native and planta-tion forests from the risk of damaging wildfires (Wang et al., 2014). The burns are gen-erally targeted at the understorey vegetation and surface litters, while aiming for mini-mum damage to overstorey trees. Despite the controlled burning conditions, prescribed burning can still have significant effects on altering environmental factors including soil
15
water content and soil temperature. The combustion event would also result in amounts of charcoal and dying tree roots (Kim et al., 2011; Sullivan et al., 2011) and therefore altering root activities, decomposition of organic matters, availability of substrate and soil N dynamics (Weber, 1990; Certini, 2005; Livesley et al., 2011; Wang et al., 2014). All these parameters are closely related to three major greenhouse gas exchanges at
20
soil–atmosphere interface, namely carbon dioxide (CO2), methane (CH4) and nitrous oxide (N2O). Studies have paid special attentions to soil CO2, CH4and N2O fluxes, not only because of the warming effect caused by CO2, CH4and N2O in the atmosphere globally (Zhao et al., 2013; Sherwood and Fu, 2014), but also because of their use as very effective indicators for evaluating soil C and N pools and soil microbial
activi-25
ties (Weber, 1990). Many studies have been conducted to quantify CO2, CH4and N2O exchanges at forest soil–atmosphere interface and the impact of intensive wildfires of
BGD
12, 10679–10706, 2015
Impacts of prescribed burning on soil greenhouse
gas fluxes
Y. Zhao et al.
Title Page
Abstract Introduction
Conclusions References
Tables Figures
◭ ◮
◭ ◮
Back Close
Full Screen / Esc
Printer-friendly Version Interactive Discussion
Discussion
P
a
per
|
Discussion
P
a
per
|
Discussion
P
a
per
|
Discussion
P
a
per
|
different climate regions, but very few works have reported the effects of prescribed burning on soil greenhouse gas emission, especially in Australia.
The CO2 is the primary greenhouse gas and account for a major part of anticipated global warming (Sommerfeld et al., 1993). Within the forest ecosystem, soil is the major C reservoir while soil respiration is an important mechanism that releases the fixed C
5
into atmosphere (Seidl et al., 2014). Forest fires are generally reported to decrease soil CO2 efflux (Weber, 1990; Burke et al., 1997; Kim et al., 2011; Livesley et al., 2011). The reported driving factors of fires on CO2efflux are the changes in soil temperature, moisture and fine root activities. As temperature and moisture reflect the seasonal variations in CO2emissions, reduced fine root activities after fires are more responsible
10
for the decreased CO2 (Kim et al., 2011; Sullivan et al., 2011). Sullivan et al. (2011) also concluded that reduced microbial respiration indicated by microbial biomass after burning could further contribute to the decreased CO2efflux.
The CH4is the second most important greenhouse gas forcing climate change, with a global warming potential of 25 times greater than CO2. Aerated forest soils are one
15
of the most important biological sink of CH4as the results of oxidation of atmospheric CH4 by methanotrophic bacteria. Studies have reported both positive (Livesley et al., 2011; Sullivan et al., 2011; Fest, 2013) and no significant impacts of fires on forest soil CH4 uptake (Kim et al., 2011). Since soil gas diffusivity is one of the key regulators of soil CH4 uptake in the forest soil system, the burning altered soil moisture condition,
20
removal of litter layer and soil O horizon would weaken or eliminate the barrier effect of the surface soil and thereby increase diffusion of CH4into soil profile (Sullivan et al., 2011; Fest, 2013).
The N2O emission is less reported in forest soil studies, despite the greater cli-mate warming potential of N2O than CO2and CH4and the large contribution of forest
25
soil N2O emission to the global atmospheric N2O budget (Kiese and Butterbach-Bahl, 2002; Kiese et al., 2003). Fires would affect soil N2O emission by altering the rates of nitrification and denitrificaiton processes but few published studies have reported inconsistent results. Fires could change forest soil N storages but the mechanism of
BGD
12, 10679–10706, 2015
Impacts of prescribed burning on soil greenhouse
gas fluxes
Y. Zhao et al.
Title Page
Abstract Introduction
Conclusions References
Tables Figures
◭ ◮
◭ ◮
Back Close
Full Screen / Esc
Printer-friendly Version Interactive Discussion
Discussion
P
a
per
|
Discussion
P
a
per
|
Discussion
P
a
per
|
Discussion
P
a
per
|
driving N2O emission changes is unclear (Certini, 2005; Nave et al., 2011). Available N substrate (Kiese et al., 2003), soil moisture and temperature (Fest et al., 2009), water filled pore space (Kiese and Butterbach-Bahl, 2002) and stand conditions (Butterbach-Bahl et al., 1997) are potential factors which could affect N2O emission rates.
The eucalypt dominated forest ecosystem studied in this experiment is quite typical
5
across most of Australia’s forest areas, with a total of 92 million ha or 74 % of Aus-tralia’s forest area (Department of Agriculture, http://www.agriculture.gov.au/abares/ forestsaustralia/profiles/eucalypt-forest). These forests hold important C storage over the country and also provide important ecosystem services such as biodiversity, recre-ation, water resource and wood products (Fest et al., 2009). Prescribed burning is
10
one of the most important management tools in Australia to protect these forests from firestorm and maintain their functions, including forest regeneration, site preparation, fuel reduction and habitat management (Guinto et al., 2000; Bai et al., 2012; Wang et al., 2014). Some studies have reported the greenhouse gas emissions from Aus-tralia forest soils (Kiese and Butterbach-Bahl, 2002; Dalal et al., 2003), but the impact
15
of prescribed burning on Australian eucalyptus forests are rarely studied. Therefore, we have limited understanding about the magnitude and direction of the effect of burn-ing on the greenhouse gas exchange which is critical to understand the interaction between burned ecosystem and the atmosphere. In this study, we setup four sampling sites which had similar stand conditions to address the following questions: (1) would
20
prescribed fire affect greenhouse gas emissions at the soil atmosphere interface? (2) And if so, how long would these effects last? (3) What would be the controlling factors? To address these questions, we conducted a series of field measurements of CH4, CO2 and N2O exchange at surface soil before and after a prescribed burning. To examine the potential driving factors and mechanisms we also collected surface soil samples
25
for analysing biological, chemical and physical variables which might be altered by the burning.
BGD
12, 10679–10706, 2015
Impacts of prescribed burning on soil greenhouse
gas fluxes
Y. Zhao et al.
Title Page
Abstract Introduction
Conclusions References
Tables Figures
◭ ◮
◭ ◮
Back Close
Full Screen / Esc
Printer-friendly Version Interactive Discussion
Discussion
P
a
per
|
Discussion
P
a
per
|
Discussion
P
a
per
|
Discussion
P
a
per
|
2 Methods
2.1 Site description
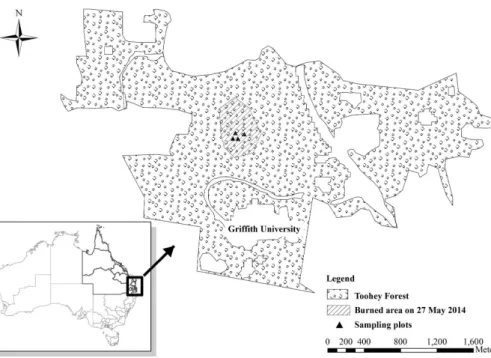
The study was carried out in Toohey Forest (27◦30′S, 135◦02′E), located 10 km south of Brisbane in south-eastern Queensland, Australia (Fig. 1). This forest accounts for about 600 ha dominated by different species of eucalypt and contains some 460
5
species of vascular plants. About half of this forest is a local government conserva-tion reserve and surrounded by suburban areas (Catterall and Wallace, 1987; Catterall et al., 2001; Farmer et al., 2004). The climate for the region and around is character-ized as subtropical with a dominant weather pattern of hot, wet summers and cool, dry winters. The mean annual rainfall is about 1000 mm, with the majority received during
10
winter months. Temperatures generally ranged between approximately 30 and 35◦C in summer and 10 and 15◦C in winter.
Patterns of burning prior to the 1950s are unknown, but from the 1950s to the early 1970s, individual fires probably burned across a large proportion of the area. From the early 1970s individual fires were confined to more localized areas and created a
spa-15
tially heterogeneous fire regime. Since 1993, 27 blocks within Toohey Forest has been conducted regular burnings (Wang et al., 2015). Prescribed burnings are generally low intensity cool burns, and usually occur at the end of the dry season in winter. Gener-ally, every burning event would last for several hours (usually overnight) from ignition to extinguishing of any small fires. The fire was monitored and controlled during the
20
burning. The burning related with this study was conducted on 27 May 2014. Before the burning, we selected 4 sites with similar stand conditions for sampling. The under-story of these sites was burned out during the burning, left a layer of wood charcoal on the ground. After the burning, these 4 sites were measured repeatedly at three months (August 2014) and six months (November 2014) later. Additionally, another 4 unburned
25
sites were selected to further examine the impacts of burning. These sites were located in some adjacent green islands of those not touched by the burning and were near the existing four burned sites.
BGD
12, 10679–10706, 2015
Impacts of prescribed burning on soil greenhouse
gas fluxes
Y. Zhao et al.
Title Page
Abstract Introduction
Conclusions References
Tables Figures
◭ ◮
◭ ◮
Back Close
Full Screen / Esc
Printer-friendly Version Interactive Discussion
Discussion
P
a
per
|
Discussion
P
a
per
|
Discussion
P
a
per
|
Discussion
P
a
per
|
2.2 Sampling method
We adopted a static chamber method to measure CO2, CH4 and N2O emissions si-multaneously. A PVC chamber (cylinder with a diameter of 245 mm, wall thickness approximately 4 mm and length 300 mm) was installed in each of the 4 sites. The chambers were sharpened at the bottom edge and were pushed 10 cm into the soil
5
using a hammer. Weed control was performed within and around the chamber to pre-vent the impacts of grasses. Sampling was conducted a week later after the chambers were set. Gas fluxes across the soil–atmosphere interface were determined daily by sampling air in the headspace of PVC chambers during the 4 day field measurement. The internal volume of a chamber was 9.4 L when placed 10 cm deep into forest floor.
10
There were 4 holes evenly distributed on the chamber (10 cm above ground) to help the inner atmosphere fully mixed with outside, on all sampling occasions prior to each gas sampling, these holes were sealed with a set of rubber plugs. The top of the cham-ber was also covered with a cap fastened with black rubcham-ber band to prevent any gas exchange between the inner headspace and the outside. After covering the cap, 15 mL
15
gas samples were taken from the sampling port at the centre of the chamber top at 0 and 60 min after chamber deployment. A 25 mL syringe was attached to the sampling port and the plunger of the syringe was pumped up and down several times to mix the gases in the chamber before taking a sample. Gas samples were immediately in-jected into pre-evacuated 15 mL tubes capped with butyl rubber stoppers and prepare
20
for analysis of CO2, CH4and N2O. All gas samplings were conducted during daylight hours from approximately 08:00 to 12:00 (UTC/GMT+10 hours).
2.3 Soil properties analysis
The top 10 cm soil in the chamber was collected with a shovel. Collected soil samples were thoroughly mixed and passed through a 2 mm sieve. Soil moisture was measured
25
gravimetrically after drying at 105◦C for 48 h. pH was measured with a 1 : 5 aqueous solutions after shaking for 30 min. Soil inorganic N concentrations were extracted with 2
BGD
12, 10679–10706, 2015
Impacts of prescribed burning on soil greenhouse
gas fluxes
Y. Zhao et al.
Title Page
Abstract Introduction
Conclusions References
Tables Figures
◭ ◮
◭ ◮
Back Close
Full Screen / Esc
Printer-friendly Version Interactive Discussion
Discussion
P
a
per
|
Discussion
P
a
per
|
Discussion
P
a
per
|
Discussion
P
a
per
|
MKCL and measured using a modified micro-diffusion method (Wang et al., 2015) and a Discrete Chemistry Analyser (Westco Smartchem SC 200, Discrete Wet Chemistry Analyser).
To determine water soluble organic C (WSOC) and total N (WSTN), 7 g fresh soil was added to 35 mL distilled water in a 50 mL plastic centrifuge vials, the
suspen-5
sion was then shaken by an end-over-end shaker for 5 min followed by centrifuging at 10 000 rpm for 10 min. The suspension was then filtered through a Whatman 42 filter paper and a 33 mm Millex syringe-driven 0.45 µm filter successively before analysed by a Shimadzu TOC-VCSH/CSN TOC/N analyser. Similarly, hot water extractable organic C (HWEOC) and total N (HWETN) were also measured, while the only difference was,
10
1 : 5 soil water solution, was incubated in a capped and sealed tube at 70◦C for 18 h. Soil microbial biomass C (MBC) and N (MBN) were determined using the fumigation-extraction method described by Vance et al. (1987) and Brookes et al. (1985). Briefly, fumigated and non-fumigated soils (5 g dry weight equivalent) were extracted with 25 mL of 0.5 M K2SO4 (soil/extractant ratio 1 : 5). The fumigation lasted for 16 h.
Sam-15
ples were shaken for 30 min and then filtered through a Whatman 42 filter paper. Sol-uble organic C and total solSol-uble N (TSN) in the fumigated and non-fumigated samples were determined using a Shimadzu TOC-VCSH/CSN TOC/N analyser. MBC and MBN were calculated using conversion factors of 2.64 and 2.22 for C (Vance et al., 1987) and N (Brookes et al., 1985), respectively.
20
2.4 Gas analysis
Collected gas samples were sent to laboratory for gas chromatography (GC) analysis for CO2, CH4and N2O concentrations right after the field campaign. The concentration of CO2 and CH4 was measured using a GC system (GC-2010 PLUS Shimadzu) with Flame Ionization Detector and N2O was measured using the same GC system with
25
Electron Capture Detector. The standards (0.5 ppm for CH4, 400.5 ppm for CO2 and 0.3 ppm for N2O) were run before and after each set of samples to ensure the repro-ducibility of measurements. Gas fluxes for CO2, CH4and N2O were determined from
BGD
12, 10679–10706, 2015
Impacts of prescribed burning on soil greenhouse
gas fluxes
Y. Zhao et al.
Title Page
Abstract Introduction
Conclusions References
Tables Figures
◭ ◮
◭ ◮
Back Close
Full Screen / Esc
Printer-friendly Version Interactive Discussion
Discussion
P
a
per
|
Discussion
P
a
per
|
Discussion
P
a
per
|
Discussion
P
a
per
|
a regression analysis with gas concentrations change within chamber vs. time (Zhao et al., 2013).
2.5 Statistical analysis
All statistical analyses were performed using IBM SPSS STATISTICS (version 20) soft-ware. Repeated measures ANOVA was used to examine statistically significant diff
er-5
ences and changing patterns of soil gas fluxes and soil variables following the burning with measurement date as the repeated factor. Correlation analysis was tested for pos-sible effects of soil environmental variables on soil CO2, CH4and N2O fluxes.
3 Results
3.1 Greenhouse gas exchange rates before and after burning
10
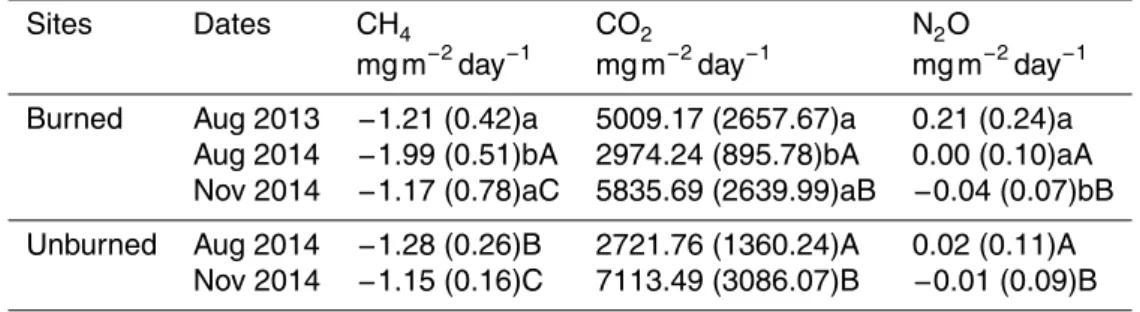
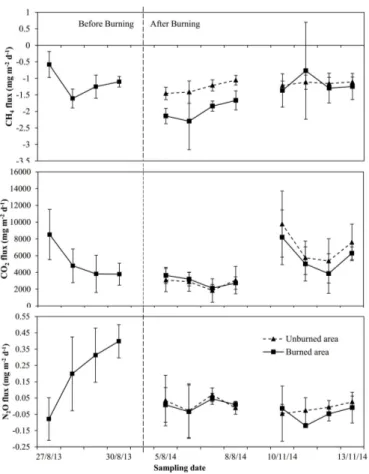
Average CH4, CO2 and N2O emissions rates of the 4 replicate sites for each sam-pling event were listed in Table 1. While temporal patterns of gas exchange for the 4 day sampling of the 3 sampling periods were shown in Fig. 2. All the sampling sites showed negative CH4 emissions rates during the three sampling events, or uptake atmospheric CH4. At the burned sites, mean CH4 uptake was significant increased
15
by 64 % three months after the prescribed burning (p <0.001), while during the third sampling period, CH4 uptake had similar CH4 uptake rate as that before the burning (p=0.843). At the unburned sites, CH4 uptake was relative stable during the dates of each sampling period and also showed less variation in uptake rate between August and November 2014. The significant difference in mean uptake rate in August 2014
20
(p <0.001) but similar in November 2014 (p=0.921) also confirmed that the CH4 up-take increased at the first three months but was recovered to pre-burning level about six months after the burning.
Mean CO2 emission from all sampling sites was significantly decreased by 41 % in August 2014 (p <0.001). In November 2014, CO2 efflux rates had exceeded that
25
BGD
12, 10679–10706, 2015
Impacts of prescribed burning on soil greenhouse
gas fluxes
Y. Zhao et al.
Title Page
Abstract Introduction
Conclusions References
Tables Figures
◭ ◮
◭ ◮
Back Close
Full Screen / Esc
Printer-friendly Version Interactive Discussion
Discussion
P
a
per
|
Discussion
P
a
per
|
Discussion
P
a
per
|
Discussion
P
a
per
|
before the burning by 28 % but the difference was not significant (p=0.392). Similar CO2emission rates between the burned and unburned sites during the sampling dates in August 2014 (p=0.549) and in November 2014 (p=0.218) were also observed.
As for N2O, lower emission rates compared to that in August 2013 were found both in August 2014 (p=0.003) and November 2014 (p <0.001). During the three sampling
5
periods, the study sites were not solely performed as source of atmospheric N2O, on 27 August 2013, 6 August 2014 and most days on November 2014, but the sites also took up N2O from the atmosphere. No observed significant difference in N2O emission between the burned and unburned sites in both August and November 2014.
3.2 Soil basic properties and their relationship with gas exchange rates
10
After the burning, mean soil moisture of the surface soil showed no significant dif-ference between burned and unburned sites (p=0.804), although most of the sam-pling sites (5 out of 8 for the two samsam-pling events in 2014) had relative higher values. Soil temperature was slightly higher during most sampling dates at burned sites, but no significant difference was found in August 2014 (p=0.644) and November 2014
15
(p=0.751). pH in the surface soil was higher in 2014 than in 2013, and the values at all burned sites were slightly higher than those of unburned sites (p=0.293). NO3-N was quite low both before and after the burning but NH4-N was significantly increased after the burning.
When relating these soil parameters to greenhouse gas emissions from soil surface,
20
soil temperature showed a positive correlation with CH4uptake (R=0.232,p=0.044) and CO2efflux (R=0.47,p <0.000) and a negative correlation with N2O emission (R=
−0.284, p=0.011). pH was negatively correlated with CH4 (R=−0.595, P =0.006)
and CO2(R=−0.591,p=0.006) emission. NH4-N was negatively correlated with N2O emission (R=−0.533,p=0.015).
25
BGD
12, 10679–10706, 2015
Impacts of prescribed burning on soil greenhouse
gas fluxes
Y. Zhao et al.
Title Page
Abstract Introduction
Conclusions References
Tables Figures
◭ ◮
◭ ◮
Back Close
Full Screen / Esc
Printer-friendly Version Interactive Discussion
Discussion
P
a
per
|
Discussion
P
a
per
|
Discussion
P
a
per
|
Discussion
P
a
per
|
3.3 Soil C and N dynamics before and after burning
There was no significant difference in WSOC at burned sites between August 2013 and August 2014, only slightly decreased WSOC was observed in August 2014. How-ever, WSOC was significant higher in November 2014 (p=0.034). Comparing to the unburned sites, WSOC in most burned sites (3 out of 4) was lower in August 2014
5
(p=0.387) while higher in November 2014 (p=0.237). No significant difference was found between any sampling periods for WSTN, despite higher WSTN at some burned sites than those before burning and unburned sites. HWEOC was significantly in-creased in August 2014 than that in August 2013 (p <0.001) and in November 2014 it was recovered to the level before the burning (p=0.929). The difference in HWEOC
10
between burned and unburned sites were also significant in August 2014 (p=0.0361) but insignificant in November 2014. The situation was similar for HWETN.
Mean MBC at burned sites in August 2014 was 378.94 mg kg−1, which was lower than that in August 2013 (522.45 mg kg−1, p=0.069), and this value did not change much in November 2014 (380.37 mg kg−1). Burned sites also showed lower MBC
val-15
ues when compared to the unburned sites both in August (p=0.121) and November (p=0.516) 2014. MBN had the same dynamics as MBC.
The correlation analysis between soil C or N pools and gas emissions showed that CH4 uptake was negatively correlated with WSOC (R=0.523, p=0.018). CO2 efflux has negative correlation with HWEOC (R=−0.690, p=0.001) and HWETN
20
(R=−0.730,p <0.001). N2O emission was positively correlated with MBN (R=0.565, p=0.009).
BGD
12, 10679–10706, 2015
Impacts of prescribed burning on soil greenhouse
gas fluxes
Y. Zhao et al.
Title Page
Abstract Introduction
Conclusions References
Tables Figures
◭ ◮
◭ ◮
Back Close
Full Screen / Esc
Printer-friendly Version Interactive Discussion
Discussion
P
a
per
|
Discussion
P
a
per
|
Discussion
P
a
per
|
Discussion
P
a
per
|
4 Discussions
4.1 Burning impacts on soil properties
The prescribed burning has resulted in a slightly increase in surface soil temperature, which is in agreement with most existing literature results (Burke et al., 1997; Certini, 2005). The burning of the understory vegetative cover, together with the resulted
con-5
sumption of fuels, removal of litter layer and increased charred materials on the soil surface would all moderate soil temperatures by intercepting direct sunlight and mod-erating the loss of soil heat by radiation. However, the controlled burning condition or low fire intensity limited this difference at insignificant level. Meanwhile, the 4 selected sites in the study did not show consistent fluctuations in surface soil moisture before
10
and after burning, which generally expected to decrease after a fire (Burke et al., 1997; Kim et al., 2011; Sullivan et al., 2011). Generally, increased soil temperature combined with the reduced shade would result in higher evaporation rates and therefore restricts the movement of water into soil profile (Burke et al., 1997; Certini, 2005). This might at-tribute to the representativeness of the measurements and one measurement for each
15
sampling period might not suffice to represent the physical state of water in the soil (Weber, 1990).
An increase in pH values was found at the burned areas in August 2014 and it was returned to a comparative level in November 2014. Although no significant difference was found between burned and the reference unburned sites in 2014, values for the
20
burned sites were still higher than those at the unburned sites. The increased pH after the burning would be probably due to the release of extractable basic cations from the deposited ashes during the burning. Several studies also find increased pH after fire (Guinto et al., 1999; Certini, 2005; Kim et al., 2011; Xue et al., 2014) and the increased pH would either recover to unburned level within a year (Rhoades et al., 2004; Xue
25
et al., 2014) or last for longer periods (Arocena and Opio, 2003; Ponder Jr et al., 2009; Granged et al., 2011), depending on the site condition and burning intensities.
BGD
12, 10679–10706, 2015
Impacts of prescribed burning on soil greenhouse
gas fluxes
Y. Zhao et al.
Title Page
Abstract Introduction
Conclusions References
Tables Figures
◭ ◮
◭ ◮
Back Close
Full Screen / Esc
Printer-friendly Version Interactive Discussion
Discussion
P
a
per
|
Discussion
P
a
per
|
Discussion
P
a
per
|
Discussion
P
a
per
|
NH4-N was significantly increased after the burning, but no significant changes were observed for NO3-N. Since NH4-N is a direct product of combustion and NO−3 is formed from NH+4 some weeks or months later as a result of nitrification (Covington and Sack-ett, 1992; Diaz-Raviña et al., 1992; Wang et al., 2015). Hence, the increase in NH4-N was probably due to the transformation of organic N during the combustion. Also the
5
deposition of organic N in ash and enhanced ammonification would also contribute to the increased NH+4 (Knoepp and Swank, 1993; Wan et al., 2001). This was also supported by the similar phenomenon found by Nardoto and Bustamante (2003) in sa-vannas of Central Brazil and Covington and Sackett (1992) in a ponderosa pine forest in USA.
10
The burning has significantly reduced MBC in the surface soil and it showed no apparent sign of recovery six months later after the burning. Decreased MBC after pre-scribed burning or wildfires have been reported and it would normally last for several years (Prieto-Fernández et al., 1998). As for the other two soil liable organic C pool in-dicators, WSOC showed no significant change before and after burning while HWEOC
15
significantly increased in August 2014 and returned to pre-burning level. While the low intensity of the prescribed burning may only cause volatilization of organic C to a lim-ited extent, soil microbes might be decreased due to their sensitiveness to temperature (Hernández et al., 1997; Neary et al., 1999). This microbial lysis, as well as the heat-induced alterations of soil organic matter, contributed to the release of carbohydrates
20
which were reflected by the initial increase in HWEOC.
4.2 Variations in greenhouse gas exchanges and their driving factors
4.2.1 CH4uptake
The CH4 uptake rates before burning and six months after burning from burned sites and all fluxes from unburned sites fall in the range of CH4 fluxes obtained by Kiese
25
et al. (2003) (varies from 0.84–1.63 mg m−2day−1) and a recent study by Rowlings et al. (2012) which were conducted in a similar forest ecosystem in Australia. While
BGD
12, 10679–10706, 2015
Impacts of prescribed burning on soil greenhouse
gas fluxes
Y. Zhao et al.
Title Page
Abstract Introduction
Conclusions References
Tables Figures
◭ ◮
◭ ◮
Back Close
Full Screen / Esc
Printer-friendly Version Interactive Discussion
Discussion
P
a
per
|
Discussion
P
a
per
|
Discussion
P
a
per
|
Discussion
P
a
per
|
the high uptake rate of CH4three months after the burning was also comparable to the results obtained in Australia forests under extreme dry conditions (Fest et al., 2009; Rowlings et al., 2012). The prescribed burning increased CH4uptake in this study. The same effect has also been reported by Burke et al. (1997) and Sullivan et al. (2011). However, unlike most studies reporting that the enhanced CH4 uptake may last for
5
several years, our results indicated that CH4 uptake rate was returned to pre-burning level within six months after the burning. We obtain this conclusion from the similar CH4 uptake rates in November 2014 when compared to the CH4 uptake at unburned sites and the rates before burning at the burned sites. The low fire intensity of the prescribed burning in this study may cause less impact on the system and therefore
10
shorten the required time to recover to pre-burning conditions for the studied forest. Studies have found that fire intensity has significant effect on forest soil CH4 consump-tion and CO2 emissions while severe wildfires always impact gas exchange rates for the subsequent several years (Burke et al., 1997; Neary et al., 1999; Sullivan et al., 2011). Kim et al. (2011) also found a quick recovery of CH4uptake that after 2 years of
15
low intensity burnings in a Japanese forest.
Soil moisture has been shown to be a key parameter controlling CH4consumption by soils through limiting the transport of atmospheric CH4to microbial communities living at depth in the soil (Burke et al., 1997). However, we observed no significant relation-ships between soil moisture and CH4uptake as reported by other studies (Sommerfeld
20
et al., 1993; Kiese et al., 2003; Livesley et al., 2011). This, probably due to the low intensity burning, did not affect the soil water conditions in the soil horizons relevant to CH4 oxidation, or the soil moisture was partly recovered to pre-burning level and was also lower than the range of strong moisture control. Castro et al. (1994) found that moisture control was strongest when between 60 and 100 % of available soil pore
25
space was water filled. Meanwhile, surface soil temperature appeared to show more significant influence on CH4 uptake in this study. We also found weak but significant relationship between CH4 uptake and soil pH. The mechanism of how increased pH would affect soil CH4uptake after fire is not clear, and Jaatinen et al. (2004) estimated
BGD
12, 10679–10706, 2015
Impacts of prescribed burning on soil greenhouse
gas fluxes
Y. Zhao et al.
Title Page
Abstract Introduction
Conclusions References
Tables Figures
◭ ◮
◭ ◮
Back Close
Full Screen / Esc
Printer-friendly Version Interactive Discussion
Discussion
P
a
per
|
Discussion
P
a
per
|
Discussion
P
a
per
|
Discussion
P
a
per
|
that the increased pH after fire caused any change in the methanotroph community and would not be directly responsible for the increased uptake rates. Therefore, the increased pH in our study would probably indirectly affect CH4 uptake together with other fire introduced changes.
The relative high and significant correlation between CH4 uptake and WSOC
indi-5
cates that the decreased soil C may have increased CH4 diffusion into soil profile. Removal of the C rich O horizon caused by the burning eliminated a barrier of CH4 diffusion. This is also supported by the decreasing CH4uptake and recovered WSOC in November 2014 combined with recovered litter deposit and ground plants regrowth. This effect of burning reduced thickness of organic layer to CH4uptake was also found
10
in similar forest ecosystems (Saari et al., 1998; Steinkamp et al., 2001). Another pos-sible reason for the observed characteristic of CH4uptake is the physical changes in surface soil. Although not measured in current study, literature has shown that low to moderate fires would increase soil structure stability due to the formation of the dy-drophobic film on the external surface of aggregates (Mataix-Solera and Doerr, 2004).
15
With lack of the protection of ground plants and litter layers, surface soil was more likely to loose more fine fractions and lead to soil coarsening by the increased erosion (Cer-tini, 2005). These physical changes in the surface soil would all create a channel ideal for diffusion of atmosphere CH4 into soil profile and thereby increase CH4 oxidation rates.
20
4.2.2 CO2effluxes
The studied sites acted as a persistent source of atmospheric CO2 before and after the burning, while the CO2 emission rates, either before or after burning, were simi-lar to the results obtained by Carlyle and Than (1988) in a native forest with low soil moisture (about 5520 mg m−2day−1) and by Rowlings et al. (2012) in an Australian
25
subtropical rainforest (around 3600 mg m−2day−1). However, the CO2emission values were much lower than the reported high soil respirations (over 20 000 mg m−2day−1) in various Australian forest ecosystems with high soil moisture and temperature
BGD
12, 10679–10706, 2015
Impacts of prescribed burning on soil greenhouse
gas fluxes
Y. Zhao et al.
Title Page
Abstract Introduction
Conclusions References
Tables Figures
◭ ◮
◭ ◮
Back Close
Full Screen / Esc
Printer-friendly Version Interactive Discussion
Discussion
P
a
per
|
Discussion
P
a
per
|
Discussion
P
a
per
|
Discussion
P
a
per
|
lyle and Than, 1988; Fest et al., 2009; Rowlings et al., 2012). A number of existing studies have reported reduced CO2 emissions after fire due to diminished root activ-ity and lower root respirations (Czimczik et al., 2006; Kim et al., 2011; Sullivan et al., 2011), and the effects would last for various length from less than 2 year (Weber, 1990; Irvine et al., 2007) to longer periods (Burke et al., 1997). However, in this study, it
5
seems that CO2 emission started recovering three months after the burning. This is supported by the similar CO2emission rates in August 2014 (p=0.218) and Novem-ber 2014 (p=0.549) between burned and the unburned sites. The decreased CO2 flux three months after the burning, which is only 41 % of that before burning, might be attributed to the reduced root respiration and decomposition activities related to soil
10
microbial communities. The observed high HWEOC value in August 2014 probably in-dicated increased dead fine roots after the combustion of ground biomass, which was in agreement with the estimation that after removing the aboveground biomass, most fine roots would die within 2 months by Fahey and Arthur (1994). Meanwhile, studies have reported that root respiration could contribute up to 50 % of the total soil
respira-15
tion (Irvine and Law, 2002; Zerva and Mencuccini, 2005). Decomposition of the dead fine roots could lead to flush of C substrate but this was limited by the decreased mi-crobial activities in this study, suggested by the significant lower MBC and MBN values in August and November 2014. Meanwhile, lower MBC at the burned sites compared to the unburned sites probably also suggested a reduced heterotrophic contribution to
20
total soil respiration. Similar finding was also reported by Sullivan et al. (2011) who concluded that MBC explained a large proportion of the variation in soil CO2flux at the burned site than at the unburned sites in a ponderosa forest in south-western USA. Considering the positive relationship between CO2 efflux and WSOC, which was an important part of soil labile C, the microbial biomass was likely to be limited by the
25
amount labile C available for assimilation into microbial biomass. Maheswaran and At-tiwill (1989) and Zerva and Mencuccini (2005) also reported reduced CO2 emission which was related to reduced microbial populations limited by an available source of C after the fire. Such explanation can be further supported by the subsequent recovering
BGD
12, 10679–10706, 2015
Impacts of prescribed burning on soil greenhouse
gas fluxes
Y. Zhao et al.
Title Page
Abstract Introduction
Conclusions References
Tables Figures
◭ ◮
◭ ◮
Back Close
Full Screen / Esc
Printer-friendly Version Interactive Discussion
Discussion
P
a
per
|
Discussion
P
a
per
|
Discussion
P
a
per
|
Discussion
P
a
per
|
CO2 flux six months after the burning, combined with recovered MBC to near pre-burning level and higher WSOC levels than before the pre-burning. It was also reasonable that higher temperature in November 2014 had stimulated the surface soil respiration and therefore could contribute to the higher CO2emission rate.
4.2.3 N2O emissions
5
The soil–atmosphere fluxes of N2O measured in the current study were very small (−0.21 to 0.54 mg m−2day−1before burning and −0.18–0.11 mg m−2day−1 after
burn-ing). These low fluxes were similar to the small N2O emission reported by Fest et al. (2009) and Livesley et al. (2011), but was much lower than the range of 0.75– 8.19 mg m−2day−1recorded by Kiese et al. (2003) in a tropical rainforest and the range
10
of 0.62–1.57 mg m−2day−1by Rowlings et al. (2012) in a subtropical rainforest. No sig-nificant effect of burning was observed on the N2O emission. Since forest soils were generally accepted as a source of atmospheric N2O (Butterbach-Bahl et al., 1997), the negative values we measured might be attributed to the changes in N2O concentration during the chamber employment were quite low, and these changes were below the
15
detection limit of the GC system. Even though the dry and well aerated soil of the sam-pled sites makes it prone to nitrification rather than denitrification, the observed small inorganic N pool (NH+4 <than 10 mg N kg−1while NO−3 <0.1 mg N kg−1) dominated by NH+4 also limited the nitrification processes. Although there was a significant increase in NH+4 three months (p=0.009) and six months (p=0.009) after the burning,
nitrifica-20
tion was still negligible. This could be attributed to enhanced situation of low soil water availability and dry conditions after burning, due to the removal of understory plants and litter layers and increased evapotranspiration rates, limited the activities of soil nitrifiers (Livesley et al., 2011). Also the burning induced charcoal at the soil surface would also supress N2O exchange rates which were reported in a recent controlled experiment in
25
Japan (Kim et al., 2011). However, the accumulated N substrate, either NH+4 or NO−3,
BGD
12, 10679–10706, 2015
Impacts of prescribed burning on soil greenhouse
gas fluxes
Y. Zhao et al.
Title Page
Abstract Introduction
Conclusions References
Tables Figures
◭ ◮
◭ ◮
Back Close
Full Screen / Esc
Printer-friendly Version Interactive Discussion
Discussion
P
a
per
|
Discussion
P
a
per
|
Discussion
P
a
per
|
Discussion
P
a
per
|
might cause further high N2O emissions with appropriate conditions, for example, wet after precipitations.
4.3 Contribution of the gas emissions to the burning introduced greenhouse
gas effect
Although consistently consuming atmospheric CH4, forest soil in Toohey Forest still
5
acts as a net C source to the atmosphere, due to the greater CO2emission rates dur-ing the studied period. However, the burndur-ing induced lower CO2emission and higher CH4uptake rates could significantly reduce the amount of C released into atmosphere, especially when extending these effects to the first several months after burning. This reduced C emission could partly compensate the greenhouse gas effect during the
10
operation of the burning: prescribed burning could cause eruption of CO2into the at-mosphere by combusting photosynthetic fixed C embedded in understory plants, litter layer, surface soil organic C and also the consumption of fossil fuels to manipulate fires. Data on C burned, fuel consumed and continuous measurement of soil gas exchanges are required to quantify the burning caused greenhouse effect in future studies.
15
5 Conclusions
The low intensity prescribed burning in Toohey Forest caused changes in both soil properties and greenhouse gas exchange rates. Soil CH4uptake was significantly en-hanced due to the increased CH4diffusivity into soil profiles. The removal of litter layer and surface soil organic materials and the altered soil physical structural caused by the
20
burning were the major factors contributing to the increased CH4 diffusion. The CO2 emission was largely decreased but it was a combination of burning introduced vari-ation and natural seasonal varivari-ations. Changes in root respirvari-ation and soil microbial community were the two controlling factors related to burning effect on CO2emission. Due to the controlled condition of the prescribed burning, both CH4 uptake and CO2
25
BGD
12, 10679–10706, 2015
Impacts of prescribed burning on soil greenhouse
gas fluxes
Y. Zhao et al.
Title Page
Abstract Introduction
Conclusions References
Tables Figures
◭ ◮
◭ ◮
Back Close
Full Screen / Esc
Printer-friendly Version Interactive Discussion
Discussion
P
a
per
|
Discussion
P
a
per
|
Discussion
P
a
per
|
Discussion
P
a
per
|
emission started to recover about three months after the burning and it appears that the gas exchange rates were recovered to pre-burning level about six months after burning. This quick recovery was closely related to the limited effect of burning on soil and no dramatic damages in the mineral soils. However, the decreased CO2emission and increased CH4 uptake during this period could still partly compensate the
green-5
house gas effect caused by the combustion of C during the burning. The N2O emission was quite low at the studied sites and showed no obvious impacts from the burning. Finally, a continuous monitoring of soil properties and soil greenhouse gas exchanges and even ecosystem gas exchange rates before and after burning is important to reveal the key mechanisms and quantify the complex impacts of burning on forest ecosystem
10
and regional climate.
Acknowledgements. This work was sponsored by grants from the Australian Research Coun-cil. We acknowledge Geoffrey Lambert, Rongxiao Che, Iman Tahmasbian, and Mone Nouan-syvong for their assistance in the field work. We also thank Geoffrey Lambert, Zhongming Lan, Haibo Dong, and Carolyn Polson for their technical supports in sample analysis.
15
References
Arocena, J. M. and Opio, C.: Prescribed fire-induced changes in properties of sub-boreal forest soils, Geoderma, 113, 1–16, 2003.
Bai, H. S., Sun, F., Xu, Z., Blumfield, T., Chen, C., and Wild, C.: Appraisal of15N enrichment and
15
N natural abundance methods for estimating N2 fixation by understorey Acacia leiocalyx
20
and A. disparimma in a native forest of subtropical Australia, J. Soils Sediments, 12, 653– 662, 2012.
Brookes, P. C., Landman, A., Pruden, G., and Jenkinson, D. S.: Chloroform fumigation and the release of soil nitrogen: a rapid direct extraction method to measure microbial biomass nitrogen in soil, Soil Biol. Biochem., 17, 837–842, 1985.
25
Burke, R. A., Zepp, R. G., Tarr, M. A., Miller, W. L., and Stocks, B. J.: Effect of fire on soil– atmosphere exchange of methane and carbon dioxide in Canadian boreal forest sites, J. Geophys. Res.-Atmos., 102, 29289–29300, 1997.
BGD
12, 10679–10706, 2015
Impacts of prescribed burning on soil greenhouse
gas fluxes
Y. Zhao et al.
Title Page
Abstract Introduction
Conclusions References
Tables Figures
◭ ◮
◭ ◮
Back Close
Full Screen / Esc
Printer-friendly Version Interactive Discussion
Discussion
P
a
per
|
Discussion
P
a
per
|
Discussion
P
a
per
|
Discussion
P
a
per
|
Butterbach-Bahl, K., Gasche, R., Breuer, L., and Papen, H.: Fluxes of NO and N2O from
tem-perate forest soils: impact of forest type, N deposition and of liming on the NO and N2O
emissions, Nutr. Cycl. Agroecosys., 48, 79–90, 1997.
Carlyle, J. C. and Than, U. B.: Abiotic controls of soil respiration beneath an eighteen-year-old pinus radiata stand in south-eastern Australia, J. Ecol., 76, 654–662, 1988.
5
Castro, M. S., Melillo, J. M., Steudler, P. A., and Chapman, J. W.: Soil moisture as a predictor of methane uptake by temperate forest soils, Can. J. Forest Res., 24, 1805–1810, 1994. Catterall, C. P. and Wallace, C. J.: An Island in Suburbia: the Natural and Social History of
Toohey Forest, Institute of Applied Environmental Research, Griffith University, Brisbane, 1987.
10
Catterall, C. P., Piper, S. D., Bunn, S. E., and Arthur, J. M.: Flora and fauna assemblages vary with local topography in a subtropical eucalypt forest, Austral. Ecol., 26, 56–69, 2001. Certini, G.: Effects of fire on properties of forest soils: a review, Oecologia, 143, 1–10, 2005. Covington, W. W. and Sackett, S. S.: Soil mineral nitrogen changes following prescribed burning
in ponderosa pine, Forest Ecol. Manag., 54, 175–191, 1992.
15
Czimczik, C. I., Trumbore, S. E., Carbone, M. S., and Winston, G. C.: Changing sources of soil respiration with time since fire in a boreal forest, Glob. Change Biol., 12, 957–971, 2006. Dalal, R. C., Wang, W., Robertson, G. P., and Parton, W. J.: Nitrous oxide emission from
Aus-tralian agricultural lands and mitigation options: a review, Aust. J. Soil Res., 41, 165–195, 2003.
20
Diaz-Raviña, M., Prieto, A., Acea, M. J., and Carballas, T.: Fumigation-extraction method to estimate microbial biomass in heated soils, Soil Biol. Biochem., 24, 259–264, 1992.
Fahey, T. J. and Arthur, M. A.: Further-studies of root decomposition following harvest of a north-ern hardwoods forest, For. Sci., 40, 618–629, 1994.
Farmer, D., Catterall, C. P., and Piper, S. D.: Abundance patterns across months and locations,
25
and their differences between migrant and resident landbirds in lowland subtropical eucalypt forest, Emu, 104, 283–296, 2004.
Fest, B.: The Impact of Fire Disturbance and Simulated Climate Change Conditions on Soil Methane Exchange in Eucalypt Forests of South-Eastern Australia, Department of Forest and Ecosystem Science, Melbourne School of Land and Environment, University of
Mel-30
bourne, Melbourne, 2013.
BGD
12, 10679–10706, 2015
Impacts of prescribed burning on soil greenhouse
gas fluxes
Y. Zhao et al.
Title Page
Abstract Introduction
Conclusions References
Tables Figures
◭ ◮
◭ ◮
Back Close
Full Screen / Esc
Printer-friendly Version Interactive Discussion
Discussion
P
a
per
|
Discussion
P
a
per
|
Discussion
P
a
per
|
Discussion
P
a
per
|
Fest, B. J., Livesley, S. J., Drösler, M., van Gorsel, E., and Arndt, S. K.: Soil–atmosphere green-house gas exchange in a cool, temperateEucalyptus delegatensis forest in south-eastern Australia, Agr. Forest Meteorol., 149, 393–406, 2009.
Fu, L., Zhao, Y., Xu, Z. H., and Wu, B. F.: spatial and temporal dynamics of forest aboveground carbon stocks in rsponse to climate and environmental changes, J. Soils Sediments, 15,
5
249–259, 2015.
Granged, A. J. P., Jordán, A., Zavala, L. M., Muñoz-Rojas, M., and Mataix-Solera, J.: Short-term effects of experimental fire for a soil under eucalyptus forest (SE Australia), Geoderma, 167–168, 125–134, 2011.
Guinto, D. F., Xu, Z. H., Saffigna, P. G., House, A. P. N., and Perera, M. C. S.: Soil nitrogen
10
mineralisation and organic matter composition revealed by 13C NMR spectroscopy under repeated prescribed burning in eucalypt forests of south-east Queensland, Aust. J. Soil Res., 37, 123–136, 1999.
Guinto, D. F., Xu, Z., House, A. P. N., and Saffigna, P. G.: Assessment of N2fixation by
under-storey acacias in recurrently burnt eucalypt forests of subtropical Australia using15N isotope
15
dilution techniques, Can. J. Forest Res., 30, 112–121, 2000.
Hernández, T., García, C., and Reinhardt, I.: Short-term effect of wildfire on the chemical, bio-chemical and microbiological properties of Mediterranean pine forest soils, Biol. Fert. Soils, 25, 109–116, 1997.
Irvine, J. and Law, B. E.: Contrasting soil respiration in young and old-growth ponderosa pine
20
forests, Glob. Change Biol., 8, 1183–1194, 2002.
Irvine, J., Law, B. E., and Hibbard, K. A.: Postfire carbon pools and fluxes in semiarid ponderosa pine in Central Oregon, Glob. Change Biol., 13, 1748–1760, 2007.
Jaatinen, K., Knief, C., Dunfield, P. F., Yrjålå, K., and Fritze, H.: Methanotrophic bacteria in boreal forest soil after fire, FEMS Microbiol. Ecol., 50, 195–202, 2004.
25
Kiese, R. and Butterbach-Bahl, K.: N2O and CO2emissions from three different tropical forest
sites in the wet tropics of Queensland, Australia, Soil Biol. Biochem., 34, 975–987, 2002. Kiese, R., Hewett, B., Graham, A., and Butterbach-Bahl, K.: Seasonal variability of N2O
emissions and CH4 uptake by tropical rainforest soils of Queensland, Australia, Glob.
Bio-geochem. Cy., 17, 1043, doi:10.1029/2002GB002014, 2003.
30
Kim, Y. S., Makoto, K., Takakai, F., Shibata, H., Satomura, T., Takagi, K., Hatano, R., and Koike, T.: Greenhouse gas emissions after a prescribed fire in white birch-dwarf bamboo
BGD
12, 10679–10706, 2015
Impacts of prescribed burning on soil greenhouse
gas fluxes
Y. Zhao et al.
Title Page
Abstract Introduction
Conclusions References
Tables Figures
◭ ◮
◭ ◮
Back Close
Full Screen / Esc
Printer-friendly Version Interactive Discussion
Discussion
P
a
per
|
Discussion
P
a
per
|
Discussion
P
a
per
|
Discussion
P
a
per
|
stands in northern Japan, focusing on the role of charcoal, Eur. J. Forest Res., 130, 1031– 1044, 2011.
Knoepp, J. D. and Swank, W. T.: Site preparation burning to improve southern Appalachian pine-hardwood stands: nitrogen responses in soil, soil water, and streams, Can. J. Forest Res., 23, 2263–2270, 1993.
5
Livesley, S. J., Grover, S., Hutley, L. B., Jamali, H., Butterbach-Bahl, K., Fest, B., Beringer, J., and Arndt, S. K.: Seasonal variation and fire effects on CH4, N2O and CO2 exchange in
savanna soils of northern Australia, Agr. Forest Meteorol., 151, 1440–1452, 2011.
Maheswaran, J., and Attiwill, P. M.: Soil respiration in eucalypt forests of southeastern Australia, Biol. Fert. Soils, 8, 154–159, 1989.
10
Mataix-Solera, J. and Doerr, S. H.: Hydrophobicity and aggregate stability in calcareous topsoils from fire-affected pine forests in southeastern Spain, Geoderma, 118, 77–88, 2004.
Murphy, B. F. and Timbal, B.: A review of recent climate variability and climate change in south-eastern Australia, Int. J. Climatol., 28, 859–879, 2008.
Nardoto, G. B. and Bustamante, M. M. C.: Effects of fire on soil nitrogen dynamics and microbial
15
biomass in savannas of Central Brazil, Pesqui. Agropecu. Bras., 38, 955–962, 2003. Nave, L. E., Vance, E. D., Swanston, C. W., and Curtis, P. S.: Fire effects on temperate forest
soil C and N storage, Ecol. Appl., 21, 1189–1201, 2011.
Neary, D. G., Klopatek, C. C., DeBano, L. F., and Ffolliott, P. F.: Fire effects on belowground sustainability: a review and synthesis, Forest Ecol. Manag., 122, 51–71, 1999.
20
Ponder Jr, F., Tadros, M., and Loewenstein, E. F.: Microbial properties and litter and soil nutri-ents after two prescribed fires in developing savannas in an upland Missouri Ozark Forest, Forest Ecol. Manag., 257, 755–763, 2009.
Prieto-Fernández, A., Acea, M. J., and Carballas, T.: Soil microbial and extractable C and N after wildfire, Biol. Fert. Soils, 27, 132–142, 1998.
25
Rhoades, C. C., Meier, A. J., and Rebertus, A. J.: Soil properties in fire-consumed log burnout openings in a Missouri oak savanna, Forest Ecol. Manag., 192, 277–284, 2004.
Rowlings, D. W., Grace, P. R., Kiese, R., and Weier, K. L.: Environmental factors controlling temporal and spatial variability in the soil–atmosphere exchange of CO2, CH4and N2O from
an Australian subtropical rainforest, Glob. Change Biol., 18, 726–738, 2012.
30
Saari, A., Heiskanen, J., and Martikainen, P. J.: Effect of the organic horizon on methane oxi-dation and uptake in soil of a boreal Scots pine forest, FEMS Microbiol. Ecol., 26, 245–255, 1998.
BGD
12, 10679–10706, 2015
Impacts of prescribed burning on soil greenhouse
gas fluxes
Y. Zhao et al.
Title Page
Abstract Introduction
Conclusions References
Tables Figures
◭ ◮
◭ ◮
Back Close
Full Screen / Esc
Printer-friendly Version Interactive Discussion
Discussion
P
a
per
|
Discussion
P
a
per
|
Discussion
P
a
per
|
Discussion
P
a
per
|
Seidl, R., Schelhaas, M.-J., Rammer, W., and Verkerk, P. J.: Increasing forest disturbances in Europe and their impact on carbon storage, Nature Climate Change, 4, 806–810, 2014. Sherwood, S. and Fu, Q.: A drier future?, Science, 343, 737–739, 2014.
Sommerfeld, R. A., Mosier, A. R., and Musselman, R. C.: CO2, CH4 and N2O flux through
a Wyoming snowpack and implications for global budgets, Nature, 361, 140–142, 1993.
5
Steinkamp, R., Butterbach-Bahl, K., and Papen, H.: Methane oxidation by soils of an N limited and N fertilized spruce forest in the Black Forest, Germany, Soil Biol. Biochem., 33, 145–153, 2001.
Sullivan, B. W., Kolb, T. E., Hart, S. C., Kaye, J. P., Hungate, B. A., Dore, S., and Montes-Helu, M.: Wildfire reduces carbon dioxide efflux and increases methane uptake in ponderosa
10
pine forest soils of the southwestern USA, Biogeochemistry, 104, 251–265, 2011.
Vance, E. D., Brookes, P. C., and Jenkinson, D. S.: An extraction method for measuring soil microbial biomass C, Soil Bio. Biochem, 19, 703–707, 1987.
Wan, S., Hui, D., and Luo, Y.: Fire effects on nitrogen pools and dynamics in terrestrial ecosys-tems: a meta-analysis, Ecol. Appl., 11, 1349–1365, 2001.
15
Wang, Y., Xu, Z., and Zhou, Q.: Impact of fire on soil gross nitrogen transformations in forest ecosystems, J. Soils Sediments, 14, 1030–1040, 2014.
Wang, Y., Xu, Z., Zheng, J., Abdullah, K., and Zhou, Q.:δ15N of soil nitrogen pools and their dynamics under decomposing leaf litters in a suburban native forest subject to repeated prescribed burning in southeast Queensland, Australia, J. Soils Sediments, 15, 1063–1074,
20
2015.
Weber, M. G.: Forest soil respiration after cutting and burning in immature aspen ecosystems, Forest Ecol. Manag., 31, 1–14, 1990.
Xue, L., Li, Q., and Chen, H.: Effects of a wildfire on selected physical, chemical and biochem-ical soil properties in a pinus massoniana forest in south China, Forests, 5, 2947–2966,
25
2014.
Zerva, A. and Mencuccini, M.: Short-term effects of clearfelling on soil CO2, CH4, and N2O
fluxes in a Sitka spruce plantation, Soil Biol. Biochem., 37, 2025–2036, 2005.
Zhao, Y., Wu, B. F., and Zeng, Y.: Spatial and temporal patterns of greenhouse gas emissions from Three Gorges Reservoir of China, Biogeosciences, 10, 1219–1230,
doi:10.5194/bg-10-30
1219-2013, 2013.
BGD
12, 10679–10706, 2015
Impacts of prescribed burning on soil greenhouse
gas fluxes
Y. Zhao et al.
Title Page
Abstract Introduction
Conclusions References
Tables Figures
◭ ◮
◭ ◮
Back Close
Full Screen / Esc
Printer-friendly Version Interactive Discussion
Discussion
P
a
per
|
Discussion
P
a
per
|
Discussion
P
a
per
|
Discussion
P
a
per
|
Table 1.Average gas exchange rates from surface soil in Toohey Forest before and after the prescribed burning. Values in parentheses indicate standard errors for the 4 replicates of each sampling period. Significant differences between measurements before and after the burn-ing presented in lowercase letters. Significant differences between burned and unburned sites presented in uppercase letters. Mean values followed by the same letter are not significantly different (one-way ANOVA,p≥0.05).
Sites Dates CH4 CO2 N2O
mg m−2day−1 mg m−2day−1 mg m−2day−1
Burned Aug 2013 −1.21 (0.42)a 5009.17 (2657.67)a 0.21 (0.24)a Aug 2014 −1.99 (0.51)bA 2974.24 (895.78)bA 0.00 (0.10)aA Nov 2014 −1.17 (0.78)aC 5835.69 (2639.99)aB −0.04 (0.07)bB
Unburned Aug 2014 −1.28 (0.26)B 2721.76 (1360.24)A 0.02 (0.11)A Nov 2014 −1.15 (0.16)C 7113.49 (3086.07)B −0.01 (0.09)B
BGD
12, 10679–10706, 2015
Impacts of prescribed burning on soil greenhouse
gas fluxes
Y. Zhao et al.
Title Page Abstract Introduction Conclusions References Tables Figures ◭ ◮ ◭ ◮ Back Close
Full Screen / Esc
Printer-friendly Version Interactive Discussion Discussion P a per | Discussion P a per | Discussion P a per | Discussion P a per |
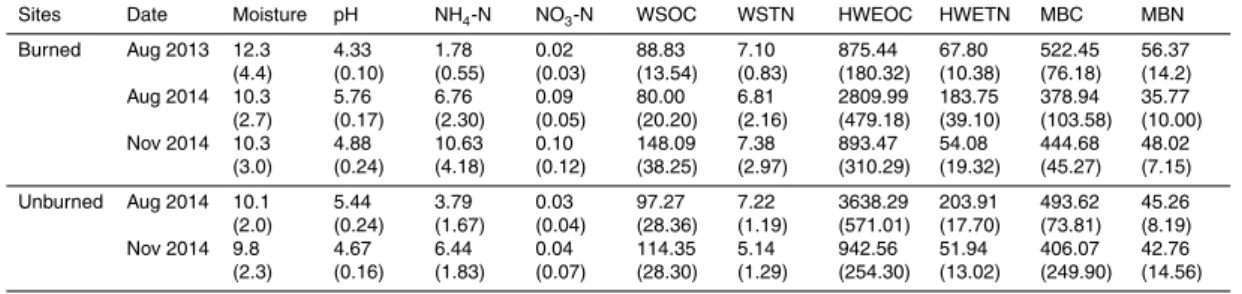
Table 2.Surface soil properties in Toohey Forest before and after the prescribed burning. Val-ues in parentheses indicate standard errors for the 4 replicates of each sampling period. Soil moisture is presented in %. Other parameters (except pH) are presented in mg kg−1.
Sites Date Moisture pH NH4-N NO3-N WSOC WSTN HWEOC HWETN MBC MBN
Burned Aug 2013 12.3 (4.4) 4.33 (0.10) 1.78 (0.55) 0.02 (0.03) 88.83 (13.54) 7.10 (0.83) 875.44 (180.32) 67.80 (10.38) 522.45 (76.18) 56.37 (14.2) Aug 2014 10.3
(2.7) 5.76 (0.17) 6.76 (2.30) 0.09 (0.05) 80.00 (20.20) 6.81 (2.16) 2809.99 (479.18) 183.75 (39.10) 378.94 (103.58) 35.77 (10.00) Nov 2014 10.3
(3.0) 4.88 (0.24) 10.63 (4.18) 0.10 (0.12) 148.09 (38.25) 7.38 (2.97) 893.47 (310.29) 54.08 (19.32) 444.68 (45.27) 48.02 (7.15)
Unburned Aug 2014 10.1 (2.0) 5.44 (0.24) 3.79 (1.67) 0.03 (0.04) 97.27 (28.36) 7.22 (1.19) 3638.29 (571.01) 203.91 (17.70) 493.62 (73.81) 45.26 (8.19) Nov 2014 9.8
BGD
12, 10679–10706, 2015
Impacts of prescribed burning on soil greenhouse
gas fluxes
Y. Zhao et al.
Title Page
Abstract Introduction
Conclusions References
Tables Figures
◭ ◮
◭ ◮
Back Close
Full Screen / Esc
Printer-friendly Version Interactive Discussion
Discussion
P
a
per
|
Discussion
P
a
per
|
Discussion
P
a
per
|
Discussion
P
a
per
|
Figure 1.Map of the study site in Toohey Forest located in south-eastern Queensland, Aus-tralia.
BGD
12, 10679–10706, 2015
Impacts of prescribed burning on soil greenhouse
gas fluxes
Y. Zhao et al.
Title Page
Abstract Introduction
Conclusions References
Tables Figures
◭ ◮
◭ ◮
Back Close
Full Screen / Esc
Printer-friendly Version Interactive Discussion
Discussion
P
a
per
|
Discussion
P
a
per
|
Discussion
P
a
per
|
Discussion
P
a
per
|
Figure 2.CH4, CO2and N2O exchange rates before and after the prescribed burning. The dash
line indicated the date of burning conducted on 27 May 2014. Each sampling period lasted for 4 days and the values were averaged from the 4 selected sites each day. The vertical bars indicated the standard error of the mean.