J. Evid. Based Med. Healthc., pISSN- 2349-2562, eISSN- 2349-2570/ Vol. 3/Issue 47/June 13, 2016 Page 2346
EVALUATION OF ANAEMIA USING RED CELL AND RETICULOCYTE PARAMETERS USING
AUTOMATED HAEMATOLOGY ANALYSER
Vidyadhar Rao1
1Professor, Department of Pathology, Kannur Medical College, Anjarakandy, Kannur, Kerala.
ABSTRACT
Use of current models of Automated Haematology Analysers help in calculating the haemoglobin contents of the mature Red cells, Reticulocytes and percentages of Microcytic and hypochromic Red cells. This has helped the clinician in reaching early diagnosis and management of Different haemopoietic disorders like Iron Deficiency Anaemia, Thalassaemia and anaemia of chronic diseases.
AIM
This study is conducted using an Automated Haematology Analyser to evaluate anaemia using the Red Cell and Reticulocyte parameters. Three types of anaemia were evaluated; iron deficiency anaemia, anaemia of long duration and anaemia associated with chronic disease and Iron deficiency.
MATERIALS AND METHODS
The blood samples were collected from 287 adult patients with anaemia differentiated depending upon their iron status, haemoglobinopathies and inflammatory activity. Iron deficiency anaemia (n=132), anaemia of long duration (ACD), (n=97) and anaemia associated with chronic disease with iron deficiency (ACD Combi), (n=58). Microcytic Red cells, hypochromic red cells percentage and levels of haemoglobin in reticulocytes and matured RBCs were calculated. The accuracy of the parameters was analysed using receiver operating characteristic analyser to differentiate between the types of anaemia.
OBSERVATIONS AND RESULTS
There was no difference in parameters between the iron deficiency group or anaemia associated with chronic disease and iron deficiency. The hypochromic red cells percentage was the best parameter in differentiating anaemia of chronic disease with or without absolute iron deficiency with a sensitivity of 72.7% and a specificity of 70.4%.
CONCLUSIONS
The parameters of red cells and reticulocytes were of reasonably good indicators in differentiating the absolute iron deficiency anaemia with chronic disease.
KEYWORDS
Automated, Anaemia, Iron Deficiency, Red cells, Reticulocytes, Haemoglobinopathies.
HOW TO CITE THIS ARTICLE: Rao V. Evaluation of anaemia using red cell and reticulocyte parameters using automated haematology analyser. J. Evid. Based Med. Healthc. 2016; 3(47), 2346-2350. DOI: 10.18410/jebmh/2016/518
INTRODUCTION: The current models of Automated
Haematology Analysers help in calculating the haemoglobin contents of the mature Red cells, Reticulocytes and percentages of Microcytic and hypochromic Red cells. These new Analysers have been used in the diagnosis of iron deficiency Anaemia, beta thalassemia carriers and anaemia of chronic disease.1,2,3 As the clinical approach to these
conditions is entirely different the differentiation between them remains most important.4,5
Due to short life span of Reticulocytes (1 to 2 days), the haemoglobin content of young red cells remains a good measurement of iron deficiency erythropoiesis.6 Reticulocyte
haemoglobin content represents real-time information on the synthesis of young RBCs in the marrow.
The other parameters are the percentage of red cells with haemoglobin content 17 pg or less, and the percentage of red cells with a volume of less than 60 fL (% Micro R).1
which corresponds to a sub-population of mature red cells exhibiting evidence of insufficient iron content. Among the various causes of anaemia with which the patients get admitted is anaemia associated with chronic inflammation, infection or malignancy.
Presence of inflammatory cytokines causes failure in incorporation of iron in the red cell progenitors even though there is abundant stainable iron in the bone marrow. This is also called as hyporegenerative anaemia.7 Reduced
concentrations of circulating iron and normal or increased iron stores characterise a state of functional iron deficiency.8
Anaemia of inflammation can be associated with absolute iron deficiency such as generally in patients with inflammatory disease and chronic blood loss. Differentiation between these two conditions is very important in the treatment but their differentiation is difficult in clinical practice by using conventional bio markers such as ferritin concentration and transferrin saturation.9
Financial or Other, Competing Interest: None. Submission 23-05-2016, Peer Review 28-05-2016, Acceptance 03-06-2016, Published 11-06-2016. Corresponding Author:
Dr. Vidyadhar Rao,
Professor, Department of Pathology, Kannur Medical College, Anjarakandy, Kannur, Kerala.
J. Evid. Based Med. Healthc., pISSN- 2349-2562, eISSN- 2349-2570/ Vol. 3/Issue 47/June 13, 2016 Page 2347 In such situations, transferrin receptor/log ferritin ratio
calculated by automated haematology analysers may be useful in distinguishing these two conditions.10 In the
present study, the utility of automated haematology analysers which give effectively new laboratory parameters related to mature RBCs and Reticulocytes, helping in differentiation of anaemia of iron deficiency and anaemia of longstanding duration and anaemia associated with chronic diseases was evaluated.
MATERIALS AND METHODS: The present study was
conducted in the department of clinical pathology of Kannur Medical College, Anjarakandy, Kannur, Kerala. It was approved by the Ethical Committee of the Institute. 287 blood samples were selected from the samples arriving at the central laboratory of the Institute from various departments of the Medical College Hospital and so informed
consent was waived off. The patient’s samples showing
Haemoglobin less than 12.0 g/dL for females and less than 14.0 g for males were selected from the workload of blood samples arriving at central laboratory with a requisition of investigation to exclude anaemia.
Inclusion Criteria: Patient’s samples selected when
Haemoglobin is <12 g/dL in females and < 14.0 g/dL in males.
Exclusion Criteria: Patients who have undergone blood transfusions within three months are excluded from the
study. Patients with β-thal associated with other kinds of
anaemia, patients with reticulocytosis or pancytopenia are excluded. Patients who are on Iron therapy are excluded from the study. These samples were classified depending upon their iron status analysis (Using commercial kits from Roche Diagnostics, Germany): Iron deficiency was labelled when the serum iron (SI) levels were <45 mg/dL for males and <30 mg/dL for females and transferrin saturation <15% for males and females, serum ferritin <30 µg/L for males and <13 µg/L for females.
The samples were labelled as anaemia due to iron deficiency in chronic disease when SI levels were normal or less than normal (40-160 mg/dL and 30-160 mg/dL in males and females respectively), transferrin saturation was normal or less than normal (3-50%), serum ferritin levels were normal or high (30-400 µg/L and 13-150 µg/L for males and females respectively and C-reactive protein >5 mg/L (Tin-Quant C-reactive Protein, Roche Diagnostics, Germany).
Soluble transferrin receptor (sTfR) levels (Roche Diagnostics, Germany) were measured in all samples, and the sTfR/log ferritin ratio was used to identify iron deficiency in patients with Iron Deficiency Anaemia. Patients with Iron Deficiency anaemia showing sTfR/log ferritin >2.06 or sTfR
>3.71 μg/mL (Cut-off values indicative of iron deficiency in
our laboratory) were classified as Iron deficiency following chronic diseases. Blood samples showing normal Haemoglobin levels were used as a control group consisting of apparently healthy persons, including absence of acute inflammation/infection, with normal haematologic findings, and C-reactive protein <5 mg/L.
The healthy individuals were students and laboratory staff, all of whom had donated blood samples on a voluntary basis. Determination of red cell and reticulocyte parameters was performed using a Beckman-Coulter LH 750 automated haematological analyser which provided the following parameters: Ret-He, % MicroR, haemoglobin content of red cells obtained from optical counting (RBC-He), and % Hypo He. The MHe index was calculated as % MicroR − % HypoHe. The Mann–Whitney test was used to compare the groups. A receiver operator characteristic (ROC) curve was used to evaluate the accuracy of the parameters to differentiate between the different types of anaemia. The level of significance was set at a p-value <0.05. Data were analysed using SPSS for Windows, Version 13.0 (SPSS Inc., Chicago, IL, USA).
OBSERVATIONS AND RESULTS: In the present study,
the samples of patients with Iron deficiency anaemia (IDA) (n=132), anaemia of long duration (n=97) and anaemia associated with chronic disease with iron deficiency (n= 58).
Parameter IDA a ACD b ACD Combi Control Group
N 132 97 58 76
Age
Median/Range 41/18.5-71 36/19-67 39/22-70 41.5/18-77
Sex
Male/Female 87/45 38/59 32/26 31/45
Haemoglobin (G/dL)
Median/Range 7.4/6.5-11.2 9.8/8.2-11.6 9/6.8-10.4 13.5/12.4-14.4
MCV
Median/Range 74.2/60.2-77.5 73.5/56.5-81.4 79.2/60.2-96.4 88.6/82.4-94.5
MCH/(fl)
Median/Range 24.5/19.8-25.2 26.2/23-27.4 27.8/26.2-28.2 30/28.2-30.2
MCH (pg)
Median/Range 21.5/16.0-25.6 25.2/17.2-28.8 28.8/16.5-26.8 30.2/26.2-33.2
RDW
Median/Range 15.4/12.4-20.2 16.2/13.2-19.6 15.5/13.0-27.8 13.2/12.6-15.5
Table 1: Showing the Demographic Data Laboratory Findings of Patients and Control Group (n=287)
J. Evid. Based Med. Healthc., pISSN- 2349-2562, eISSN- 2349-2570/ Vol. 3/Issue 47/June 13, 2016 Page 2348
Parameters IDA a ACD b ACD Combi CG
N 132 97 58 76
Ret-He (pg)
Median/range 24.0/15.5-30.5 26.0/18.8-36.0 28.7/22.0-39.0 35.1/32.0-39.5
RBC-He (pg)
Median/Range 223.5/17.2-36.3 27.0/19.5-30.0 28.8/20.4-24.9 31.9/28.2-35.6
Hypo He (%)
Median/Range 6.2/0.5-44.5 4.2/1.4-30.5 1.3/0.4-16.2 0.2/0.1-0.9
Micro R (%)
Median/Range 12.5/0.5-47.5 14.5/0.6-56.5 5.5/1.4-47.5 1.6/0.8–4.0
MHe
Median/Range 5.8/9.8-22.6 7.2/0.0-28.5 4.05/0.5-35.5 1.15/0.3-3.7
Table 2: Showing the Iron Status Measurements Used to Classify the Patients in the Different Groups (N=287)
SI: Serum iron, TS: Transferrin saturation; SF: Serum ferritin; sTfR: Soluble transferrin receptor.
Parameters IDA a ACD b ACD Combi CG
N 132 97 58 76
Ret-He (pg)
Median/range 24.0/15.5-30.5 26.0/18.8-36.0 28.7/22.0-39.0 35.1/32.0-39.5
RBC-He (pg)
Median/Range 223.5/17.2-36.3 27.0/19.5-30.0 28.8/20.4-24.9 31.9/28.2-35.6
Hypo He (%)
Median/Range 6.2/0.5-44.5 4.2/1.4-30.5 1.3/0.4-16.2 0.2/0.1-0.9
Micro R (%)
Median/Range 12.5/0.5-47.5 14.5/0.6-56.5 5.5/1.4-47.5 1.6/0.8–4.0
MHe
Median/Range 5.8/9.8-22.6 7.2/0.0-28.5 4.05/0.5-35.5 1.15/0.3-3.7
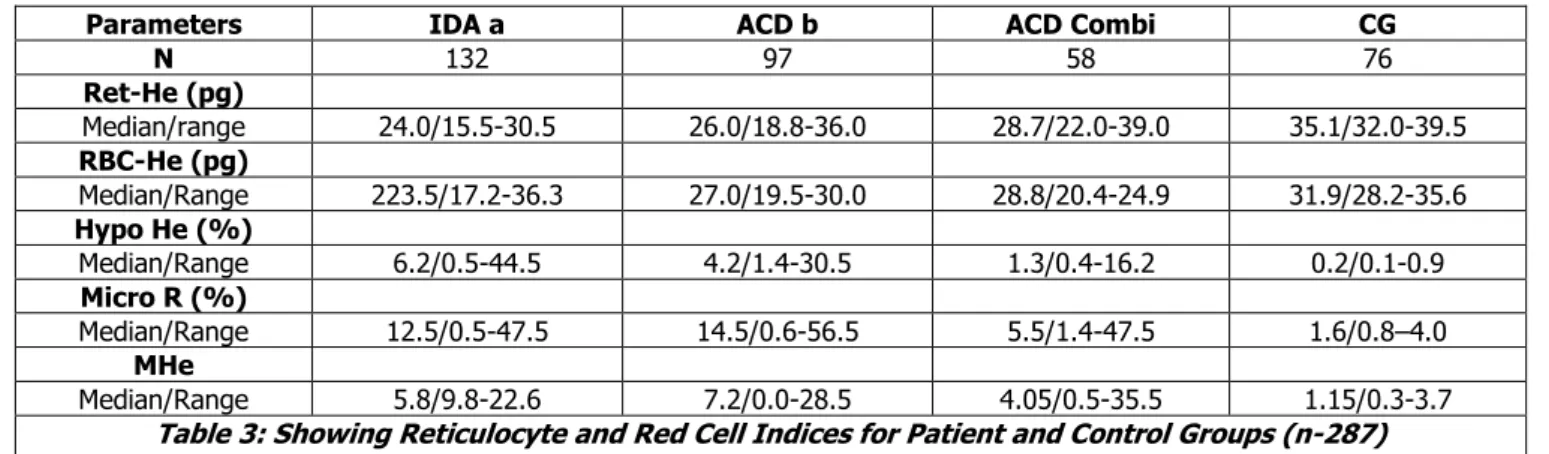
Table 3: Showing Reticulocyte and Red Cell Indices for Patient and Control Groups (n-287)
Ret-He: Reticulocyte haemoglobin content; RBC-He: Red blood cell haemoglobin content; HypoHe: Percentage of hypochromic red cells; MicroR: Percentage of Microcytic red cells; MHe: MicroR − HypoHe index.
Mann–Whitney test was applied for comparison between groups.
A: p ≤ 0.01 (ACD × ACD Combi). B: p < 0.001 (ACD × CG).
Applying the Mann–Whitney test in the present study, there was no significant difference between the IDA and ACD Combi groups in respect to all parameters. Comparing the ACD and ACD Combi groups, the RBC-He and Ret-He were significantly lower for the ACD Combi group (p-value =0.016 and p-value=0.003, respectively). Similarly, the %MicroR, %HypoHe and the value of MHe were significantly higher in the ACD Combi group (value=0.001, p-value=0.003 and p-value=0.014, respectively).
Although the ACD group showed sTfR/log ferritin values below the cut-off limit indicative of iron deficiency, the Ret-He and RBC-Ret-He values were significantly reduced when compared to the control group. However, the %HypoHe, %MicroR and MHe were higher (p-value <0.001 for all). Values below the cut-off of 13.8 showed a sensitivity of 96.2% and specificity of 92.7% in identifying IDA patients. A good performance was seen for the %MicroR (AUC: 0.886; CI 95%: 0.810–0.963), and values <25.0% gave sensitivity of 84.6% and specificity of 78.0% in detecting iron deficiency.
When the ROC curve was applied to the ACD and ACD Combi groups, the best performance was seen with the %HypoHe parameter, although with a moderate AUC value
(AUC: 0.785; 95% CI: 0.661–0.909; sensitivity 72.7%, and specificity 71.4%; cut-off: 1.8%).
The best parameter to distinguish IDA from ACD was the %HypoHe (AUC: 0.835; 95% CI: 0.737–0.933). A value for %HypoHe <2.45% had a sensitivity of 75.4% and specificity of 70.4% in identifying ACD. The AUCs were lower for RBC-He (AUC: 0.809; 95% CI: 0.696–0.922), Ret-He (AUC: 0.780; 95% CI: 0.661–0.899), and %MicroR (AUC: 0.785; 95% CI: 0.662–0.908). The capacity of the tests in discriminating IDA from ACD Combi was not satisfactory as the AUC was lower than 0.700 for all parameters.
DISCUSSION: Many authors have tested the diagnostic performance of reticulocyte parameters, especially for the diagnosis of iron deficiency in patients submitted to dialysis.10,11,6 Measuring the reticulocyte content is helpful in
detecting the earliest stages of iron deficiency, before anaemia develops.6,12,13 In conditions other than iron
deficiency, the reduction in reticulocyte haemoglobin was observed in haemoglobinopathies.14,15 In other studies also
using reticulocyte parameters were used in diagnosing IDA and ACD.2,8,16 Recent studies showed that classic indices like
mean cell haemoglobin and mean cell haemoglobin concentration are better to differentiate between IDA and ACD especially in geriatric patients rather than Ret-He.5
J. Evid. Based Med. Healthc., pISSN- 2349-2562, eISSN- 2349-2570/ Vol. 3/Issue 47/June 13, 2016 Page 2349 parameters like %MicroR, and %HypoHe, are tested either
alone or in combination.18
The MHe index was first proposed and tested by Urrechaga et al 19 The performance of this index was better
(Sensitivity 98.0% and specificity 95.9) than other published indices. Very few reports exist about the efficiency of other red cell parameters in patients with anaemia of inflammation associated with absolute iron deficiency. The clinical utility of the determination of the %Hypo has long been recognised in differentiating between iron-deficient and iron-sufficient patients with chronic kidney disease who receive erythropoietin stimulating agents.20 In patients with ACD,
the sTfR/log ferritin ratio values were calculated to identify iron deficiency. Unlike SI, transferrin and ferritin measurements the measurement of sTfR has been considered a good indicator of functional iron status as it does not suffer the influences of systemic inflammation.21,22
Thus, when there is a reduction of functional iron, transferrin receptor synthesis is stimulated. Iron deficiency is characterised by an increase in sTfR levels and low ferritin values, while in anaemia of inflammation, transferrin receptor levels are only slightly affected and serum ferritin is greatly increased.23 In clinical practice, this differentiation
is important because iron supplementation is beneficial for ACD Combi, but may be deleterious for ACD patients. The best parameter to distinguish ACD Combi from ACD was the %HypoHe even though the sensitivity and specificity were moderate. This is followed by %MicroR. In the present study, it was noted that there were no differences in test results between the IDA and ACD Combi groups. In contrast, there were differences observed when ACD was compared with IDA. The fact is that the absolute iron deficiency associated to ACD increases the number of microcytic and hypochromic red cells, developing cell features similar to IDA. ACD patients showed evidence of reduced iron availability for erythropoiesis, but the disturbance of the iron metabolism in functional iron deficiency was less remarkable than in the association of ACD with IDA.
CONCLUSION: In practical terms, the incorporation of new cellular indices can hasten the process of diagnosis of IDA and ACD. Consequently, target more quickly and more precisely the subsequent confirmatory examinations in order to introduce the appropriate treatment. But the difficulty in identifying absolute iron deficiency in patients with inflammatory conditions remains unaltered. Therefore, the challenges persist and other studies are needed to find a parameter with values in clinical decision making.
REFERENCES
1. Urrechaga E, Borque L, Escanero JF. Erythrocyte and reticulocyte parameters in iron deficiency and thalassemia. J Clin Lab Anal 2011;25(3):223–228. 2. Canals C, Remacha AF, Sardá MP, et al. Romero
clinical utility of the new Sysmex XE-2100 parameter
– reticulocyte haemoglobin equivalent – in the
diagnosis of anaemia. Haematologica
2005;90(8):1133–1134.
3. Sudmann AA, Piehler A, Urdal P. Reticulocyte haemoglobin equivalent to detect thalassemia and thalassemic haemoglobin variants. Int J Lab Hematol 2012;34(6):605–613.
4. MarkovicM, Majkic-Singh N, Ignjatovic S, et al. Reticulocyte haemoglobin content vs. soluble transferrin receptor and ferritin index in iron deficiency anaemia accompanied with inflammation. Int J Lab Hematol 2007;29(5):341–346.
5. Joosten E, Lioen P, Brusselmans C, et al. Is analysis of the reticulocyte haemoglobin equivalent a useful test for diagnosis of iron deficiency anaemia in geriatric patients? Eur J Int Med 2013;24(1):63–66. 6. Brugnara C, Schiller B, Moran J. Reticulocyte
haemoglobin equivalent (Ret He) and assessment of iron-deficient states. Clin Lab Haematol 2006;28(5):303–308.
7. Urrechaga E, Borque L, Escanero JF. The role of automated measurement of red cell subpopulations on the sysmex XE 5000 analyser in the differential diagnosis of microcytic anaemia.Int J Lab Hematol 2011;33(1):30–36
8. Thomas C, Thomas L. Anaemia of chronic disease: pathology and laboratory diagnosis. Lab Hematol 2005;11(1):14–23.
9. Mast A. The clinical utility of peripheral blood tests in the diagnosis of iron deficiency anaemia. Bloodline 2001;1:7–9.
10. Theurl I, Agner E, Theurl M, et al. Regulation of iron homeostasis in anaemia of chronic disease and iron deficiency anaemia diagnosis and therapeutic implications. Blood 2009;113(21):5277–5286. 11. Fishbane S, Shapiro W, Dukta P, et al. A randomized
trial of iron deficiency testing strategies in hemodialysis patients. Kidney Int 2001;60(6):2406– 2411.
12. Warady BA, Kausz A, Lerner G, et al. Iron therapy in the pediatric hemodialysis population. Pediatr Nephrol 2004;19(6):655–661.
13. Brugnara C. Reticulocyte cellular indices: a new approach in the diagnosis of anaemias and monitoring of erythropoietic function. Crit Rev Clin Lab Sci 2000;37(2):93–130.
14. Stoffman N, Brugnara C, Woods ER. An algorithm using reticulocyte haemoglobin content (CHr) measurement in screening adolescents for iron deficiency. J Adolesc Health 2005;36(6):529. 15. Chouliaras GL, Stamoulakatou A, Tsiftis G, et al. Age,
beta thalassaemia trait, and iron-deficiency anaemia significantly affect reticulocyte indices in pre-school children. Eur J Pediatr 2010;169(9):1097–1104. 16. Urrechaga E, Borges L, Escanero JF. Analysis of
J. Evid. Based Med. Healthc., pISSN- 2349-2562, eISSN- 2349-2570/ Vol. 3/Issue 47/June 13, 2016 Page 2350 18. Urrechaga E, Borque L, Escanero JF. Potential utility
of the new Sysmex XE 5000 red blood cell extended parameters in the study of disorders of iron metabolism. Clin Chem Lab Med 2009;47(11):1411– 1416.
19. Schoorl M, Schoorl M, Linssen J, et al. Efficacy of advanced discriminant algorithms for screening on iron-deficiency anaemia and β-thalassemia trait: a multicentric evaluation. Am J Clin Pathol 2012;138(2):300–304.
20. Tessitore N, Solero GP, Lippi G et al. The role of iron status markers in predicting response to intravenous iron in haemodialysis patients on maintenance erythropoietin. Nephrol Dial Transplant 2001;16(7):1416–1423.
21. Punnonen K, Irjala K, Rajamaki A. Serum transferrin receptor and its ratio to serum ferritin in the diagnosis of iron deficiency. Blood 1997;89(3):1052–1057. 22. Malope BI, MacPhail AP, Alberts M, et al. The ratio of
serum transferrin and serum ferritin in the diagnosis of iron status. Br J Haematol 2001;115(1):84–89. 23. Remacha AF, Sarda MP, Parellada M, et al. The role