1
Why banks want to be complex
∗∗∗∗Frank Hong Liua , Lars Nordenb, Fabrizio Spargolic
a
University of Glasgow, United Kingdom
b
Brazilian School of Public and Business Administration, Getulio Vargas Foundation, Brazil
cRotterdam School of Management, Erasmus University, the Netherlands
Abstract
We investigate whether and how bank complexity affects performance and systemic risk. We base the analysis on a complexity measure that captures diversification and diversity, controlling for size and other bank characteristics. We find that more complex banks exhibit a higher profitability, lower risk, and higher market share. Moreover, we show an inversely U-shaped relation between bank complexity and banks’ sensitivity to systemic shocks. The evidence challenges the view that higher bank complexity is per se bad and is consistent with theoretical models that show that diversity in the banking system is critical for financial stability.
Key words: Banks, performance, diversification, diversity, financial stability, systemic risk
JEL classification: G20, G21
∗
Corresponding author: Frank Hong Liu; University of Glasgow, Adam Smith Business School, Room 471, Gilbert Scott Building, Glasgow G12 8QQ, E-Mail: [email protected].
2 1. Introduction
The quasi collapse of the global financial system during the crisis of 2007-2009 has triggered an
extensive debate about the role of large complex banks. The debate initially focused on bank
size, revisiting the “too big to fail hypothesis”, but it quickly shifted to broader topics such as
systemic importance and complexity of banks. On the one hand, banks are now seen as “too
complex to fail”, as pointed out by the joint report of the International Monetary Fund et al.
(2009). Researchers and policy makers argue that the main danger is that financial institutions
and markets are becoming “too big to understand” or “too complex to depict”, and therefore need
to shrink and be simplified (Hu, 2012). On the other hand, bankers argue that caps on bank size
are inefficient because both size and complexity help banks diversify risks and innovate to create
additional profit opportunities. Some studies suggest that there are significant economies of scale
even for the largest banks (e.g., Hughes and Mester, 2013).
In this paper, we investigate whether and how bank complexity affects performance and
systemic risk. Our measure of bank complexity is defined in analogy to Hausmann et al. (2011),
who use international trade data to measure the complexity of a country’s economy. They argue
that the higher the number of products a country exports and the lower the number of other
countries exporting the same products, the greater the country’s economic complexity. We apply
the same logic to banks, using the number of activities they perform in analogy to the number of
products used by Hausmann et al. (2011). The approach relates bank complexity to two
fundamental concepts analyzed by Wagner (2011): diversification and diversity. Moreover, the
concept of diversity resonates with Caballero and Simsek (2013), who argue that complexity
3
to determine their own financial health. The diversity of bank activities increases complexity as
does distance in Caballero and Simsek (2013).
To measure bank complexity we proceed as follows. In the first step, we consider the extent
of three categories of key banking activities following the International Monetary Fund et al.
(2009): domestic banking, cross-border banking, and derivative activities. This approach reflects
diversification of banks.1 The more a bank is active in each of the three categories of activities,
the more complex it is. In a second step, we consider how ubiquitous these activities are in the
financial system and use this information as weights for these activities. Banks are more complex
when they engage more in activities that are more sophisticated and innovative, making them
different from the average bank in the financial system. This approach reflects diversity of banks.
For clarification, we do not measure complexity of bank products; our study is about complexity
of banks. We explicitly consider that bank size and complexity are related but not the same (e.g.,
Bonner, 2004).
We conduct two sets of empirical tests. In the first, we take the bank’s perspective,
investigating the link between complexity and performance at the individual bank level. We
focus on bank profitability, risk and market share. We hypothesize that more complex banks
have higher profitability, higher market share and lower risk than other banks. The reason is that
more complex banks are the ones engaging in a large number of sophisticated and innovative
activities. Since they cannot be easily and immediately replicated, these activities allow banks to
differentiate from their competitors. Such strategy is supposed to create value (e.g. Barney
(1986); Hoberg and Phillips (2014); Foucault and Frésard (2015)) and, at least in the short term,
1
4
generate monopoly power (Tufano (1989)). Hence, choosing unique activities increases
profitability and market share, by lowering the competitive pressure on banks. Moreover, this
positively affects the charter value of banks, reducing their incentives to take excessive risk
(Keeley, 1990; Allen and Gale, 2004).
In the second set of tests, we take the financial regulator’s perspective, investigating how
bank complexity relates to systemic risk, as measured by CoVaR (Adrian and Brunnermeier
2008) and marginal expected shortfall (MES) (Acharya et al. 2010). The conventional wisdom is
that bank complexity increases systemic risk, independently of size. The reason is that a complex
bank, i.e., a bank engaging in a wide range of sophisticated and innovative activities, is
presumably more interconnected and difficult to resolve than a bank with a limited scope
performing traditional activities. However, there are theoretical arguments suggesting
complexity might decrease systemic risk. In particular, Wagner (2010) argues that diversification
reduces idiosyncratic risk but creates systemic risk, as it implies that banks hold the same
portfolios. This increases the risk of joint asset liquidation, which depresses asset prices and
jeopardizes bank stability. Hence, some degree of diversity among banks’ portfolios is optimal.
Empirically, this implies complexity potentially decreases systemic risk, because performing
unique and rare activities is a way for banks to differentiate from each other. Given these
arguments have opposite predictions; we investigate the link between complexity and systemic
risk allowing for non-monotonic effects.
We base our analysis on data from consolidated financial statements of U.S. bank holding
companies (BHCs) during the period 1986-2013. We exclude foreign banks and focus on BHCs
at their highest hierarchical level since we assume the strategic business decisions are made at
5
38,632 bank-year observations. The panel structure of the dataset allows us to lag our variable of
interest (Complexity), add time and bank fixed effects, as well as time-varying bank controls,
including size. Hence, our results capture the effect of complexity, net of size.
Since bank complexity and performance might be endogenously determined, we employ
another empirical strategy to mitigate endogeneity concerns. This relies on a major structural
break in the U.S. banking system, i.e. the Gramm-Leach-Bliley Act of 1999 (Financial Services
Modernization Act). This act repealed the Glass-Steagall Act of 1933, and allowed banks to set
up holding companies to carry out commercial banking, investment banking, and to some extent
near- and non-bank activities. Our identification strategy relies on the hypothesis that the GLB
Act affected banks that were already active in investment banking prior to the GLB Act more
than other banks. The rationale is that these banks benefit the most from expanding further into
investment banking activities and increase their complexity. Empirically, we use information on
Section 20 subsidiaries of BHCs from Cornett, Ors and Tehranian (2002) to identify these banks.
We also check the robustness of the results splitting banks based on their size, assuming the very
large ones were the most affected by the GLB Act. This is consistent with Geyfman and Yeager
(2009), who document that stock returns of large banks reacted more strongly to the
announcement of the GLB act than those of small banks.
We obtain the following main results. First, we find that more complex banks exhibit a
significantly higher profitability, a significantly lower default risk, and a significantly higher
market share. Using the enactment of the Gramm-Leach-Bliley Act confirms these results. We
document a positive impact of this law on complexity and performance, which is more
6
results are in line with our hypothesis, as they suggest that individual banks exhibit a better
performance when they are more complex. Note that we control for bank size in all analyses.
Second, we do not find a monotonic positive relationship between complexity and systemic
risk, as suggested by conventional wisdom. We fail to find a statistically significant link between
complexity and CoVaR. However, we do find an inversely U-shaped relation between
complexity and MES. Interestingly, banks with intermediate complexity (“average banks”) are
those contributing the most to systemic risk, whereas the low and high complexity banks exhibit
a lower impact. A candidate explanation for this result is the diversification-diversity trade-off in
Wagner (2010). The reason is diversity, which is the strategy reducing systemic risk according to
Wagner (2010), can be achieved either by engaging in unique activities or focusing on some of
these activities. These two options correspond to high and low values of complexity,
respectively. By contrast, a bank with intermediate complexity is presumably operating a large
number of activities, but quite common. This resonates with the concept of full diversification,
which is what leads to systemic risk in Wagner (2010).2
Our study contributes to the literature in the following ways. First, we provide evidence that
is consistent with recent theoretical work on financial stability. Wagner (2010) shows the
existence of a trade-off between diversification and diversity, using a framework with
endogenous costs of liquidating assets. The intuition is that diversification reduces idiosyncratic
risk, which reduces the probability of having to liquidate assets, while diversity lowers the
exposure to systemic risk, as fewer investors liquidate the same portfolio at the same time. Our
measure of bank complexity combines both features: the diversification of activities at the bank
level and the diversity of activities at the financial system level. Furthermore, Caballero and
2
7
Simsek (2013) conceptualize complexity as banks’ uncertainty about the cross exposures in a
financial system. Banks know their own exposures but there is uncertainty about exposures of
banks that are more distant to them in the network. Complexity is a passive factor during normal
times, but it becomes an active factor during crises as it can trigger domino effects of
bankruptcies. Complexity matters in their model indirectly through the uncertainty it generates
and through the responses of banks to this uncertainty. Diversity in our measure of bank
complexity has similar effects as the uncertainty about cross exposures of distant banks in the
system in their theoretical model: both increase complexity.
Second, empirical work on bank complexity is scarce. Cetorelli, McAndrews and Traia
(2014) consider the organizational structure of banks, i.e., the number and type of subsidiaries
acquired through mergers and acquisitions. They document an increase in complexity over time,
with bank holding companies expanding the type of their subsidiaries and becoming less
bank-centric. For comparison, we measure bank complexity in a more general way, capturing changes
in banks’ organizational structure due to mergers and acquisitions but also organic growth in
banking activities. The complexity measure we use reflects the diversity of bank activities,
following the intuition that specific activities require more expertise than standard activities.
Third, our study indirectly relates to research on bank opaqueness. This literature is based on
the argument that bank loans are subject to asymmetric information, which is supposed to make
banks themselves informationally opaque (Campbell and Kracaw, 1980; Morgan, 2002;
Flannery, Kwan and Nimalendran, 2004). We note that bank complexity and opaqueness are
related, but do not coincide. For example, investors might be unable to assess a bank’s value in
spite of being informed on its activities. If these are strongly interconnected, or their value
8
The rest of this paper is organized as follows. In Section 2 we motivate and explain how we
measure bank complexity. In Section 3 we describe the data. In Section 4 we present the
empirical results on the link between bank complexity and performance, and bank complexity
and systemic risk. In Section 4 we summarize findings from further empirical checks and
robustness tests. We conclude in Section 5.
2. Measuring bank complexity
The finance literature does not provide a general definition of bank complexity. Our approach is
to use a measure of complexity originally defined for economies. We follow Hausmann et al.
(2011), who consider an economy as complex if it “can weave vast quantities of relevant
knowledge together, across large networks of people, to generate a diverse mix of
knowledge-intensive products” (Hausmann et al. 2011, pp. 18). They develop an index based on the number
of products a country exports and their ubiquity, that is the number of other countries exporting
the same products. The idea is that the economy of a country being the only producer of many
products is complex, because it requires a vast amount of knowledge.
We follow the same logic as Hausmann et al. (2011), using the activities a bank carries out
and their ubiquity as the equivalent of the products produced by a country. We define an activity
as any of the items of the FR_Y-9C Consolidated Financial Statements of Bank Holding
Companies (BHCs) listed in Appendix 1. In line with the International Monetary Fund et al.
(2009, p. 13), we divide activities in three broad categories, i.e. domestic, cross border, and
derivatives. Moreover, we refine the set of activities to obtain 26 domestic, 7 cross border, and
14 derivative ones3.
3
9
To calculate the measure of complexity, we follow three steps. First, we define the ubiquity
of an activity a in year t as:
, = , , (1)
The term , , is an indicator function that takes the value one if bank i operates the activity a in year t. This means ubiquity is the number of banks operating activity a in year t, as a fraction
of the total number of banks in year t. Ubiquity is an activity-specific attribute, obtained using
information on the whole banking system.
The second step is to calculate a bank-specific complexity measure, which reflects the
ubiquity of the activities each individual bank operates. We group the activities in the three broad
categories described above, i.e. domestic, cross border, and derivatives, and calculate the
following bank-specific complexity measure for each category:
, , = ##$ #! ", ,
,
∈ &1 − , ) (2)
For each bank i, category c, and year t, complexity is the volume of activity a in category c,
scaled by the total assets of the bank4, and weighted by the complementary of activity a’s
ubiquity. This means complexity increases with the number of activities a bank operates in each
category c, and decreases with the ubiquity of these activities.
4
10
The third step is to aggregate the three bank-specific complexity measures, corresponding to
the three categories of activities we consider in this study. This requires the definition of weights
for the three categories. Instead of using equal weights, or using the total volume of the activities
in each category, which would bias the measure in favor of derivative activities given their huge
size, our approach is to “let the data speak”. We use factor analysis, and define , as
the factor with the greatest explanatory power of the three , , measures.5
The concept of complexity we use in this study is related to two key dimensions of banks that
are widely used in the literature (Wagner 2010, 2011). The first is diversification, as complexity
increases with the number of different activities a bank operates. The second is diversity, in the
sense that the lower the number of other banks operating certain activities, the more complex
(and diverse) a bank engaged in those activities. Diversification and diversity interact with each
other and jointly determine the level of bank complexity. For example, let us consider bank A
and B from a large financial system. Bank A offers a wide range of products that are very
common in the financial system, while B offers a smaller range of products that are uncommon
and require sophisticated knowledge. Hence, bank A scores high on diversification, but low on
diversity (since the ubiquity of the bank’s products is high). In contrast, bank B scores low on
diversification, but high on diversity (since the ubiquity of the bank’s products is low). This
means bank A is more complex in terms of diversification, but B is more complex it terms of
diversity. Eventually, the interaction of diversification and diversity determines the overall level
of bank complexity.
5
11
The concepts of diversification and diversity relate to other views of complexity in the
literature. One view connects complexity to corporate governance, suggesting that an intricate
network of subsidiaries impairs an effective oversight at the banking group level (e.g. Cetorelli et
al. 2014; Lumsdaine et al. 2015). The concept of diversification is related to this view, because a
bank engaged in a wide range of activities is likely to have a network of subsidiaries. Another
view links complexity to the interconnectedness of banks (e.g. Caballero and Simsek 2013) that
might trigger a domino effect once a bankruptcy occurs. Diversification is related to
interconnectedness, in the sense that a bank exposed to many risk factors is more likely to be
exposed to contagion. Finally, a widespread view connects complexity to financial innovation,
which makes banks hard to value for outside investors. This relates to the concept of diversity, as
the activities operated by very few banks are likely innovative.
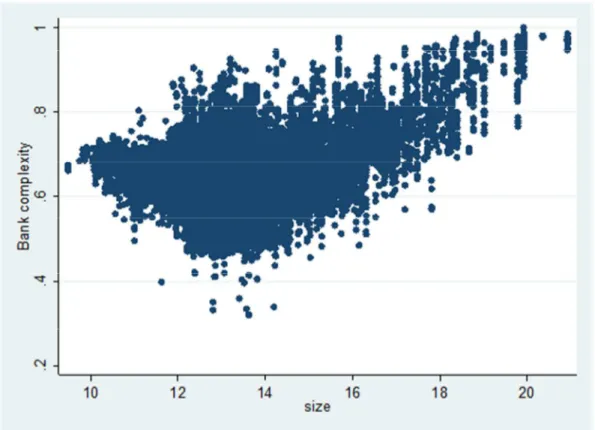
Finally, we point out that size is not a sufficient statistic for complexity. Figure 1 shows a
scatterplot of bank complexity against total assets, using yearly bank data from 1986 to 2013.
(Insert Figure 1 here)
The relation between bank complexity and bank size is not monotonic. The link is negative
for relatively small banks and it is positive for large banks. In particular, the relation is positive
for banks with total assets above $50 billion, for which the Dodd-Frank Act mandates enhanced
prudential regulation standards. Overall, size and complexity are positively, but not perfectly,
correlated. This observation can also be made on the basis of Appendix 2. The five most
complex banks are among the ten largest, but some of the banks with high complexity are ranked
12 3. Data
We obtain annual accounting data from FR_Y-9C Consolidated Financial Statements of Bank
Holding Companies (BHCs)6 in the United States from 1986 to 2013. We exclude banks with
majority foreign ownership and consider the BHCs at their highest hierarchy position since we
assume the strategic business decisions are made at the parent level rather than the subsidiary
level. We have in total 4,386 BHCs with 38,632 bank-year observations. Table 1 shows the main
variables and reports summary statistics.
(Insert Table 1 here)
We observe that the domestic activity index ranges from 0.41 to 1, with equal mean and
median being at 0.80. It indicates a normal distribution of banks undertaking diversified
activities. The majority of the banks do not undertake either cross border activity or derivative
activity since the median values for both are zero and the mean values are relatively small, being
0.05 and 0.09, respectively. Using factor analysis, we derive the first factor which explains the
variations of these three indices as our complexity measure, which ranges from 0.32 to 1. The
mean and median of bank complexity are very close, indicating that the distribution of
complexity is, unlike bank size, rather symmetric.
4. Empirical results
4.1 Bank complexity and performance
We start with a panel data analysis of the link between bank complexity and performance, as
measured by profitability (ROA), risk (bank Z-score), and market share. We address the potential
endogeneity by exploiting the panel structure of our dataset, which allows us to include bank and
6
13
year fixed effects. Moreover, we only use lags of the independent variables, mitigating potential
concerns about reverse causality. We further include a set of time-varying control variables to
isolate the effect of bank complexity from other variables that might affect bank performance.
We control for bank size (logarithm of total assets), leverage, liquidity, income diversification
(non-interest rate income as a fraction of total operating income), and efficiency (cost to income
ratio). It is crucial to include total assets as control variable in our analysis because we want to
identify effects of bank complexity that go beyond bank size. Table 2 reports the results.
(Insert Table 2 here)
The coefficient of complexity is positive and statistically significant at the 5%-level for all
three performance measures. The effect is also large in economic terms. If a bank increased its
complexity level from the minimum to the average value, its profitability and market share
would rise roughly by 15% and 64%, relative to the sample mean. Moreover, bank risk would
decrease by 17%. The effect of size is statistically significant at the one percent level for ROA
and market share. Whereas it is reasonable that large banks have more market share, the finding
also implies that larger banks are less profitable. The results suggest that complexity, rather than
size, makes it possible for banks to become more profitable and less risky.
These findings are consistent with the argument that complexity, which increases with the
diversity of a bank’s activities, is a strategy to differentiate from competitors and create value
(e.g., Barney (1986); Hoberg and Phillips (2014); Foucault and Frésard (2015)). In other words,
a complex bank, that is a bank engaging in a wide range of diverse activities, is less exposed to
competition. Hence, our evidence of a negative link between complexity and risk is consistent
with theories suggesting fiercer competition among banks increases their risk of default, by
14
As explained before, complexity is based on a factor analysis of the three bank activity
indices, namely the domestic, the cross border, and the derivative activity index. Hence, the
previous results indicate that complexity is beneficial for banks on average, but they do not show
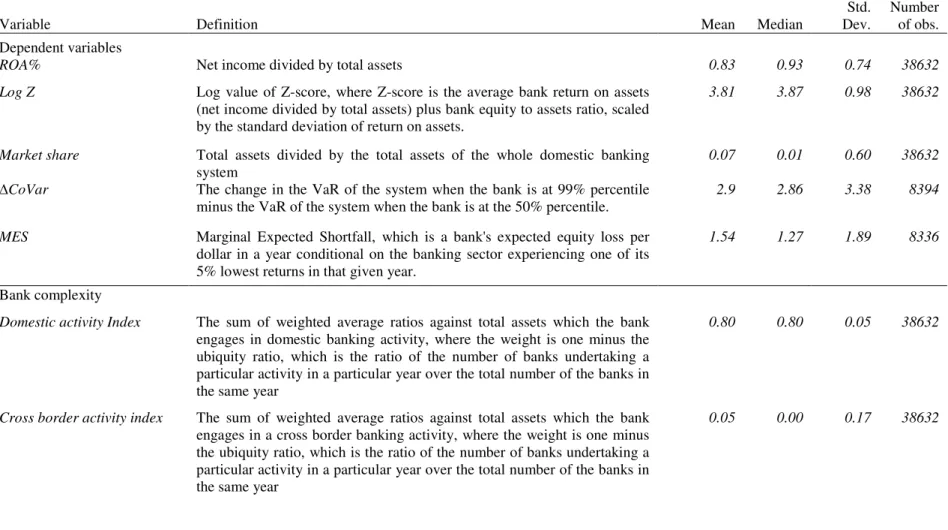
which aspect of bank complexity contributes more to performance. Table 3 shows the results.
(Insert Table 3 here)
Results indicate the domestic activity index mainly drives the link between overall
complexity and profitability. Considering the variables definitions, this implies the wider and the
more bank-specific the range of domestic on- and off- balance sheet activities, the greater
profitability. This still holds after including all the three components of complexity in the same
regression. Furthermore, the domestic activity index is the component of complexity that reduces
bank risk. Hence, not only does the scope and specificity of domestic activities increase
profitability, but also correspond to the reduction of default risk. A bank’s market share is
affected more by cross border activities rather than derivative activities. Furthermore, it is not
related to the bank domestic activity index.
By and large, the analysis shows that more complex banks exhibit a higher profitability,
lower risk and higher market share, after controlling for size. Complexity in terms of domestic
activities is the main driver of profitability and risk, while market share mainly depends on the
scope and specificity of cross border activities. Complexity in terms of derivative activities does
not affect bank performance.
4.2 Analysis of changes in bank complexity
We now investigate the link between changes in bank complexity and changes in performance,
15
Act repealed the Glass-Steagall (GS) Act of 1933, which required banks to engage only in
activities closely related to commercial banking. Under the new rules, banks could establish
financial holding companies, combining commercial banking, investment banking, and certain
other activities. Hence, the GLB Act did not only make it possible for banks to grow, but also to
become more complex.
Since the GLB Act applied to all U.S. banks, our empirical analysis also requires variation at
the bank level. We hypothesize the restrictions of the GS Act were more binding for banks that
were already active to some extent in investment banking before the GLB act. These banks most
likely desired to expand their scale and scope of investment banking but could not. This
reasoning implies that the enactment of the GLB Act should have induced these banks to engage
more in new activities than other banks. Empirically, we identify these banks using information
on Section 20 subsidiaries of BHCs before the year 1999. Banks with Section 20 subsidiaries
were already active in investment banking but both scale and scope was limited, because of a
25% revenue cap. Hence, our empirical strategy relies on the different sensitivity of Section 20
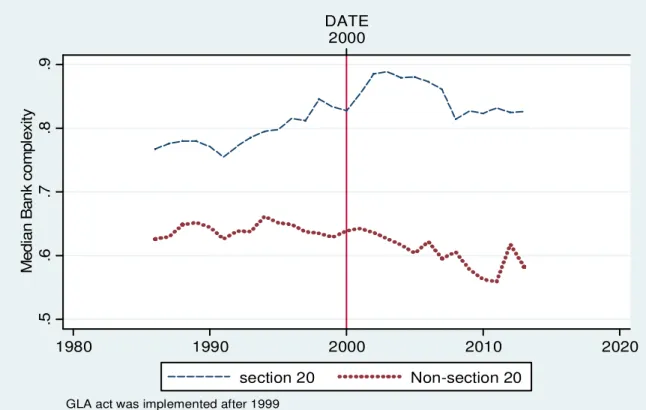
BHCs and other BHCs to the enactment of the GLB Act. Figure 2 shows the evolution of the
median bank complexity over time, distinguishing by whether the BHs have established section
20 subsidiaries before 1999. By following Cornett, ORS and Tehranian (2002), we set an
indicator variable Section 20 BHCs to one for those BHCs that have already Section 20
subsidiaries in place before 1999, and Non-Section 20 BHCs to zero otherwise. Following the
introduction of the GLB Act, complexity increases significantly for Section 20 banks on impact,
but gradually reverts in the 2000s to its pre-1999 level. One explanation is that Section 20 BHCs
initially expanded the range of their activities and became more different (increasing the
16
complexity measure again because the Section 20 BHCs lost their diversity on their
un-ubiquitous activities). Hence, the pattern of Section 20 BHCs reflects the increase in the ubiquity
of their activities in the 2000s, which makes them less diverse and therefore less complex
according to our definition. Most important, Figure 2 provides evidence in support of our
hypothesis that the GLB Act affected Section 20 BHCs more than Non-Section 20 BHCs.
(Insert Figure 2 here)
In the first model, we compare the treatment group (section 20 BHCs) with all other BHCs
using the full sample. In the second model, we match the Section 20 BHCs with a group of other
banks from same year and size decile using bank-specific variables to avoid possible biases from
time and bank size effects. The bank-specific matching variables are bank size, equity ratio,
liquidity ratio, non-interest income to total assets ratio and cost-to-income ratio. These
restrictions help to reduce an omitted variable bias, an approach similar to blocking in a
randomized experiment. We then look for each Section 20 subsidiary BHCs for another BHC
with the closest (lowest absolute value) difference in the probability estimate. The procedure is
carried out without replacement.7
We examine the effect of the GLB Act on bank complexity and afterwards the effect of the
GLB Act on the performance of Section 20 BHCs versus other banks in the post-GLB years. Our
main variable of interest is the interaction term of the variables Section 20 BHCs and PostGLB,
which is an indicator variable of 1 if it is after year 1999, and 0 otherwise. A positive coefficient
on this variable would be consistent with the results in the previous section because an increase
in bank complexity would correspond to an improvement in performance. We include time and
7
17
bank fixed effects and the same control variables as in Table 2 and 3 in the regression model.
Table 4 reports the results.
(Insert Table 4 here)
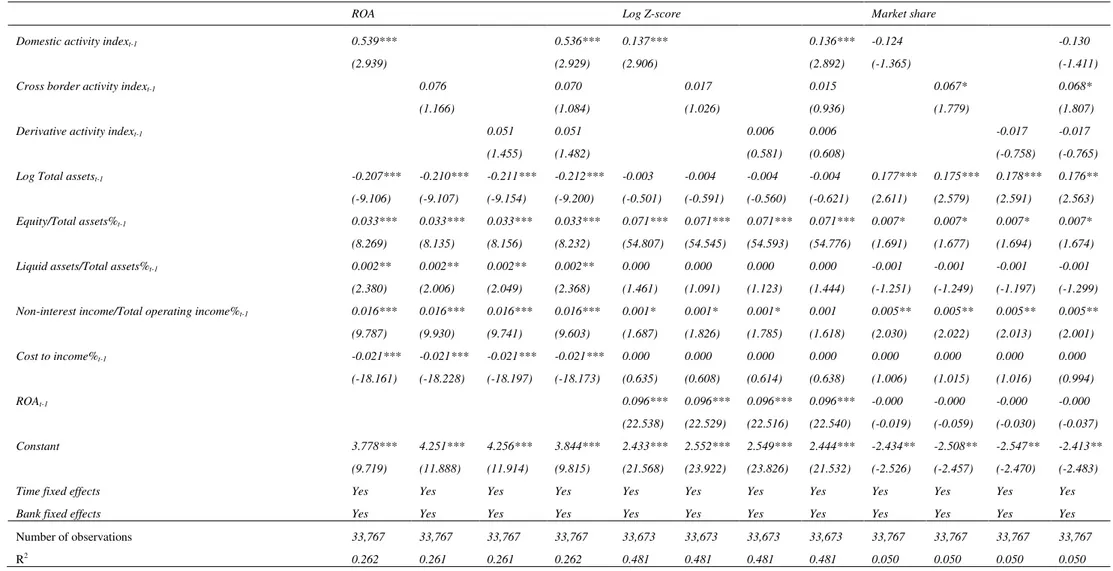
In Panel A of Table 4 we find that the Section 20 BHCs, relative to non-section 20 BHCs,
exhibit a significantly higher complexity, profitability and market share and significantly lower
risk after the GLB Act of 1999.
In Panel B of Table 4, we use the variable Top 2% banks as indirect proxy for the banks
whose complexity is most sensitive to the GLB act. We distinguish between very large banks and
other banks, using the 98% size distribution threshold to define the most affected banks.8
Consistent with the results from Panel A, we find that complexity increased for the Top 2%
banks and that there is a consistently positive impact of the increase in bank complexity on bank
performance.
The findings indicate that the GLB Act of 1999 led to an increase in complexity at Section 20
BHCs (Top 2% banks) and to a subsequent improvement of performance. The analysis confirms
the results from the panel data analysis in the previous section.
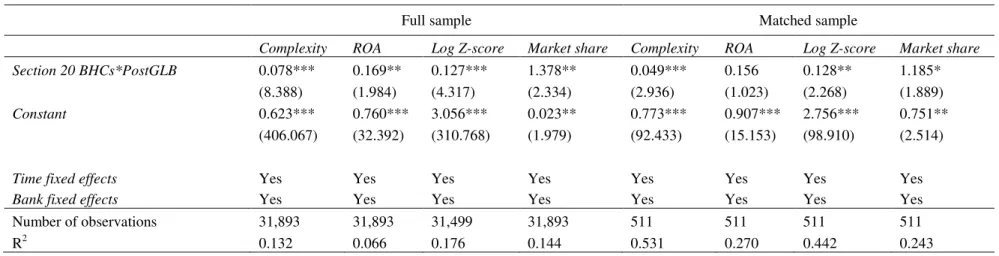
4.3 Bank complexity and systemic risk
In the analyses above we document a positive effect of bank complexity on individual bank
performance, which explains why banks want to be complex. However, these findings contradict
the experience from the financial crisis of 2007-2009, which suggests that banks that were
considered as “too complex to fail” took excessive risks because they enjoyed an implicit subsidy
8
18
from taxpayers. To assess whether our bank level findings also hold at the system level, we now
examine the link between bank complexity and systemic risk.
A key advantage of our analysis is that we can disentangle the effect of “too big” and “too
complex” to fail. We examine the effects of complexity on two measures of systemic risk. The
first measure is CoVaR (Adrian and Brunnermeier 2008).9 This measure indicates how much
the maximum loss to the whole banking system (VaR) would change when an individual bank
becomes financially distressed. The second measure is Marginal Expected Shortfall (MES)
(Acharya et al. 2010). This measure indicates the expected capital shortfall of an individual bank
in a crisis, defined as a systemic event where the whole banking system is undercapitalized.
Finally, we note the analysis in this section is based on data from listed banks, because the
computation of the systemic risk measures requires stock return data.
We regress the measures CoVaR and MES, respectively, on bank complexity and its
square, controlling for bank and year fixed effects as well as other bank level variables
potentially related to systemic risk. These variables include bank size, bank risk (stock return
volatility and leverage), stock return, and market to book ratio. The rationale for adding the
squared term of bank complexity is to investigate potential non-linear effects on systemic risk.
Table 5 reports the results for overall bank complexity and its components, respectively.
(Insert Table 5 here)
We obtain three results. First, overall complexity does not affect CoVaR. Second, overall
complexity has an inversely U-shaped effect on MES. Third, the inversely U-shaped effect is
also found for the domestic activity index on CoVaR. Moreover, Table 5 shows the domestic
(cross border) activity component of complexity have a significant effect on MES ( CoVaR).
9
19
The coefficients have the same sign as total complexity, and are statistically significant at least at
the 5%-level. This implies the domestic (cross border) activity component is the main driver of
the effect of complexity on MES ( CoVaR).
Overall, the findings do not support the conventional wisdom that systemic risk increases
with complexity. Our evidence suggests a non-monotonic relationship, with banks at an
intermediate level of complexity contributing more to systemic risk. We rationalize this finding
using the insights from Wagner (2010), who argues diversity of banks’ portfolios mitigates the
risk of joint asset liquidation. The intuition is the portfolios are diverse, that is different from the
full diversification benchmark, either if banks engage in unique activities or specialize in some
of the common activities. These two strategies correspond to high and low values of complexity,
respectively. For example, low complexity banks tend to be small community banks, which are
less sensitive to the stock market volatility, but rather to regional economic changes. By contrast,
a bank with intermediate complexity is presumably operating a large number of activities, but
quite common. Hence, the portfolio of these banks resembles the one with full diversification,
resulting in a high systemic risk according to Wagner (2010).
5. Further empirical checks and robustness tests
We conduct further empirical checks and robustness tests to examine whether our main results
are sensitive to the definition of complexity, sample periods, sub-samples, and bank size.
First, we study the differential effects of the two dimensions of bank complexity:
diversification and diversity of banks. For this purpose, we compare the effect of complexity
coming from diversification (i.e., ignoring diversity) with the overall complexity (coming from
20
an HHI index of the sum of the squares of each bank activity as a share of total bank activities
for each bank. Table 6 reports the regression results of the impact of bank diversification on
performance.
(Insert Table 6 here)
We confirm the results from Table 2 and 3 when we add Diversification to the regression
model. Diversification has no significant effect on bank performance, while complexity
continues to have a positive effect on all three performance measures.
Second, we study the robustness of the main results on systemic risk as shown in Table 5,
controlling for bank diversification. For each outcome variable ( CoVaR and MES), we report
four regression results. Table 7 presents the results.
(Insert Table 7 here)
The results from Table 7 are consistent with those reported in Table 5. Overall complexity
still exhibits the inversely U-shaped effect on MES, when we control for bank diversification.
Also, there is no effect of complexity on CoVaR. As before, we control for bank size, bank
fixed effects and time fixed effects.
Third, the recent financial crisis raises the question of how bank complexity responds during
crises and whether the impact of complexity on bank performance differs from the non-crisis
times. We address this question by interacting our bank complexity measure and the indicator
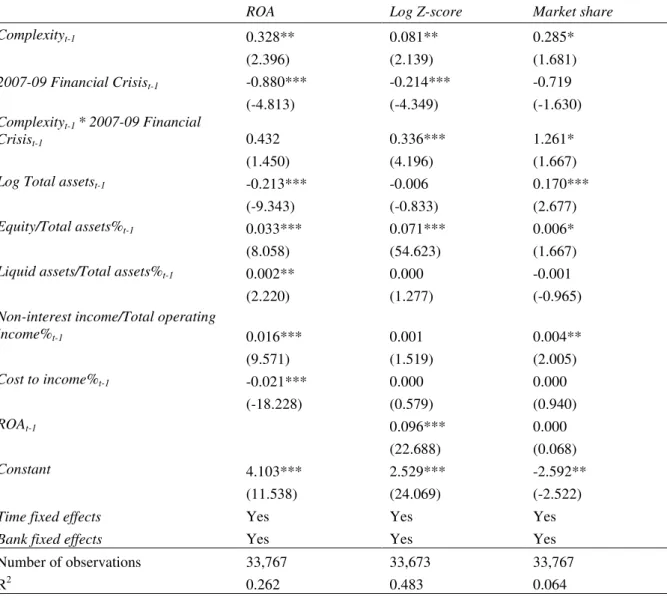
variable which equals one for the years between 2007 and 2009 and zero otherwise. Table 8
reports the regression results.
(Insert Table 8 here)
Whereas banks experienced deteriorating performance on profitability, stability and market
21
indicator variable), the positive impact of bank complexity on these bank performance measures
is intensified during the same period, as indicated by the positive and significant coefficients of
the interaction term between complexity and 2007-09 Financial crisis indicator in the regression
models for Log Z-score and market share. These results suggest that bank’s ability to diversify
into rare and specific activities is one of the keys for banks to survive the distressed period.
According to Wagner (2011), if all the banks diversify into the same activities, the benefits of
diversification may be reduced. Hence, in order to gain more diversification benefits, banks may
need to diversify more into more rare and specific activities, and hence become more complex.
Another interpretation is that a complex bank tends to be more sophisticated, and a more
sophisticated bank tends to have better ability to survive during a financial crisis.
6. Conclusion
We investigate the effects of bank complexity on performance and systemic risk. Using a
comprehensive measure of bank complexity for U.S. bank holding companies from 1986 to
2013, we show that more complex banks exhibit higher profitability, lower risk, and greater
market share. Our findings are consistent in panel data regressions and an analysis using the
Gramm-Leach-Bliley Act of 1999 as stimulus for complexity and its performance impact. Our
results explain why banks want to be complex. Furthermore, we investigate the effect of bank
complexity on systemic risk, as measured by CoVaR and MES. We find that banks with
intermediate complexity are the most sensitive ones to systemic shocks. We fail to find that more
complex banks exhibit a higher contribution to systemic risk, using the CoVaR measure.
Our findings contribute to the ongoing debate on “too big” and “too complex to fail”. We
show bank level benefits of higher complexity, explaining banks’ incentives to become complex.
22
is non-monotonic, indicating that high complexity stemming from high diversity in activities
lowers banks’ sensitivity to systemic shocks. The evidence challenges the view that higher bank
complexity is per se bad and is consistent with theoretical models showing that diversity in the
23
Appendix 1: Bank activities per category10
Domestic Activities
Core domestic deposit
• Fully insured brokered deposits • Core deposits
• Time deposits below limit • Time deposits above limit11
Other borrowing
• Federal Funds purchase
• Federal home loan borrowed
• Subordinated notes and debentures
• Acceptance and other liabilities
• Other unclassified borrowings
Loans
• Real estate loans
• Commercial loans
• Individual loans
• Agriculture loans
• Loans held for sale
Other bank investments
• Total securities
• Interest-bearing bank balances
• Federal funds sold
• Trading account assets
Fiduciary activities
• Personal trust and agency balance
• Corporate trust and agency balance
• Investment management and investment advisory agency accounts
• Foundation and endowment trust and agency balance
• Other fiduciary balance
Bank commitments
• Letters of credit
• Recourse exposure
• Loan commitments
Cross Border Activities
• Total deposits in foreign offices
10
We do not include standard balance sheet items that are held by each bank. These items may include, but not limited to, loan and lease allowance, premises and fixed assets, equity, etc.
11
24 • Total foreign securities invested
• Loans to foreign government and institutions • Loans to banks in foreign countries
• Trading assets in foreign offices • Assets in foreign non-bank subsidiary
• Other foreign loans
Derivative Activities
• Interest rate contracts
• Foreign exchange contracts
• Equity contracts
• Commodity contracts
• Futures and forwards
• Written options
• Purchased options
• Swaps
• Held-for-trading derivatives • Securitized assets
• Credit derivatives bank as guarantor • Credit derivatives bank as beneficiary
• Structured products
25
Appendix 2: Ranking of banks by complexity (2013)
Bank name Complexity
rank
Size
rank Complexity Total assets (bn $)
Bank name Complexity
rank
Size
rank Complexity
Total assets (bn $)
GOLDMAN SACHS GROUP 1 5 0.98 911.60 BANKGUAM HOLNDINGS 26 405 0.83 1.29
CITI GROUP 2 3 0.97 1880.38 MAINSOURCE FINANCIAL GROUP 27 208 0.83 2.86
JPMORGAN CHASE 3 1 0.97 2415.69 POPULAR 28 33 0.83 35.75
BANK OF AMERICA 4 2 0.96 2105.00 PNC FINANCIAL SERVICES GROUP 29 10 0.82
320.6 0 BANK OF NEW YORK
MELLON 5 8 0.92 374.31
THIRD FEDERAL SAVINGS AND LOANS
OF CLEVELAND, MHC 30 78 0.82 11.38
STATE STREET 6 12 0.92 243.03 ALLY FINANCIAL 31 16 0.82
151.1 7
GENERAL ELECTRIC CAPITAL 7 7 0.92 523.97 M&T BANK 32 23 0.81 85.16
NORTHERN TRUST 8 21 0.91 102.95 FLAGSTAR BANK HOLDING COMPANY 33 86 0.81 9.41
LOVE SAVINGS HOLDING
COMPANY 9 611 0.90 0.86 FIFTH THIRD BANK 34 18 0.81
129.6 9 NATIONAL CONSUMER
COOPERATIVE BANK 10 302 0.90 1.81 FIRST FINANCIAL 35 198 0.80 3.03
WELLS FARGO 11 4 0.90 1527.02 SVB FINANCIAL GROUP 36 38 0.80 26.42
DORAL FINANCIAL 12 94 0.89 8.49 U.S. BANCORP 37 9 0.80
364.0 2
CAROLINA FINANCIAL 13 596 0.88 0.88 LAURITZEN 38 299 0.80 1.83
AMERICAN INTERNATIONAL
GROUP 14 6 0.87 541.33 PRESIDENTIAL HOLDING 39 921 0.79 0.55
CIT GROUP 15 28 0.87 47.14 OFG BANCORP 40 97 0.79 8.16
AMERI-NATIONAL 16 897 0.87 0.57 ARVEST BANK GROUP 41 66 0.79 14.11
FRANDSEN FINANCIAL 17 329 0.86 1.64 RAYMOND JAMES FINANCIAL 42 48 0.78 21.92
AMERICAN EXPRESS 18 15 0.86 153.39 FLORIDA CAPITAL GROUP 43 1033 0.78 0.41
SNBNY HOLDINGS 19 109 0.86 6.67 COMERICA 44 25 0.78 65.36
FIRST HORIZON NATIONAL 20 45 0.85 23.79 APPLE FINANCIAL HOLDINGS 45 76 0.78 11.65
JOHN DEERE CAPITAL 21 35 0.85 31.68 EXTRACO CORP 46 429 0.78 1.21
MIDLAND FINANCIAL 22 83 0.85 9.62 EAST WEST BANCORP 47 41 0.78 24.73
COMMONWEALTH
BANKSHARES 23 644 0.84 0.82 LEADER BANCORP 48 791 0.78 0.66
BOK FINANCIAL 24 37 0.83 27.02 ESB FINANCIAL 49 291 0.77 1.91
26
References
Acharya, V., Pedersen, L., Philippon, T., Richardson, M., 2010. Measuring Systemic Risk.
NYU Stern Working Paper.
Adrian, T., Brunnermeier, M., 2008. CoVaR, Fed Reserve Bank of New York Staff Reports.
Allen, F., and Gale, D. 2004. Competition and financial stability. Journal of Money, Credit,
and Banking 36, 433-80.
Barney, J., 1986. Strategic factor markets: expectations, luck, and business strategy.
Management Science 32, 1231-1241
Berger, A., Bouwman, C., 2009. Bank Liquidity Creation. Review of Financial Studies 22,
3779-3837.
Berger, P., Ofek, E., 1995. Diversification’s effect on firm value. Journal of Financial
Economics 37, 39-65.
Bonner, J., 2004. Perspective: The size-complexity rule. International Journal of Organic
Evolution 58, 1883-1890.
Caballero, R., Simsek, A., 2013. Fire Sales in a Model of Complexity. Journal of Finance 68,
2549-2587.
Cetorelli, N., McAndrews, J., Traina J., 2014. Evolution in Bank Complexity. Economic
Policy Review, Federal Reserve Bank of New York, issue December, 85-106.
Cornett, M., Ors, E., and Tehranian, H., 2002. Bank Performance around the Introduction of a
Section 20 Subsidiary. Journal of Finance 57, 501-521.
Flannery, M., Kwan, S., Nimalendran, M., 2004. Market evidence on the opaqueness of
banking firms' assets. Journal of Financial Economics 71, 419-460.
Foucault, T., Frésard, L., 2015. Corporate Strategy, Conformism, and the Stock Market,
27
Geyfman, V., Yeager, T., 2009. On the Riskiness of Universal Banking: Evidence from
Banks in the Investment Banking Business Pre- and Post-GLBA. Journal of Money,
Credit and Banking 41, 1649-1669
Hausmann, R., Hidalgo, C., Bustos, S., Coscia, M., Chung, S.. Jimenez, J., Simoes, A.,
Yildirim, M., 2011. The Atlas of economic complexity: Mapping paths to prosperity.
Hoberg, G., Phillips, G., 2014. Product market uniqueness, organizational form and stock
market valuations. Working Paper.
Hu, H., 2012. Too complex to depict? Innovation, “pure information”, and the SEC
disclosure paradigm. Texas Law Review 90, 1601-1714.
Hughes, J., Mester, L., 2013. Who said large banks don’t experience scale economies?
Evidence from a risk-return-driven cost function. Journal of Financial Intermediation 22,
559-585.
International Monetary Fund, Bank for International Settlements and Financial Stability
Board, 2009. Guidance to Assess the Systemic Importance of Financial Institutions,
Markets and Instruments: Initial Considerations. Report to the G-20 Finance Ministers and
Central Bank Governors. October 2009.
Keeley, M.C., 1990. Deposit insurance, risk, and market power in banking, American
Economic Review 80, 1183-1200
Lang, L., Stulz, R., 1994. Tobin’s q, corporate diversification, and firm performance. Journal
of Political Economy 102, 1248-1280.
Lumsdaine, R.., Rockmore, D., Foti, N., Leibon, G., Farmer, J., 2015. The Intrafirm
Complexity of Systemically Important Financial Institutions. Working paper.
Morgan, D., 2002. Rating Banks: Risk and Uncertainty in an Opaque Industry. American
28
Stiroh, K., 2004. Diversification in Banking: Is Noninterest Income the Answer? Journal of
Money, Credit and Banking, 36, 853-882.
Stiroh, K., 2006. The dark side of diversification: The case of US financial holding
companies. Journal of Banking and Finance, 30, 2131-2161.
Tufano, P., 1989. Financial innovation and first-mover advantages. Journal of Financial
Economics 25, 213–240.
Wagner, W., 2010. Diversification at financial institutions and systemic crises. Journal of
Financial Intermediation 19, 373-386.
Wagner, W., 2011. Systemic Liquidation Risk and the Diversity-Diversification Trade‐Off.
29
Table 1: Variables and summary statistics
This table reports the definitions and summary statistics of the main variables. All the variables other than Log Total assets are winsorized at the 2nd and 98th percentiles of their distributions.
Variable Definition Mean Median
Std. Dev.
Number of obs. Dependent variables
ROA% Net income divided by total assets 0.83 0.93 0.74 38632
Log Z Log value of Z-score, where Z-score is the average bank return on assets (net income divided by total assets) plus bank equity to assets ratio, scaled by the standard deviation of return on assets.
3.81 3.87 0.98 38632
Market share Total assets divided by the total assets of the whole domestic banking system
0.07 0.01 0.60 38632
CoVar The change in the VaR of the system when the bank is at 99% percentile minus the VaR of the system when the bank is at the 50% percentile.
2.9 2.86 3.38 8394
MES Marginal Expected Shortfall, which is a bank's expected equity loss per dollar in a year conditional on the banking sector experiencing one of its 5% lowest returns in that given year.
1.54 1.27 1.89 8336
Bank complexity
Domestic activity Index The sum of weighted average ratios against total assets which the bank engages in domestic banking activity, where the weight is one minus the ubiquity ratio, which is the ratio of the number of banks undertaking a particular activity in a particular year over the total number of the banks in the same year
0.80 0.80 0.05 38632
Cross border activity index The sum of weighted average ratios against total assets which the bank engages in a cross border banking activity, where the weight is one minus the ubiquity ratio, which is the ratio of the number of banks undertaking a particular activity in a particular year over the total number of the banks in the same year
30
Derivative activity Index The sum of weighted average ratios against total assets which the bank engages in a derivative banking activity, where the weight is one minus the ubiquity ratio, which is the ratio of the number of banks undertaking a particular activity in a particular year over the total number of the banks in the same year
0.09 0.00 0.21 38632
Complexity The first factor of factor analysis of the Domestic, Cross border and Derivative activity indices. It is our measure of bank complexity.
0.64 0.63 0.06 38632
Bank variables
Section 20 BHCs An indicator variable that is one if the BHC has established Section 20 subsidiaries before 1999, and 0 otherwise.
0.0005 0.00 0.02 38632
Diversification Hirschmann-Herfindahl index of concentration of all the banking activities, which is the sum of the squares of the ratio of the volume of each activity divided by the volume of total activity of each bank each year. A bank is more diversified if this value is lower.
0.76 0.75 0.03 38632
Log Total assets Log value of total assets in millions of US dollars 13.21 12.92 1.35 38632 Equity/Total assets% Equity divided by total assets 8.53 8.30 2.71 38632 Liquid assets/Total assets% The sum of cash and for sale securities divided by total assets 0.11 0.00 0.14 38632 Non-interest income/Total
operating income%
31
Table 2: The effect of bank complexity on performance
This table presents regression results on the effect of bank complexity on ROA, natural Log of Z-score, and Market Share, All regressions are estimated with both time and bank fixed effects. The sample period is 1986-2013. T-statistics based on robust standard errors clustered by banks are shown in parentheses. *, **, and *** denote significance at the 10%, 5% and 1% levels, respectively. Variable definitions are given in Table 1.
ROA Log Z-score Market Share
Complexityt-1 0.405*** 0.141*** 0.514*
(2.849) (3.489) (1.952)
Log Total assetst-1 -0.213*** -0.005 0.170***
(-9.328) (-0.817) (2.655) Equity/Total assets%t-1 0.033*** 0.071*** 0.007*
(8.110) (54.661) (1.693)
Liquid assets/Total assets%t-1 0.179** 0.026 -0.032
(2.228) (1.231) (-0.663)
Non-interest income/Total
operating income%t-1 0.016*** 0.001 0.004**
(9.539) (1.442) (2.010)
Cost to income%t-1 -0.021*** 0.000 0.001
(-18.192) (0.653) (1.090)
ROA%t-1 0.096*** -0.000
(22.555) (-0.025)
Constant 4.053*** 2.487*** -2.763**
(11.415) (23.523) (-2.455)
Time fixed effects Yes Yes Yes
Bank fixed effects Yes Yes Yes
Number of observations 33,767 33,673 33,767
32
Table 3: The effect of the components of bank complexity on performance
This table presents regression results on the effect of bank complexity on ROA, natural Log of Z-score, and Market Share, All regressions are estimated with both time and bank fixed effects. The sample period is 1986-2013. T-statistics based on robust standard errors clustered by banks are shown in parentheses. *, **, and *** denote significance at the 10%, 5% and 1% levels, respectively. Variable definitions are given in Table 1.
ROA Log Z-score Market share
Domestic activity indext-1 0.539*** 0.536*** 0.137*** 0.136*** -0.124 -0.130
(2.939) (2.929) (2.906) (2.892) (-1.365) (-1.411)
Cross border activity indext-1 0.076 0.070 0.017 0.015 0.067* 0.068*
(1.166) (1.084) (1.026) (0.936) (1.779) (1.807)
Derivative activity indext-1 0.051 0.051 0.006 0.006 -0.017 -0.017
(1.455) (1.482) (0.581) (0.608) (-0.758) (-0.765)
Log Total assetst-1 -0.207*** -0.210*** -0.211*** -0.212*** -0.003 -0.004 -0.004 -0.004 0.177*** 0.175*** 0.178*** 0.176**
(-9.106) (-9.107) (-9.154) (-9.200) (-0.501) (-0.591) (-0.560) (-0.621) (2.611) (2.579) (2.591) (2.563)
Equity/Total assets%t-1 0.033*** 0.033*** 0.033*** 0.033*** 0.071*** 0.071*** 0.071*** 0.071*** 0.007* 0.007* 0.007* 0.007*
(8.269) (8.135) (8.156) (8.232) (54.807) (54.545) (54.593) (54.776) (1.691) (1.677) (1.694) (1.674)
Liquid assets/Total assets%t-1 0.002** 0.002** 0.002** 0.002** 0.000 0.000 0.000 0.000 -0.001 -0.001 -0.001 -0.001
(2.380) (2.006) (2.049) (2.368) (1.461) (1.091) (1.123) (1.444) (-1.251) (-1.249) (-1.197) (-1.299)
Non-interest income/Total operating income%t-1 0.016*** 0.016*** 0.016*** 0.016*** 0.001* 0.001* 0.001* 0.001 0.005** 0.005** 0.005** 0.005**
(9.787) (9.930) (9.741) (9.603) (1.687) (1.826) (1.785) (1.618) (2.030) (2.022) (2.013) (2.001)
Cost to income%t-1 -0.021*** -0.021*** -0.021*** -0.021*** 0.000 0.000 0.000 0.000 0.000 0.000 0.000 0.000
(-18.161) (-18.228) (-18.197) (-18.173) (0.635) (0.608) (0.614) (0.638) (1.006) (1.015) (1.016) (0.994)
ROAt-1 0.096*** 0.096*** 0.096*** 0.096*** -0.000 -0.000 -0.000 -0.000
(22.538) (22.529) (22.516) (22.540) (-0.019) (-0.059) (-0.030) (-0.037)
Constant 3.778*** 4.251*** 4.256*** 3.844*** 2.433*** 2.552*** 2.549*** 2.444*** -2.434** -2.508** -2.547** -2.413**
(9.719) (11.888) (11.914) (9.815) (21.568) (23.922) (23.826) (21.532) (-2.526) (-2.457) (-2.470) (-2.483)
Time fixed effects Yes Yes Yes Yes Yes Yes Yes Yes Yes Yes Yes Yes
Bank fixed effects Yes Yes Yes Yes Yes Yes Yes Yes Yes Yes Yes Yes
Number of observations 33,767 33,767 33,767 33,767 33,673 33,673 33,673 33,673 33,767 33,767 33,767 33,767
R2
33
Table 4: Bank complexity and performance around the GLB Act
We consider the passage of Gramm–Leach–Bliley (GLB) Financial Modernization Act in 1999 as an exogenous shock to bank complexity to study the causal effects. This table presents regression results on the three dependent variables, ROA, natural log of Z-score, and market share for the full sample and the matched sample. In Panel A, we consider all BHCs that have Section 20 subsidiaries in place before 1999 as the treatment group (Section 20 BHCs) and other banks as control group. In the full sample analysis, we compare the treatment group with all other BHCs. In the matched sample analysis, we match these Section 20 BHCs based on bank-specific variables, and constrain the matching to the same year and same size decile. The matched sample serves as control group. In Panel B, we consider the largest two percent of banks as treatment group. The dummy variable Top 2 % banks equals one for BHCs larger than 98% of the size distribution, and zero otherwise. The dummy variable PostGLB is one after the year 1999, and zero otherwise. All regressions are estimated with both time and bank fixed effects. The sample period is 1986-2006. We exclude the time period after 2006 to avoid the negative impact on bank complexity during and after the 2007-09 financial crisis. T-statistics based on robust standard errors clustered by banks are shown in parentheses. *, **, and *** denote significance at the 10%, 5% and 1% levels, respectively. Variable definitions are given in Table 1.
Panel A: Section 20 BHCs versus non-Section 20 BHCs
Full sample Matched sample
Complexity ROA Log Z-score Market share Complexity ROA Log Z-score Market share Section 20 BHCs*PostGLB 0.078*** 0.169** 0.127*** 1.378** 0.049*** 0.156 0.128** 1.185*
(8.388) (1.984) (4.317) (2.334) (2.936) (1.023) (2.268) (1.889) Constant 0.623*** 0.760*** 3.056*** 0.023** 0.773*** 0.907*** 2.756*** 0.751**
(406.067) (32.392) (310.768) (1.979) (92.433) (15.153) (98.910) (2.514)
Time fixed effects Yes Yes Yes Yes Yes Yes Yes Yes
Bank fixed effects Yes Yes Yes Yes Yes Yes Yes Yes
Number of observations 31,893 31,893 31,499 31,893 511 511 511 511
34
Table 4 (continued)
Panel B: Top 2% banks versus other banks
Complexity ROA Log Z-score Market share
Top 2% banks*PostGLB 0.062*** 0.143*** 0.049*** 0.846**
(8.654) (2.599) (4.275) (2.483)
Log Total assetst-1 -0.196*** -0.004 0.123***
(-7.367) (-0.504) (3.321) Equity/Total assets%t-1 0.016*** 0.064*** 0.005**
(3.654) (45.775) (2.169) Liquid assets/Total assets%t-1 -0.002** -0.000 -0.001
(-2.150) (-1.411) (-0.940) Non-interest income/
Total operating income%t-1 0.008*** -0.001 0.003*
(4.692) (-1.346) (1.710)
Cost to income%t-1 -0.015*** 0.001** 0.001
(-11.853) (2.473) (1.159) 0.081*** 0.003 (15.905) (0.673)
Constant 0.624*** 4.156*** 2.689*** -1.704***
(407.805) (10.264) (22.504) (-3.124)
Time fixed effects Yes Yes Yes Yes
Bank fixed effects Yes Yes Yes Yes
Number of Observations 31,893 27,552 27,480 27,552
35
Table 5: The effect of bank complexity on systemic risk
This table presents regression results on the effect of bank complexity on systemic risk. We use two measures to proxy bank systemic risk. The first is CoVaR from Adrian and Brunnermeier (2008), and the second is the marginal expected shortfall (MES) from Acharya et. al. (2010). Both systemic risk measures are transformed into their percentage forms to increase the magnitude of the estimated parameter coefficients. The table reports four regressions results with four different complexity measures for each systemic risk variables. All regressions are estimated with both time and bank fixed effects. The sample period is 1986-2013. T-statistics based on robust standard errors clustered by banks are shown in parentheses. *, **, and *** denote significance at the 10%, 5% and 1% levels, respectively.
CoVar MES
Domestic activity index Cross border activity index Derivative
activity index Complexity
Domestic activity index
Cross border activity index
Derivative
activity index Complexity
Complexityt-1 17.832* 0.071 0.143 6.036 20.279* 0.436 1.281*** 8.679**
(1.883) (0.122) (0.355) (1.386) (1.830) (0.799) (3.810) (2.359)
Complexity2t-1 -10.988* -0.754 -0.302 -4.565 -12.224* -0.759 -1.845*** -6.441**
(-1.857) (-0.737) (-0.473) (-1.374) (-1.794) (-0.930) (-3.608) (-2.413)
Annualized stock returnt-1 0.002*** 0.002*** 0.002*** 0.002*** 0.002*** 0.002*** 0.002*** 0.002***
(4.508) (4.508) (4.584) (4.440) (3.746) (3.778) (3.743) (3.692)
Annualized stock return volatilityt-1 0.151*** 0.154*** 0.153*** 0.153*** 0.272*** 0.276*** 0.280*** 0.276***
(8.020) (8.236) (8.178) (8.179) (9.709) (9.809) (10.025) (9.954)
Leveraget-1 0.008** 0.007** 0.007** 0.008** -0.024*** -0.025*** -0.026*** -0.025***
(2.292) (1.965) (2.103) (2.204) (-5.067) (-5.276) (-5.510) (-5.197)
Market to Book ratiot-1 -0.017 -0.027 -0.026 -0.023 0.074 0.065 0.057 0.068
(-0.298) (-0.458) (-0.443) (-0.398) (1.254) (1.118) (0.986) (1.170)
Log Total assetst-1 -0.110 -0.092 -0.108 -0.105 0.512*** 0.514*** 0.506*** 0.517***
(-1.561) (-1.377) (-1.520) (-1.486) (6.349) (6.296) (6.340) (6.417)
Constant -2.190 4.787*** 4.973*** 2.963* -12.957*** -4.668*** -4.603*** -7.582***
(-0.554) (4.719) (4.678) (1.677) (-2.819) (-3.761) (-3.792) (-4.424)
Time fixed effects Yes Yes Yes Yes Yes Yes Yes Yes
Bank fixed effects Yes Yes Yes Yes Yes Yes Yes Yes
Number of observations 7,352 7,352 7,352 7,352 7,348 7,348 7,348 7,348
36
Table 6: Bank diversification, complexity and performance
This table presents regression results on the effect of bank complexity and diversification on ROA, natural Log of Z-score, and Market Share, All regressions are estimated with both time and bank fixed effects. The sample period is 1986-2013. T-statistics based on robust standard errors clustered by banks are shown in parentheses. *, **, and *** denote significance at the 10%, 5% and 1% levels, respectively. Variable definitions are given in Table 1.
ROA Log Z-score Market Share
Diversificationt-1 0.020 0.052 0.612
(0.104) (1.203) (1.638)
Complexityt-1 0.410*** 0.150*** 0.611**
(2.883) (3.656) (1.980)
Log Total assetst-1 -0.213*** -0.006 0.166***
(-9.293) (-0.853) (2.693)
Equity/Total assets%t-1 0.033*** 0.071*** 0.007*
(8.113) (54.640) (1.673)
Liquid assets/Total assets%t-1 0.002** 0.000 -0.000
(2.283) (1.475) (-0.712)
Non-interest income/Total
operating income%t-1 0.016*** 0.001 0.004**
(9.532) (1.419) (2.026)
Cost to income%t-1 -0.021*** 0.000 0.001
(-18.214) (0.696) (1.274)
ROA%t-1 0.096*** 0.001
(22.566) (0.103)
Constant 4.041*** 2.473*** -2.887**
(11.355) (23.380) (-2.437)
Time fixed effects Yes Yes Yes
Bank fixed effects Yes Yes Yes
Number of observations 33,767 33,673 33,767