BAR, Rio de Janeiro, v. 15, n. 1, art. 2, e170055, 2018
http://dx.doi.org/10.1590/1807-7692bar2018170055
The Relationship between Sentiment and Risk in Financial
Markets
Ana Luiza Paraboni1 Marcelo Brutti Righi2 Kelmara Mendes Vieira3 Vinícius Girardi da Silveira3
Universidade Federal de Santa Catarina, Programa de Pós-Graduação em Administração, Florianópolis, SC, Brazil1 Universidade Federal do Rio Grande do Sul, Porto Alegre, RS, Brazil2 Universidade Federal de Santa Maria, Departamento de Ciências Administrativas, Santa Maria, RS, Brazil3
Abstract
This article estimates association coefficients between measures of market sentiment and risk in the U.S., German and Chinese markets. In terms of risk, four measures were considered: standard deviation, value at risk, expected shortfall and shortfall deviation risk. For market sentiment, data was collected using the Psych Signal technology, which is based on the behavior of investors on social networks. The results indicate significant statistical associations, with the direction of association having financial meaning. Moreover, the empirical findings are valid for all risk measurements. The results are in keeping with the Prospect Theory, since in moments when the sentiment indicates low liquidity (a negative value for the difference between Bullish and Bearish Intensities) investors try to reduce the negotiation volume, which has a positive impact on risk. On the other hand, under the inverted scenario, when sentiment indicates high liquidity, there is an increase in the negotiation volume and a consequent decrease in risk. This article is important because its observations of market sentiment as measured by social media data show a consistent relationship with measures of financial risk.
Introduction
Kahneman and Tversky (1979) put in check the Expected Utility Theory, which claims that agents are risk averse, take rational decisions and seek utility maximization, which gave rise to Prospect Theory, and subsequently the field of Behavioral Finance. This approach includes behavior when faced with decision making in situations of risk and observes that regret due to losses is greater than satisfaction due to gains. Therefore it is useful to explain situations where the traditional approach fails (see Al-Nowaihi, Bradley, & Dhami, 2008). Due to this contribution, many research topics have also gained space in the field of finance. One of these is market sentiment.
A series of studies verify that this variable is crucial to decision making in financial markets, since it affects distinct characteristics ranging from future information to liquidity. We can cite here the works of Barberis, Shleifer and Vishny (1998), Baek, Bandopadhyaya and Du (2005), Brown and Cliff ( 2005), Baker and Wurgler (2006), Bradley, Gonas, Highfield and Roskelley (2009), Feldman (2010), Hassan and Mertens (2011), Kuo and Chen (2012), Fong and Toh (2014), and Liu (2015). Despite the existence of many ways to compute market sentiment, there is still no consensus. One approach is to consider the quantity of initial public offerings to create a proxy, as has been done by Walker and Lin (2007), and Baker and Wurgler (2007). Another approach is to consider the expectations of future variations in prices (returns), as discussed by Qiu and Welch (2006) and Sturm (2014). Another alternative is investor confidence, which has been used by Lemmon and Portniaguina (2006), and Schmeling (2009).
Based on this content, we can observe that there is an intuitive relationship between market sentiment and risk in financial markets. Indeed, some studies offer arguments for the existence of such an association. We can mention here the works of Charoenrook (2005), Yazdipour (2011), Yazdipour and Neace (2013), Andersen and Nowak (2013), and Fong (2013), where the optimism and pessimism of investors seems to be directly reflected by the behavior of decision making related to risk. An optimistic investor accepts riskier situations than a pessimistic one. However, all these studies are mainly focused on subjective aspects of market risk, such as risk aversion. In contrast to this, the current tendency in market risk management is the development of objective approaches. One fundamental aspect of proper risk management is its measurement. (For a detailed analysis of ways to measure risk, see Righi & Ceretta, 2014). Overestimating risk can lead to a reduction in gains, while underestimating it can result in catastrophic outcomes. Thus, it is crucial to have the best understanding possible of what kind of information affects the measurement of market risk beyond the usual information regarding prices and returns. The first thing to look at would be some market variables related to liquidity, as in Dias (2013). Nonetheless, as we have noted, we must consider behavioral issues, especially market sentiment. Therefore, there is a gap to be filled regarding the relationship between measures of market sentiment and risk.
Method
As a proxy for market sentiment, we use the Psych Signal technology, which focuses on social networks by considering short message data to elaborate our indicator. This indicator directly reflects the emotions of individuals, bearing in mind that emotions are individual for psychology. The indicator has three main variables that seek to measure individuals’ sentiments about the market’s future. This indicator is consonant with the approach of Qiu and Welch (2006) and Sturm (2014), who measure market sentiment based on future investor expectations. More specifically, the first variable, called Bullish Intensity, analyzes market optimism according to a scale of 0 to 4, where 0 indicates the absence of this sentiment while 4 indicates the maximum presence of this sentiment. The second variable, called Bearish Intensity, suggests the presence of pessimism on the part of investors, and it is also measured on a scale of 0 to 4. Finally, the third variable, called Bull-Bear, measures the difference between the first two variables in order to give a measure of liquidity.
From an empirical point of view, we have chosen to investigate the U.S. (NASDAQ), German (DAX) and Chinese (SSEC) markets. We have selected these market indices because, in addition to their representativeness and volume in terms of the global economy and their continents, they are the only relevant market indices with the sentiment data that we require. Moreover, they represent distinct economic scenarios, and thus enrich our obtained results. We have collected daily data from quotation and sentiment variables for these markets, considering all information periods that were available through the Psych Signal technology at the time this study was prepared. This paper utilizes data from December 1, 2010 to August 27, 2015. This is the largest possible sample currently available to analyze these three markets.
Turning to the discussion of measures of risk, the risk of financial positions has been more scientifically addressed, ever since the notable work of Markowitz (1952). The use of variability measures, such as standard deviation, became common. Critical events began to be examined by using quantiles, such as Value at Risk (VaR). Duffie and Pan (1997) and Jorion (2007) have examined VaR in their studies. Despite the extensive practical use of VaR, the indiscriminate use of VaR began to be highly criticized because it is not a convex measure, as shown by Artzner, Delbaen, Eber and Heath (1999), which implies that the risk of a diversified position can be greater than the sum of individual risks. Thus, the expected value of losses that exceeds VaR, known as the Expected Shortfall (ES) proposed by Acerbi and Tasche (2002), Rockafellar and Uryasev (2002) and Pflug (2000), was defended as a potential risk measure. However, the variability concept, which is one of the pillars of the concept of risk, is ignored in this definition. Righi and Ceretta (2016) propose a new measure of risk called the Shortfall Deviation Risk (SDR), which can be defined as the ES, which is penalized by the dispersion of results that represent losses greater than ES. In addition to its concrete practical definition, SDR possesses solid theoretical properties that ensure that it can be used without violating axiomatic assumptions.
Thus, in this study we use four measures of risk, and their formulations appear below (1). These definitions have been adapted from Righi and Ceretta (2016). Let X signify the daily log-returns for each analyzed market. Given a significance level of 0 ≤ 𝛼 ≤ 1, and an aversion risk coefficient of 0 ≤ 𝛽, we have:
𝜎(𝑋) = (𝐸[(𝑋 − 𝐸ℙ[𝑋])2])
1 2. 𝑉𝑎𝑅𝛼(𝑋) = − inf {𝑥 ∶ 𝐹
𝑋(𝑥) ≥ 𝛼} = −𝐹𝑋−1(𝛼) = −𝑞𝛼(𝑋).
𝐸𝑆𝛼(𝑋) = −𝐸[𝑋|𝑋 ≤ 𝑞
𝛼(𝑋)] = −𝑒𝛼(𝑋).
𝑆𝐷𝑅𝛼(𝑋) = 𝐸𝑆𝛼(𝑋) + (1 − 𝛼)𝛽(𝐸 [|(𝑋 − 𝑒
𝛼(𝑋))−|2])
1 2.
(1)
expectation of X, adjusted by the negative sign and conditioned to X, as being a higher loss than VaR; i.e., an extreme loss. SDR is ES penalized by the semi-deviation of results worse than the ES. The term (1 − 𝛼)𝛽 represents how much dispersion shall be included as the ES penalty, which may serve as a
protection. The choice of values for 𝛽 enables the incorporation of subjective issues such as the agent’s degree of risk aversion.
To estimate risk measurements, we use the empirical method known as historical simulation (HS), which creates no assumptions about the data. Pérignon and Smith (2010) indicate that 76% of institutions that disclose their risk estimation procedures use HS. Let 𝐹𝑋𝐸 be the empirical distribution of 𝑋; then estimators of the measures considered can be represented by the following formulations (2):
𝜎̂𝛼 = [(𝑁)−1∑ (({𝑋} 1
𝑁−(𝑁)−1∑ ({𝑋} 1 𝑁) 𝑁
𝑖=1 )2) 𝑁 𝑖=1 ] 1 2 , 𝑉𝑎𝑅
̂𝛼= −(𝐹
𝑋𝐸)−1(𝛼),
𝐸𝑆̂𝛼 = −(𝑁𝛼)−1∑ ({𝑋} 1 𝑁∗ 𝟏
{𝑋}1𝑁<−𝑉𝑎𝑅̂𝛼)
𝑁
𝑖=1 ,
𝑆𝐷𝑅̂𝛼= 𝐸𝑆̂𝛼+ (1 − 𝛼)𝛽[(𝑁)−1∑ (|({𝑋} 1
𝑁− (−𝐸𝑆̂𝛼))−|2) 𝑁 𝑖=1 ] 1 2 . (2)
In (2) 𝑁 is the sample size, 𝛼 is the significance level, and 𝟏𝑞 is the indicator function that assumes the value 1 if q is true and assumes the value 0 if p is false. (𝑋)−= max(−𝑋, 0). We chose a parameter value of α = 0.05, β = 1, N = 250. These values represent, respectively, the significance level most often used in finance, a standardized risk aversion coefficient – the same used by Righi and Ceretta (2015), and around one year of daily data to compute the risk measurements for each day of the sample. These kinds of values appear in studies that perform estimations of risk such as Kuester, Mittnik and Paolella (2006), Alexander and Sheedy (2008), and Fan, Wong and Zeng (2012).
Hence, we now have 957 daily estimates for each measure of risk and each sentiment indicator for all of the markets. In order to understand the relationship between these measures of risk and market sentiment, we calculate correlation coefficients. We use the parametric version of Pearson, as well as the non-parametric alternatives of Kendall and Spearman. The advantage of correlations is their simplicity and the absence of the supposition of functional forms for the relationship, as occurs in regression techniques, for example. Nonetheless, it is possible to obtain an initial mapping of this relationship, which will be used for more complex analysis later.
Results
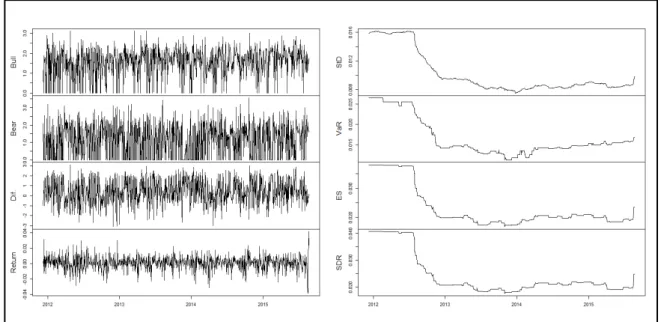
Figure 1. Time Series of Daily Data from Bullish and Bearish Intensities, Their Differences, Log-Returns and Risk Measurements for the U.S. Market
Table 1 presents descriptive statistics for the series in Figure 1. The Bullish Intensity series has a mean of 1.57, on a scale of 0 to 4, indicating that there is no extreme optimism. The same can be said about the Bearish Intensity, with a mean of 1.15. Moreover, the deviations of the sentiment variables are huge in relation to the means, especially for the Difference series. Concerning log-returns and risk measurements, there is a similarity in their deviations. In terms of skewness, there is a predominance of negative values. Risk measurements with corrected signs present the same behavior. This is a common stylized fact in terms of financial data. Exceeding kurtosis for all variables is near zero, with the exception of returns (leptokurtic) and Bearish Intensity (plactokurtic).
Table 1
Descriptive Statistics of Daily Data from Bullish and Bearish Intensities, Their Differences, Log-Returns and Risk Measurements for the U.S. Market
Mean Deviation Skewness Kurtosis
Bullish 1.57 0.71 -0.81 3.17
Bearish 1.15 0.96 0.07 1.65
Difference 0.42 1.24 -0.14 2.31
Returns 0.00 0.01 -0.28 4.57
Σ 0.01 0.01 1.31 3.03
VaR 0.02 0.01 1.22 2.98
ES 0.02 0.01 1.46 3.43
SDR 0.02 0.01 1.48 3.46
Note. The Bullish Intensity series has a mean of 1.57, on a scale of 0 to 4, indicating that there is no extreme optimism. The same can be said about the Bearish Intensity, with a mean of 1.15. Moreover, the deviations of the sentiment variables are huge in relation to the means, especially for the Difference series. Concerning log-returns and risk measurements, there is a similarity in their deviations. In terms of skewness, there is a predominance of negative values. Risk measurements with corrected signs display the same behavior. This is a common stylized fact in terms of financial data. Exceeding kurtosis for all variables is near zero, with the exception of returns (leptokurtic) and Bearish Intensity (plactokurtic).
Difference have negative relationships to risk and do exhibit statistical significance for all correlations, while the Bullish Intensity has a positive relationship and is significant only for the Spearman correlation. These results indicate that when risk increases, optimism decreases and pessimism increases. Also, Bullish Intensity dominates Bearish Intensity as reflected by the results for the Difference. It is valid to note that the results for the three types of measure associations are quite similar. This is a robust result for this paper, since our findings do not depend on this choice.
Table 2
Correlations of Daily Data from Bullish Intensity, Bearish Intensity and Their Differences with the Risk Measurements for the U.S. Market
Pearson
Σ VaR ES SDR
Bullish -0.14 -0.13 -0.13 -0.13
Bearish 0.00 0.01 0.00 0.00
Difference -0.08 -0.08 -0.08 -0.08
Spearman
Σ VaR ES SDR
Bullish -0.08 -0.04 -0.10 -0.10
Bearish -0.04 0.06 0.06 0.06
Difference -0.09 -0.08 -0.11 -0.12
Kendall
Σ VaR ES SDR
Bullish -0.05 -0.03 -0.07 -0.07
Bearish 0.03 0.04 0.04 0.04
Difference -0.06 -0.06 -0.08 -0.08
Note. Generally speaking, correlations have low absolute values. Nonetheless, Bullish Intensity and Difference have negative relationships to risk and do exhibit statistical significance for all correlations, while the Bullish Intensity has a positive relationship and is only significant for the Spearman correlation. These results indicate that when risk increases, optimism decreases and pessimism increases. Also, the Bullish Intensity dominates Bearish Intensity as reflected by the results for the Difference.
Bold values are statistically significant at a 5% level.
Table 3
Descriptive Statistics of Daily Data from Bullish and Bearish Intensities, Their Differences, Log-Returns and Risk Measurements for the German Market
Mean Deviation Skewness Kurtosis
Bullish 1.81 0.39 -0.31 4.64
Bearish 1.80 0.35 -1.31 8.60
Difference 0.02 0.49 0.31 5.56
Returns 0.00 0.01 -0.02 4.64
Σ 0.01 0.01 0.91 2.29
VaR 0.02 0.01 0.99 2.64
ES 0.03 0.01 1.13 2.65
SDR 0.03 0.01 1.15 2.66
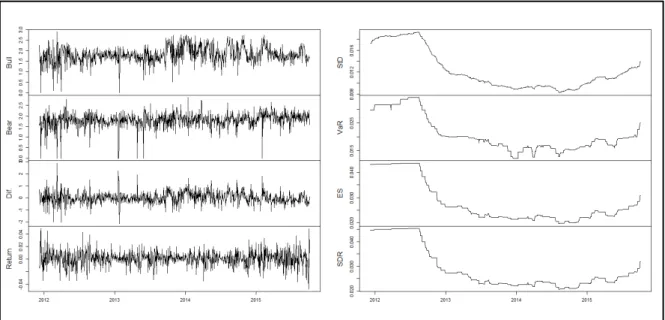
Note. The means and deviations for the Bullish and Bearish Intensities are so similar that they effectively nullify each other. This is confirmed by the fact that the Difference variable has a mean that is very close to zero. In terms of risk measurements, the descriptive pattern is identical to that for the U.S. market but with slightly larger magnitudes, reflecting a riskier profile. The same similarity occurs in terms of skewness, but the kurtosis shows some differences. The sentiment variables are leptokurtic.
Figure 2. Time Series of Daily Data from Bullish and Bearish Intensities, Their Differences, Log-Returns and Risk Measurements for the German Market
Table 4
Correlations of Daily Data from Bullish Intensity, Bearish Intensity and Their Differences with the Risk Measurements for the German Market
Pearson
σ VaR ES SDR
Bullish -0.25 -0.26 -0.23 -0.23
Bearish -0.11 -0.13 -0.13 -0.13
Difference -0.12 -0.12 -0.09 -0.09
Spearman
σ VaR ES SDR
Bullish -0.25 -0.25 -0.23 -0.23
Bearish -0.06 -0.09 -0.07 -0.08
Difference -0.17 -0.15 -0.14 -0.14
Kendall
σ VaR ES SDR
Bullish -0.17 -0.17 -0.15 -0.15
Bearish -0.04 -0.06 -0.05 -0.06
Difference -0.12 -0.10 -0.09 -0.09
Note. In general, correlations for the German market have higher values than those for the U.S. market, and are statistically significant. Pearson and Spearman coefficients exhibit larger values than the Kendall coefficient. The signs and their interpretations follow those for the U.S. market, with increases in risk leading to a decrease in optimism and an increase in pessimism.
Bold values are statistically significant at a 5% level.
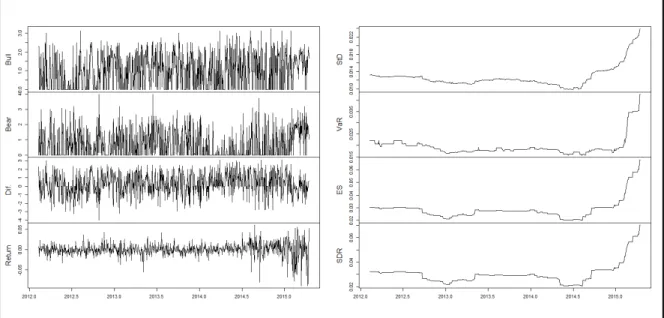
Figure 3. Time Series of Daily Data from Bullish and Bearish Intensities, Their Differences, Log-Returns and Risk Measurements for the Chinese Market
Table 5 presents the results of the descriptive analysis. The sentiment variables have low values for their means, the lowest among the three studied markets, with high deviations and positive skewness. The descriptive statistics for log-returns and risk measurements follow the same pattern as the other markets. The main difference is in terms of kurotosis, which shows low values for the sentiment variables and high values for risk. This is a possible reflection of the fact that China is an emerging market.
Table 5
Descriptive Statistics of Daily Data from Bullish and Bearish Intensities, Their Differences, Log-Returns and Risk Measurements for the U.S. Market
Mean Deviation Skewness Kurtosis
Bullish 0.99 0.94 0.28 1.68
Bearish 0.73 0.93 0.95 2.70
Difference 0.27 1.33 -0.18 2.55
Returns 0.00 0.02 -0.96 8.79
Σ 0.01 0.01 2.44 9.60
VaR 0.02 0.01 3.27 14.25
ES 0.03 0.01 2.77 11.71
SDR 0.03 0.01 2.44 10.15
Note. The sentiment variables have low values for their means, the lowest among the three studied markets, with high deviations and positive skewness. Descriptive statistics for the log-returns and risk measurements follow the same pattern as the other markets. The main difference is in terms of kurotosis, which has low values for the sentiment variables and high values for risk. This is a possible reflection of the fact that China is an emerging market.
Table 6
Correlations of Daily Data from Bullish Intensity, Bearish Intensity and Their Differences with the Risk measurements for the Chinese Market
Pearson
Σ VaR ES SDR
Bullish 0.10 0.05 0.08 0.08
Bearsih 0.26 0.24 0.27 0.26
Difference -0.11 -0.13 -0.13 0.13
Spearman
Σ VaR ES SDR
Bullish -0.01 -0.11 -0.05 -0.04
Bearish 0.17 0.11 0.16 0.15
Difference -0.13 -0.16 -0.15 -0.14
Kendall
Σ VaR ES SDR
Bullish -0.01 -0.08 -0.04 -0.03
Bearish 0.12 0.08 0.11 0.11
Difference -0.09 -0.11 -0.11 -0.10
Note. One can note that the Pearson correlation has the highest values, followed by the Spearman and then Kendall correlations. Most of the relationships are statistically significant. Regarding sign and analysis, the results corroborate those found in the previous two markets. The specificity in this case is that pessimism has higher correlations to risk that optimism.
Bold values are statistically significant at a 5% level.
Concluding Remarks
Our results indicate the existence of a significant relationship between measures of market sentiment and risk. Moreover, these results practically do not change for distinct measures of risk, which emphasizes that there is an association between risk and sentiment, no matter which measure is used. In terms of markets, the developed U.S. and German markets demonstrate a stronger relationship between optimism and risk, while the emerging Chinese market demonstrates a stronger relationship between pessimism and risk. These results corroborate, in terms of decision making, the findings of Charoenrook (2005), Yazdipour (2011), Yazdipour and Neace (2013), and Fong (2013). Nonetheless, our results conflict with those obtained by Andersen and Nowak (2013), who argue that the relationships should have signs that are the inverse of those that we have found. Moreover, our results are in keeping with the Prospect Theory, since in moments when sentiment indicates low liquidity (a negative value for the difference between Bullish and Bearish Intensities) investors try to reduce the negotiation volume, which positively affects risk. On the other hand, under the inverse scenario, when sentiment indicates high liquidity, there is an increase in the negotiation volume and a consequent decrease in risk.
forecasting procedures for measuring risk with forecasts that are adjusted for sentiment, in order to verify if there are practical advantages to sentiment adjusted forecasting.
References
Acerbi, C., & Tasche, D. (2002). On the coherence of expected shortfall. Journal of Banking & Finance, 26(7), 1487-1503. https://doi.org/10.1016/S0378-4266(02)00283-2
Alexander, C., & Sheedy, E. (2008). Developing a stress testing framework based on market risk models. Journal of Banking and Finance, 32(10), 2220-2236. https://doi.org/10.1016/j.jbankfin.2007.12.041
Al-Nowaihi, A., Bradley, I., & Dhami, S. (2008). A note on the utility function under prospect theory. Economics Letters, 99(2), 337-339. https://doi.org/10.1016/j.econlet.2007.08.004
Andersen, J. V., & Nowak, A. (2013). An introduction to socio-finance. Berlin, Heidelberg: Springer. https://doi.org/10.1007/978-3-642-41944-7
Artzner, P., Delbaen, F., Eber, J.-M., & Heath, D. (1999). Coherent measures of risk. Mathematical Finance, 9(3), 203-228. http://dx.doi.org/10.1111/1467-9965.00068
Baek, I.-M., Bandopadhyaya, A., & Du, C. (2005). Determinants of market assessed sovereign risk: Economic fundamentals or market risk appetite?. Journal of International Money and Finance, 24(4), 533-548. https://doi.org/10.1016/j.jimonfin.2005.03.007
Baker, M., & Wurgler, J. (2006). Investor sentiment and the cross-section of stock returns. Journal of Finance, 61(4), 1645-1680. http://dx.doi.org/10.1111/j.1540-6261.2006.00885.x
Baker, M., & Wurgler, J. (2007). Investor sentiment in the stock market. Journal of Economic Perspectives, 21(2), 129-151. http://dx.doi.org/10.1257/jep.21.2.129
Barberis, N., Shleifer, A., & Vishny, R. (1998). A model of investor sentiment. Journal of Financial Economics, 49(3), 307-343. https://doi.org/10.1016/S0304-405X(98)00027-0
Bäuerle, N., & Müller, A. (2006). Stochastic orders and risk measures: Consistency and bounds. Insurance: Mathematics and Economics, 38(1), 132-148. https://doi.org/10.1016/j.insmatheco.2005.08.003
Ben-Tal, A., & Teboulle, M. (2007). An old-new concept of convex risk measures: The optimized certainty equivalent. Mathematical Finance, 17(3), 449-476. http://dx.doi.org/10.1111/j.1467-9965.2007.00311.x
Bradley, D. J., Gonas, J. S., Highfield, M. J., & Roskelley, K. D. (2009). An examination of IPO Secondary market returns. Journal of Corporate Finance, 15(3), 316-330. https://doi.org/10.1016/j.jcorpfin.2009.01.003
Brown, G. W., & Cliff, M. T. (2005). Investor sentiment and asset valuation. The Journal of Business, 78(2), 405-440. http://dx.doi.org/10.1086/427633
Denuit, M., Dhaene, J., Goovaerts, M., Kaas, R., & Laeven, R. (2006). Risk measurement with equivalent utility principles. Statistics and Decisions, 24(1), 1-25. https://doi.org/10.1524/stnd.2006.24.1.1
Dias, A. (2013). Market capitalization and value-at-risk. Journal of Banking & Finance, 37(12), 5248-5260. https://doi.org/10.1016/j.jbankfin.2013.04.015
Duffie, D., & Pan, J. (1997). An overview of value at risk. The Journal of Derivatives, 4(3), 7-49. https://doi.org/10.3905/jod.1997.407971
Fan, G., Wong, W. K., & Zeng, Y. (2012). Capturing tail risks beyond VaR. Review of Pacific Basin Financial Markets and Policies, 15(3), 1250015. https://doi.org/10.1142/S0219091512500154
Feldman, T. (2010). A more predictive index of market sentiment. Journal of Behavioral Finance, 11(4), 211-223. https://doi.org/10.1080/15427560.2010.526892
Fong, W. M. (2013). Risk preferences, investor sentiment and lottery stocks: A stochastic dominance approach. Journal of Behavioral Finance, 14(1), 42-52. https://doi.org/10.1080/15427560.2013.759579
Fong, W. M., & Toh, B. (2014). Investor sentiment and the MAX effect. Journal of Banking and Finance, 46, 190-201. https://doi.org/10.1016/j.jbankfin.2014.05.006
Goovaerts, M. J., Kaas, R., & Laeven, R. J. A. (2010). Decision principles derived from risk measures. Insurance: Mathematics and Economics, 47(3), 294-302. https://doi.org/10.1016/j.insmatheco.2010.07.004
Hassan, T. A., & Mertens, T. M. (2011). Market sentiment: A tragedy of the commons. American Economic Review, 101(3), 402-405. http://dx.doi.org/10.1257/aer.101.3.402
Jorion, P. (2007). Value at risk: The new benchmark for managing financial risk (3rd ed.). New York: McGraw-Hill.
Kahneman, D., & Tversky, A. (1979). Prospect theory: An analysis of decision under risk. Econometrica, 47(2), 263-291. http://dx.doi.org/10.2307/1914185
Kuester, K., Mittnik, S., & Paolella, M. S. (2006). Value-at-risk prediction: A comparison of alternative strategies. Journal of Financial Econometrics, 4(1), 53-89. https://doi.org/10.1093/jjfinec/nbj002
Kuo, M. H., & Chen, S. K. (2012). Prospect theory and disposition patterns: Evidence from Taiwan investors. Studies in Economics and Finance, 29(1), 43-51. https://doi.org/10.1108/10867371211203846
Lemmon, M., & Portniaguina, E. (2006). Consumer confidence and asset prices: Some empirical evidence. The Review of Financial Studies, 19(4), 1499-1529.https://doi.org/10.1093/rfs/hhj038
Liu, S. (2015). Investor sentiment and stock market liquidity. Journal of Behavior Finance, 16(1), 51-67. https://doi.org/10.1080/15427560.2015.1000334
Ma, C., & Wong, W.-K. (2010). Stochastic dominance and risk measure: A decision-theoretic foundation for VaR and C-VaR. European Journal of Operational Research, 207(2), 927-935. https://doi.org/10.1016/j.ejor.2010.05.043
Markowitz, H. (1952). Portfolio selection. The Journal of Finance, 7(1), 77-91. http://dx.doi.org/10.1111/j.1540-6261.1952.tb01525.x
Pérignon, C., & Smith, D. R. (2010). The level and quality of value-at-risk disclosure by commercial banks. Journal of Banking & Finance, 34(2), 362-377. https://doi.org/10.1016/j.jbankfin.2009.08.009
Pflug, G. C. (2000). Some remarks on the value-at-risk and the conditional value-at-risk. In S. P. Uryasev (Ed.), Probabilistic constrained optimization. nonconvex optimization and its applications (Vol. 49, pp. 272-281). Boston, MA: Springer. https://doi.org/10.1007/978-1-4757-3150-7_15
Qiu, L. X., & Welch, I. (2006, July 28). Investor sentiment measures [NBER working paper number 10794]. Social Science Research Network (SSRN) database. https://dx.doi.org/10.2139/ssrn.589641
Righi, M. B., & Ceretta, P. S. (2014). Teoria de medidas de risco: Uma revisão abrangente. Revista Brasileira de Finanças, 12(3), 411-464. Retrieved from http://bibliotecadigital.fgv.br/ojs/index.php/rbfin/article/view/42537/50217
Righi, M. B., & Ceretta, P. S. (2015). A comparison of Expected Shortfall estimation models. Journal of Economics and Business, 78, 14-47. https://doi.org/10.1016/j.jeconbus.2014.11.002
Righi, M. B., & Ceretta, P. S (2016). Shortfall deviation risk: An alternative for risk measurement. Journal of Risk, 19(2), 81-116. http://dx.doi.org/10.21314/JOR.2016.349
Robert, C. Y., & Therond, P. E. (2014). Distortion risk measures, ambiguity aversion and optimal effort. ASTIN Bulletin, 44(2), 277-302. https://doi.org/10.1017/asb.2014.3
Rockafellar, R. T., & Uryasev, S., (2002). Conditional value-at-risk for general loss distributions. Journal of Banking & Finance, 26(7), 1443-1471. https://doi.org/10.1016/S0378-4266(02)00271-6
Schmeling, M. (2009). Investor sentiment and stock returns: Some international evidence. Journal of Empirical Finance, 16(3), 394-408. https://doi.org/10.1016/j.jempfin.2009.01.002
Sturm, R. R. (2014). A turning point method for measuring investor sentiment. Journal of Behavioral Finance, 15(1), 30-42. https://doi.org/10.1080/15427560.2014.877464
Wächter, H. P., & Mazzoni, T. (2013). Consistent modeling of risk averse behavior with spectral risk measures. European Journal of Operational Research, 229(2), 487-495. https://doi.org/10.1016/j.ejor.2013.03.001
Walker, T. J., & Lin, M. Y. (2007). Dynamic relationships and technological innovation in hot and cold issue markets. International Journal of Managerial Finance, 3(3), 200-228. https://doi.org/10.1108/17439130710756899
Yazdipour, R. (2011). A behavioral finance approach to decision making in entrepreneurial finance. In R. Yazdipour (Ed.), Advances in entrepreneurial finance: With application from behavioral finance and economics (pp. 11-29). New York: Springer. https://doi.org/10.1007/978-1-4419-7527-0_2
Authors’ Profiles
Ana Luiza Paraboni
Universidade Federal de Santa Catarina, Programa de Pós-Graduação em Administração, Campus Universitário – Trindade, 88040-900, Florianópolis, SC, Brazil. E-mail address: [email protected]. https://orcid.org/0000-0001-5997-1889
Marcelo Brutti Righi
Universidade Federal do Rio Grande do Sul, Rua Washington Luiz, 855, 90010-460, Porto Alegre, RS, Brazil. E-mail address: [email protected]. https://orcid.org/0000-0002-5772-0514
Kelmara Mendes Vieira
Universidade Federal de Santa Maria, Av. Roraima, 1000, prédio 74C, sala 4212, 97105-900, Santa Maria, RS, Brazil. E-mail address: [email protected]. https://orcid.org/0000-0002-8847-0941
Vinícius Girardi da Silveira