MȚA, COMPETITION AND PERFORMANCE IN THE SLOVENIAN
BANKING SYSTEM
Andreea Nicoleta Popovici *
Drago Gabriel Turliuc †
Abstract: The process of mergers and acquisitions is the main method used by financial institution to grow and to obtain better performance. The main effect of the implication of banks in mergers and acquisitions (M&A) translates into a higher degree of market share of the banks and also that the small banks will soon become global banks. This article underlines the relationship between bank performance and degree of concentration of the Slovenian banking sector during 2006-2012 using a simple linear regression model.
Keywords: banks; M&A; concentration; performance. JEL Classification: F30; G34; L 10.
INTRODUCTION
The European banking sector had a rapid series of M&A’s (mergers and acquisitions) beginning
with the 1990s. Similar to the M&A’s in other economic sectors, the economic rationale, such as the importance of value creation, efficiency and market power, has motivated the process of M&As in EU banks. Several factors have combined to facilitate the consolidation in the EU banking system, which include the globalization of the international financial system, technological development, regulatory reform, the introduction of the euro and the shrinking of country-specific barriers such as language and culture.
In order to obtain growth through M&A, many European banks looked at new opportunities in different geographical areas to benefit from the effects of geographical diversification. Many European banks entered into cross-border bank M&A deals both within and outside Europe.
The main effect of the implication of banks in M&A is the descending number of banks that do business into a country, and this translates into a higher degree of market share of the banks and also that the small banks will soon become global banks.
Considering these aspects, in this paper we want to seek a connection between the performance and the degree of concentration of the Slovenian banking system.
1.
MARKET STRUCTURE CONDUCT PERFORMANCE HYPOTHESISThe market structure conduct and performance (SCP) framework was derived from the neo-classical analysis of markets. There are two competing hypotheses in the SCP paradigm: the traditional
“structure performance hypothesis” and “efficient structure hypothesis”. The structure performance
hypothesis states that the degree of market concentration is inversely related to the degree of competition. This is because market concentration encourages firms to collude. More specifically, the standard SCP paradigm asserts that there is a direct relationship between the degree of market concentration and the degree of competition among firms.
This hypothesis will be supported if positive relationship between market concentration (measured by concentration ratio) and performance (measured by profits) exist, regardless of efficiency of the firm (measured by market share). Thus, firms in more concentrated industries will earn higher profits than firms operating in less concentrated industries, irrespective of their efficiency.
In this paper, we will explore the traditional hypothesis and we will try to demonstrate it using a sample data from Slovenian banking sector, taking into consideration data included in 2006-2012 interval.
It is important to see how the mergers and acquisitions have an impact on the degree of concentration in a banking system. To fulfill that, we want to take into-considerations the results that the next authors had in their studies. Dermine (2003) concludes in his study that the domestic consolidation has contributed significantly to operating efficiency and has increased the degree of concentration in several EU countries.
Altumbas and Marques-lbanez (2008) point out in their paper that an increase in banking concentration tends to drive loan rates up in many local markets thereby probably hampering, to some extent, the pass-through from market to bank lending rates.
Ayadi and Pujals (2005) utter about the importance of the evolution of cross-border mergers and acquisitions and their contribution to the increased levels of concentration within individual European banking markets.
Hernando and Nieto (2008) show in their paper that Cross-border banking in Europe remained rather limited until the launching of the Euro and that banks operating in more concentrated markets are less likely to be acquired by other banks in the same country but are more likely to be acquired by banks in other EU-25 countries.
Therefore, it is questionable whether large banks made big profits are a consequence of their operations concentrated markets and adopting pricing practices, or superior production and management techniques that reduce costs, resulting in high profitability.
2. THE MAIN CHARACTERISTICS OF THE SLOVENIAN BANKING SYSTEM
According to the data published by ECB (2013), the total assets of all banks and savings banks stood at EUR 46.1 billion at the end of 2012, of which banks and the branches of foreign banks accounted for EUR 45.6 billion, while savings banks accounted for EUR 567 million. The banks thus accounted for 98.8% of the total assets of the Slovenian banking system. The total assets of banks and savings banks amounted to 130% of GDP. The total assets of banks and savings banks as a percentage of GDP were down 6 percentage points last year as a result of the contraction in total assets.
Regarding ownership of banking assets in the banking sector in Slovenia, there were seven banks under majority foreign ownership operating in Slovenia at the end of 2012, three of which were branches of foreign banks. Ten banks were under majority domestic ownership. The proportion of the banks’ equity held by non-residents was up 2 percentage points last year to stand at 41%, of which the proportion held by nonresidents with equity holdings exceeding 50% stood at 32.3%. Government ownership as measured by equity was up minimally to stand at 22.9%, as it can be seen in table number 1.
Table 1 - Ownership structure of the banking sector (in terms of equity)
(%) 2006 2007 2008 2009 2010 2011 2012
Central government 17.9 15.1 17.7 20.5 20.1 22.7 22.9
Other domestic entities 44.4 47.2 44.1 43.0 42.9 38.1 35.8
Non residents, from which 37.7 37.8 38.2 36.6 37.1 39.3 41.3
Non-residence (over 50% control) 27.7 26.8 27.6 26.8 27.9 30.1 32.3
Non-residence (under 50% control 10.0 11.0 10.6 9.8 9.2 9.1 9.1
Source: Financial Stability Report 2013, Bank of Slovenia, available at http://www.bsi.si, p.40
Table 2 - Market concentration of the Slovenian banking market as measured by the Herfindahl-Hirschman index and market share of the top three/five banks
Index
Calculation method
2008 2009 2010 2011 2012 Change
(2012/2011)
HH Total assets 1.275 1.262 1.149 1.11 1.041 -68
Loans to non-banking sector 1.218 1.164 1.122 1.067 1.042 -26
Liabilities to non-banking sector
1.578 1.278 1.471 1.392 1.256 -136
Liabilities to banks 1.217 1.047 1.243 1.209 1.179 -30
Market share of the top three banks
Total assets 47.7 47.7 45.7 44.7 43.2 -1.5
Loans to non-banking sector 46.7 46.0 45.9 44.4 43.5 -1.9
Liabilities to non-banking sector
55.9 55.7 54.3 53.1 49.7 -3.4
Liabilities to banks 48.0 46.3 53.9 53.6 52.3 -1.3
Market share of the top five banks
Total assets 59.1 59.8 59.2 58.9 57.1 -1.8
Loans to non-banking sector 59.2 58.5 59.0 58.2 56.7 -1.5
Liabilities to non-banking sector
68.2 67.9 66.7 65.5 62.5 -3.0
Liabilities to banks 63.6 61.3 67.9 67.9 67.5 -0.4
Source: Financial Stability Report 2013, Bank of Slovenia, available at http://www.bsi.si, p.40
Regarding the performance indicators of the banking sector in Slovenia, as shown in Table 3, the values of ROA and ROE were evolving, an increase from 2006 to 2007, and in 2007 a downward trend with a steep slope for ROE.
Table 3 - Bank performance indicators in percentages
% 2006 2007 2008 2009 2010 2011 2012
ROA 1.24 1.35 0.67 0.32 -0.19 -1.06 -1.59
ROE 15.14 16.28 8.15 3.87 -2.3 -12.54 -18.85
Costs/gross income 57.91 52.94 57.27 53.95 52.2 53.68 47.42
Interest margin on interest bearing assets 2.35 2.32 2.21 1.98 2.14 2.13 1.93
Interest margin on total assets 2.19 3.79 3.01 2.88 2.88 2.87 3.23
Source: Financial Stability Report 2013, Bank of Slovenia, available at http://www.bsi.si , p.57
3. IMPLICATION OF THE CONCENTRATION ON THE PERFORMANCE OF THE
BANKING SYSTEM
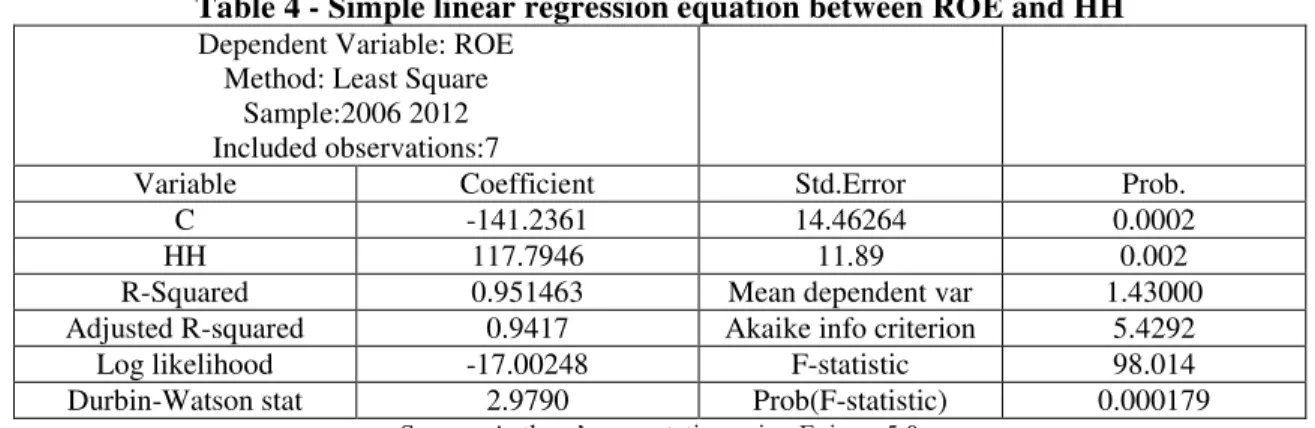
2006-The first step was to verify the relationship between profit, measured by ROE and degree of bank concentration, the latter being measured by: Herfindahl - Hirschman, the concentration of the first three banks in the system and the concentration of the top 5 banks in the system. In the tables no.4, 5 and 6 we show this relationship.
Table 4 - Simple linear regression equation between ROE and HH
Dependent Variable: ROE Method: Least Square
Sample:2006 2012 Included observations:7
Variable Coefficient Std.Error Prob.
C -141.2361 14.46264 0.0002
HH 117.7946 11.89 0.002
R-Squared 0.951463 Mean dependent var 1.43000
Adjusted R-squared 0.9417 Akaike info criterion 5.4292
Log likelihood -17.00248 F-statistic 98.014
Durbin-Watson stat 2.9790 Prob(F-statistic) 0.000179
Source: Authors’ computation using Eviews 5.0
Following the Simple linear regression the following regression equation was obtained:
ROE = 117.7946373 -141.2361336 + * HH, and it is important to note is that the value of the Herfindahl - Hirschman explains 95.14% of ROE in the period analyzed in the banking system.
Table 5 - Simple linear regression equation between ROE and the market share of the top three banks in the system
Dependent Variable: ROE Method: Least Square
Sample:2006 2012 Included observations:7
Variable Coefficient Std.Error Prob.
C -255.7293 24.94012 0.0002
TOP 3 5.491503 0.531987 0.001
R-Squared 0.955180 Mean dependent var 1.43000
Adjusted R-squared 0.946216 Akaike info criterion 5.334159
Log likelihood -16.72365 F-statistic 106.5566
Durbin-Watson stat 2.625059 Prob(F-statistic) 0.000149
Source: Authors’ computation using Eviews 5.0
ROE = -255.7292632 + 5.491503485 * TOP3, and the concentration of the banking system, measured by assets held by the top 3 banks in Slovenia, explaining 95.51% of ROE developments related to the banking system.
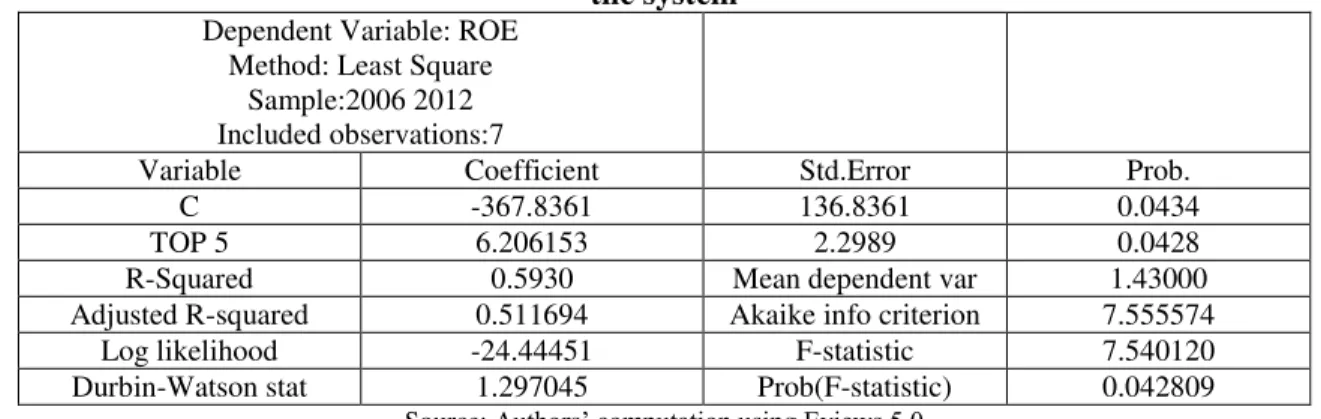
The last equation, the corresponding relationship between ROE and the concentration of banking assets held by the top five credit institutions in the system is shown in figure no. 3, and in this case the concentration of the banking system explained 59% of ROE development.
Table 6 - Simple linear regression equation between ROE and the market share of the top five banks in the system
Dependent Variable: ROE Method: Least Square
Sample:2006 2012 Included observations:7
Variable Coefficient Std.Error Prob.
C -367.8361 136.8361 0.0434
TOP 5 6.206153 2.2989 0.0428
R-Squared 0.5930 Mean dependent var 1.43000
Adjusted R-squared 0.511694 Akaike info criterion 7.555574
Log likelihood -24.44451 F-statistic 7.540120
Durbin-Watson stat 1.297045 Prob(F-statistic) 0.042809
Source: Authors’ computation using Eviews 5.0
The analysis carried out, it can be said that the relationship that best demonstrates the relationship between the concentration and the evolution of ROE is the banking concentration used by the first three banks in the system. I have decided to further investigate the impact of the ROE on the concentration of the banking system, and as can be seen in the following table, we can say that there is one relationship between the two values.
Table 7 - The relationship between the concentration and performance of the Slovenian banking system
HH Top3 Top5
The regression equation
HH = 1.199592315 +
0.008077302475*ROE
TOP3 = 46.57984046 +
0.1739377431*ROE
TOP5 = 59.36334502 +
0.0955629208*ROE
R-squared 0.951463 0.955180 0.593078
As can be seen in this table, the strongest relationship is obtained between ROE and the concentration of assets of the first three banks in the system, as was obtained in the first econometric study.
CONCLUSIONS
The number of institutions has dropped significantly due to numerous acquisitions and mergers that took place both on national and international level. The first banks interested in cross-border operations were those based in developed countries, countries with a high concentration of their banking systems.
Banking institutions are now looking for new opportunities in foreign markets to replace or supplement the decreasing growth opportunities. Removing regulatory barriers in the EU financial services industry will give further impetus to the strengthening of cross-border and cross-sectoral banking M&A.
The result of these operations is the emergence of larger financial companies that offer a wider range of services and operating in multiple markets simultaneously. Acquisitions and mergers in the banking sector have the capacity to ensure efficiency, profitability and synergy, also contributing to increased shareholder value. In some cases, banks with financial problems are the subject of acquisitions or mergers in the banking sector and this type of transaction may result in a monopoly or downsizing.
The main objective of this study was to evaluate the relation between the degree of bank concentration and banking performance in Slovenia, the analyzed period being 2006-2012.
REFERENCES
Altunbas, Y., Marques-lbanez, M. (2008) Mergers and acquisitions and bank performance in Europe. The role of strategic similarities, Journal of Economic and Business, vol. 60, issue 3, pp. 204–222 Ayadi, R., Pujals, G., 2005, Banking mergers and acquisitions in the European Union: Overview,
assessment and prospects, The European Money and Finance Forum Vienna.
European Central Bank (2013) Banking structures report, available at
http://www.ecb.europa.eu/stats/html/index.en.html
Dermine, J. (2003) Banking in Europe: Past, present and future, in: Gaspar, V., Hartmann, P., Sleijpen, O. (Eds.) Proceedings of the 2nd ECB Central Banking Conference on the Transformation of the European Financial System. ECB Frankfurt.
Bank of Slovenia (2013) Financial Stability Report available at
http://www.bsi.si/en/publications.asp?MapaId=784