S-bend erosion in particulated
multiphase flow with air and sand
Quamrul H Mazumder
Abstract
Solid particle erosion is a micro-mechanical process that removes material from a surface by repeated impact of entrained particles in the flow. Erosion is a leading cause of failure in fluid handling equipment such as pumps, pipes, valves, and fittings. The S-bend geometry is used to redirect flows in automotive, chemical processing, oil, gas, and food handling industries. An investigation was conducted using both computational fluid dynamics analysis and experimental methods to identify the location of maximum erosion. Three S-bend geometries with 12.7 mm inside diameter, r/D ratio of 1.5, three different air velocities and six different particle sizes were used in the current study. The experimental test section was of 12.7 mm inside diameter, r/D ratio of 1.5, and used 150 and 300mm particle sizes.
Keywords
Erosion, multiphase flow, S-bend, particulated flow, CFD analysis
Date received: 12 May 2016; accepted: 16 August 2016
Introduction
Solid particle erosion is a complex, micro-mechanical process that gradually removes material from the impact-ing surface by continuously repeated impact of small solid particles entrained in the flow. Erosive wear dam-ages in particulate gas–solid flows have been observed in industries such as oil and gas pipe lines, aircraft, cyclone separators, boilers, fluidized beds, gas turbines and coal gasification processes. Particle impact induces erosion and has been recognized as one of the leading causes of premature and unpredicted failure modes in oil and gas pipelines.1
A number of factors contribute to the severity of erosion. These factors include impact velocity, par-ticle size, parpar-ticle shape, and mechanical properties of both the target material surface and the flow velocity.1 Solid particle impact velocities were found as the most significant factor influencing erosion by a number of investigators and industries. Several investigations revealed that the erosion rate is proportional to the exponent of the solid particle velocity or the fluid velocity surrounding the particles.2 The synergistic influences of the abovementioned factors magnify the complexities in accurate prediction of magnitude and locations of maximum erosion. A recent transformative development of computational fluid dynamics (CFD)
analysis methods provides an effective approach to ana-lyze the effects of these parameters in complex flow conditions. CFD models are based on Navier-Stokes equations which include the first principles of mass, momentum, and energy conservation along with user-defined functions for specific applications.3
The most general model for multiphase flow is the Eulerian-Eulerian model, which is based on the prin-ciple of interpenetrating continua. It also has
continu-ous-dispersed and continuous-continuous systems
capabilities. Each phase is controlled by the Navier-Stokes equations. The current investigation is based on CFD analysis of maximum erosion locations with experimental validation to provide a better understand-ing of maximum erosion locations in an S-bend.
Literature review
Several investigations have previously been attempted in order to address the failure modes and effects caused
Mechanical Engineering, University of Michigan-Flint, Flint, MI, USA
Corresponding author:
Quamrul H Mazumder, University of Michigan-Flint, 303, East Kearsley Street, Flint, MI 48502, USA.
Email: [email protected]
The Journal of Computational Multiphase Flows
2016, Vol. 8(3) 157–166
!The Author(s) 2016 Reprints and permissions:
sagepub.co.uk/journalsPermissions.nav DOI: 10.1177/1757482X16668363 cmf.sagepub.com
anistic model that predicts erosion in elbows with multiphase flow (gas–liquid–solid).5
When the bend was less than 90, the erosion loss was smaller, but the surface roughness increased due to vertical particle impact.6Several investigations used by CFD to predict erosion behavior at different geome-tries, with different solid particles, and in different fluids, showed effective methods for erosion study.1,7 A previous CFD analysis of U-bend geometry showed a location of maximum erosion at 182from the inlet at 15.24 m/s air velocity and sand of 50mm in size.1
The bend’s radius of curvature and the Reynolds number are the lead parameters in determining the strength of swirling flow.8The flow in multiple bends is more complex than in single bends due to the inter-action of flow dynamics within the two bends. The great effect of a bend sweep angle and Reynolds number was studied by Niazmand and Jaghargh9, and their results showed that the Reynolds number is gen-erally based on the diameter of the pipe, but in S-bend or some other multiphase bend, the sweep angles also have a large influence on flow. Small sweep angles were found to suppress the swirling structure in the second bend while large angles could result in strong vortices in the second bend that potentially diminish the intensity of vortices in the first bend. Additionally, an adverse pressure gradient always occurs upstream from the outer wall of the first bend in an S-bend. Whether it occurs at the transition of two bends along the second bend outer wall or not depends on the Reynolds number, sweep angle, and curvature ratio. The effect of the ratio of curvature on erosion in a bend was
shown in many previous research endeavors.10 The
maximum mass transfer enhancement is found to increase as the bend radius to diameter ratio (r/D) is decreased due to the increase in turbulence levels. Experimental investigation of erosion in an S-bend elbow at standard ratio (r/D¼1.5) shows the location and magnitude of maximum erosion at different velo-cities and particle sizes. In addition, analysis of erosion in an S-bend elbow was compared with experimental results showing good agreement.10 Wong et al.11 con-ducted long-term erosion of a flat plate with 80 m/s air velocity with 150–300mm sand at 0.030 kg/s sand rate.
for the above two particle sizes. Fan et al. reported the importance of maintaining erosion test conditions to reduce measurement uncertainties associated with mass loss measurements when measuring erosion rates. Horii et al.15 designed a new bend by expanding the diameter fivefold in a 90 bend to investigate the effects of erosion. The investigation results showed 42 times less erosion in the new bend when compared to a conventional bend for same air velocity and flow conditions. Their results added to the generally accepted understanding of particle velocity being the most signifi-cant factor for erosion.
Present work
Previous investigations in the area of solid particle ero-sion were focused on the effect of particle size on the magnitude of maximum erosion. A limited number of studies reported the location of maximum erosion for S-bend geometry. Therefore, the current work reported in this paper focused on evaluating the location of the maximum erosion in S-bend geometry with different air velocities and particle sizes. The current work included both computational and experimental investigation of erosion. The limited CFD results and experimental results showed reasonably good agreement with the available literature data.
CFD approach and analysis
the discrete phase model (DPM) option. This option adopts a Lagrangian frame of coordinates and leads to the computation of particle trajectories. The force balance equation on the particle is solved using the local continuous phase conditions as described by the following equation
dvp
dt ¼FDðvfvpÞ þg
ðpppfÞ
pp
þFx ð1Þ
where vp and vf are the particle and fluid velocities, respectively,pp andpf are the particle and fluid densi-ties, respectively,gis the gravitational acceleration,Fx
is a term accounting for additional forces, and
FDðvpvfÞis the drag force per unit particle mass
FD¼ 18m
pd2p
CDRe
24 ð2Þ
The solid particle erosion rates at wall boundaries were determined by the following equation17
Rerosion¼
X
Nparticles
p¼1
mpCðdpÞfðÞvbðvÞ Aface
ð3Þ
wheremp is the mass flow rate of a particle,CðdpÞis a function of particle diameter, is the impact angle of
the particle path with the wall face,f() is a function of
impact angle,vis the relative particle velocity,bðvÞis a function of the relative particle velocity, andAfaceis the area of the cell face at the wall.C,f, andbare default values of 1.8 E-9, 1 and 0, respectively.C,f, andb are defined as boundary conditions at the wall rather than properties of the material; hence, the default values were not updated to reflect the material being used. Appropriate values of these functions were also speci-fied for solid particles and the impacting surface mater-ial. The erosion rates were calculated with regard to
loss material/(area-time) or kg/m2/s. Though f and b
describe the function of angle and velocity respectively, the values need to be specified for each pipe wall mater-ial. Sinceb is the function of particle velocity, the type of particle also influences erosion. The default values
for f and b were determined by Edwards17 for the
eroded pipe, while the solid particle was sand.
S-bend geometry
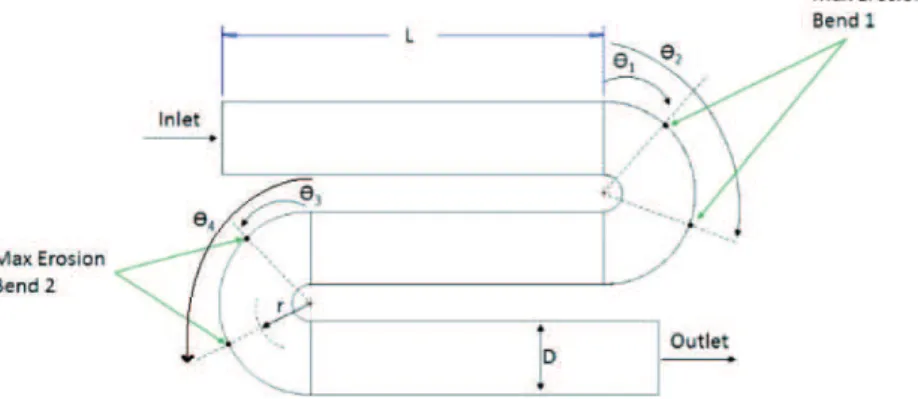
Three S-bends with 12.7 mm pipe diameter, r/D¼1.5 were arranged with 50.8 mm of straight pipe sections upstream and downstream of the bends. The ratio (r/D) of 1.5 is shown in Figure 1. Due to the fact that the core of the turbulent pipe flow was reasonably uni-form, the grid size in this region was relatively coarse. For efficient discretization, the geometry of the fluid’s flow area was divided into three parts: upstream, down-stream, and central parts. The meshed S-bend with ratio of 1.5 is shown in Figure 2. The parameters used in the CFD analysis are listed in Table 1.
CFD analysis
CFD analyses were performed for the conditions listed in Table 1 to determine the magnitude and location of maximum erosion of the S-bend. As Figure 1 showed, the bend near the inlet was defined as bend 1 and the bend near the outlet was defined as bend 2. The loca-tion of maximum erosion is shown as angles measured from the start of the bend at the end of the straight pipe section.
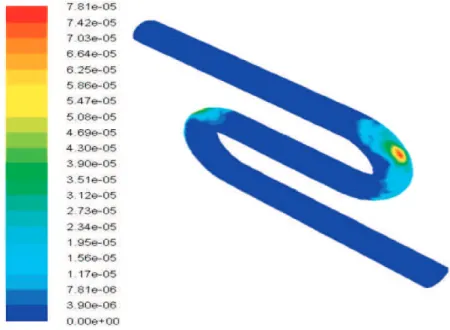
A CFD output plot of the location of maximum erosion with 45.72 m/s air velocity, 300mm particle
size and ratio of 1.5 is presented in Figure 3. Erosion was observed in both bend 1 and bend 2. Furthermore, erosion was observed in two locations in bend 1 and two locations in bend 2. The location of maximum ero-sion for this condition was 34.8and 157in bend 1 and 46.5 and 150.1 in bend 2.
The effect of air velocities and particle sizes on ero-sion is presented in Figure 4(a) and (b). The analysis results showed maximum erosion at 15.24 m/s with 100mm sand size. The lowest erosion at 15.24 m/s
with 50mm particles was observed in the same locations
as in previously tested conditions. There were no sig-nificant differences in erosion patterns with particle sizes between 150 and 300mm at all three air velocities.
The erosion locations identified were those closer to the inlet of the bend. Maximum erosions were observed in two different locations in each bend of the S-bend at all air velocities with r/D¼1.5. The locations were found at 20–73 for different particle sizes and velocities. For 200 -mm particle size, the location of maximum erosion
identified is listed in Table 2. Figure 4(a) shows higher magnitude of erosion at higher fluid velocities with all
Air velocities of 15.24 m/s, 30.48 m/s, and 45.72 m/s were used with 150 and 300mm sands during the
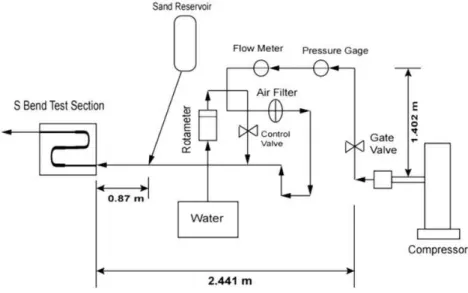
experi-ment. The test loop was designed to enable conducting experiments with air–water–sand mixtures and different r/D ratios in the future. The location of maximum ero-sion was determined by measuring the location of paint removal in the specimen. The schematic and picture of the s-bend multiphase test loop is shown in Figures 5 and 6.
Experimental procedure. A multiphase test loop was designed and constructed using clear plastic pipe with an inside diameter of 12.7 mm for flow visualiza-tion during the experiments. Air was supplied from an 18 SCFM compressor with a pressure gauge, an ST75-2AEBH00 gas flow meter, an FL-73 series water flow meter, an air filter model F74G-4AN-QPB, and a flow regulator model R-130-15. The S-bend test section was designed using two aluminum plates with half-pipe sections in each plate. The two s-bend test section halves were bolted together to resemble a 12.7 mm diameter S-bend pipe section. Before the experiment, the internal surfaces of the S-bend test sections were painted using three layers of epoxy paint with approxi-mately 1.5 mm thickness of each layer. The location of maximum erosion was determined by measuring the location of paint removal in the specimen.
For this experiment, silica sand was sieved in order to be separated into 150 and 300mm sizes using multiple
metal strainers. Sand was injected from a reservoir to the test section through a 1.0 cm nozzle by applying positive pressure above the reservoir. The positive pressure at the top of the sand reservoir was necessary in order to ensure continuous flow of sand at a controlled rate and to avoid backflow of sand to the reservoir. The concentration of sand particles in the flow was approximately 2%. The gas flow rate was monitored and carefully controlled using a valve and flow regulator. The sand rate was monitored using a stopwatch and visual observation of sand levels in the clear plastic sand reservoir. The sand injected into a 12.7 mm pipe was carried by the flowing gas as a gas–sand mixture to the specimen impacting wall of the internal S-bend pipe configuration.
Figure 2. Meshed S-bend geometry with flow directions.
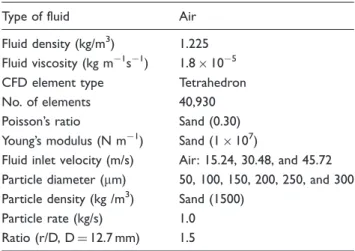
Table 1. Parameters used in CFD analysis.
Type of fluid Air
Fluid density (kg/m3) 1.225 Fluid viscosity (kg m1s1) 1.8105 CFD element type Tetrahedron No. of elements 40,930 Poisson’s ratio Sand (0.30) Young’s modulus (N m1) Sand (1107)
Fluid inlet velocity (m/s) Air: 15.24, 30.48, and 45.72 Particle diameter (mm) 50, 100, 150, 200, 250, and 300 Particle density (kg /m3) Sand (1500)
Particle rate (kg/s) 1.0 Ratio (r/D, D¼12.7 mm) 1.5
After flowing through the S-bend test section, the gas–sand mixture was discharged to the atmosphere and collected in a container for disposal. The sand was not reused in the experiment because particle
sizes may change after impact. The distance between the sand injection point and the S-bend test section was 67 mm and is equivalent to 5.5 times the pipe diameter.
Experimental results. Each experiment was repeated three to four times to reduce measurement uncertainties and ensure repeatability of the test. After each experiment, the S-bend specimen was removed from the test section, disassembled for observation and the location or loca-tions of paint removal were measured.
Figure 7(a) to (c) shows the location of maximum erosion at different air velocities with 300mm sand sizes.
Figure 7(a) shows the location of maximum erosion at 20–34 from inlet in bend 1 with an air velocity of
Figure 3. Contours of DPM erosion (kg/m2/s) at 45.72 m/s air velocity, 300mparticle r/D¼1.5.
Figure 4. (a and b). Effect of particle size and velocity on magnitude and location of erosion in S-bend geometry.
Table 2. Location of maximum erosion for 200 -mm particle.
Air velocity (m/s)
Location of maximum erosion ()
Bend 1 Bend 2
15.24 m/s. With an air velocity of 30.48 m/s, two
differ-ent erosion locations were detected at 15–49 and
110–136 in bend 1. With an air velocity of 45.72 m/s, two different locations of erosion were observed at 19– 69and 106–159in bend 1 and one additional location
of erosion was observed at 18.5–55 in bend 2.
Figure 7(d) to (f) shows the location of maximum ero-sion at different air velocities with a 150mm sand size.
Figure 7(d) presents the location of maximum erosion to be 14–40in both bends 1 and 2. With a 30.48 m/s air velocity, the maximum erosion locations were observed at 21–64in bend 1 and 21–41in bend 2. At 45.72 m/s, the maximum erosion locations were observed at 21–61 in bend 1 and 12–41 in bend 2, respectively.
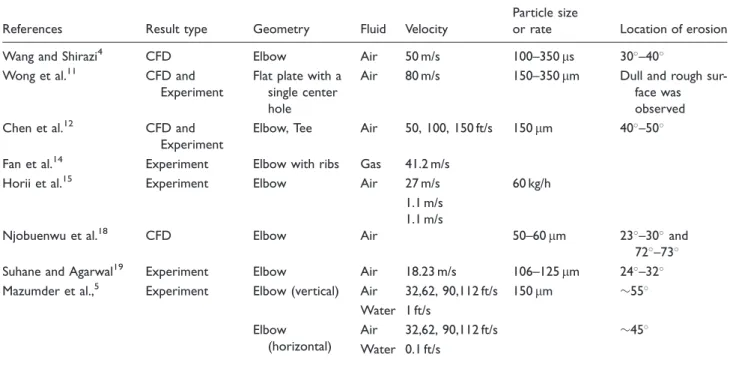
Comparison with literature data
The CFD analysis and experimental results from the current research were compared with previous investi-gations reported in the literature review and presented in Tables 3 and 4. The available data from the literature
review are presented in Table 3, and the current inves-tigation results comparing CFD, and experimental results are presented in Table 4. Due to limited avail-ability of data for erosion in S-bend, erosion results for elbow, U-bend, and tees were also used in the com-parison. Chen et al.12 reported maximum erosion at 40–50from the inlet with three different air velocities (50, 100, 150 ft/s) with 150mm sand particles for elbow
and tee geometries. The current investigation results
showed the location of maximum erosion at 20–50
for similar velocities and particle size. Suhane and Agarwal19 reported the location of maximum erosion to be 24–32for 106–125
mm particle size. Mazumder20
investigated locations of maximum erosion in horizon-tal and vertical elbows for 32–112 ft/s air velocities and with a 0.1 ft/s water velocity. The experimental results showed maximum erosion locations at approximately 55 for vertical elbow and 45 for horizontal elbow.
The results of CFD and experimental investigations are presented in Table 4 and show reasonably good agreement. The agreements are due to considerations of several factors in the numerical model such as inter-actions between the discrete particle phase and the fluid phase, particle impact velocity that causes erosion, mesh sensitivity analyses, etc. Uncertainty analysis of instruments, data acquisition and repeatability of the experiments were conducted to assure higher level of reliability of the experimental results. For example, at 15.24 m/s air velocity and 300mm sand size, CFD
analysis showed maximum erosion at 32 as compared to the 20–34 observed in the experimental results. Similarly, at 30.48 m/s air velocity, the CFD result was 39.1 and the experimental result was 30–40. Comparison of all other conditions can be found in Table 3.
Figure 5. Schematic of S-bend multiphase test loop.
Summary and conclusion
An investigation was conducted to determine the loca-tion of maximum erosion in S-bend geometry. CFD analyses were performed for three different S-bend geo-metries with r/D ratios of 1.5. A CFD simulation was performed using a comprehensive procedure that included flow simulation, particle tracking and erosion calculation. To validate the CFD results, an experimen-tal investigation was performed by designing and
developing a test section with a 12.7 mm diameter pipe and an S-bend test section with r/D ratio of 1.5. CFD analysis and experimental investigations were conducted at 15.24 m/s, 30.48 m/s and 45.72 m/s air velocities with 150 and 300mm sand particles.
The CFD results were compared with the experimen-tal results, showing good agreement. The results were also compared to available literature, showing a wide range of results. The dispersion of literature results can
Table 4. Comparison of current CFD and experimental results.
Result
type Geometry Fluid Velocity
Particle
size Location of erosion
Mazumder (Current Work) CFD S-bend Air 15.24 m/s 300mm 32and 153.3in Bend 1;
58.9and 152.9in Bend 2
30.48 m/s 31.5and 150.8in Bend 1;
70and 138in Bend 2
45.72 m/s 41and 147.2in Bend 1;
40and 74in Bend 2
15.24 m/s 150mm 20.9and 147.5in Bend 1;
46and 137.2in Bend 2
30.48 m/s 39.1and 150.8in Bend 1;
30and 169.8in Bend 2
45.72 m/s 46and 142.3in Bend 1;
46.3and 164in Bend 2
Experiment 15.24 m/s 300mm 20–34in Bend 1
No in bend 2 30.48 m/s 35–49in Bend 1
No in bend 2 45.72 m/s 29–42in Bend 1
20–60in Bend 2
15.24 m/s 150mm 30–40in Bend 1
20–50in Bend 2
30.48 m/s 45.72 m/s
31–48in Bend 1
22.5–40in Bend 2
CFD: computational fluid dynamics.
Horii et al. Experiment Elbow Air 27 m/s 60 kg/h 1.1 m/s
1.1 m/s
Njobuenwu et al.18 CFD Elbow Air 50–60mm 23–30and
72–73
Suhane and Agarwal19 Experiment Elbow Air 18.23 m/s 106–125
mm 24–32
Mazumder et al.,5 Experiment Elbow (vertical) Air 32,62, 90,112 ft/s 150mm 55
Water 1 ft/s Elbow
(horizontal)
Air 32,62, 90,112 ft/s 45
Water 0.1 ft/s
be explained by different geometries, different experi-mental conditions and several other factors that were not defined in previously published research results.
In spite of the limitations associated with the current study, the present work will be able to shed light on variations of maximum erosion locations in S-bend and other similar geometries. This will enable research and design engineers to recognize that the location of max-imum erosion is equally important as the magnitude of erosion in designing fluid handling equipment with a particulated multiphase flow.
Acknowledgements
The authors would like to acknowledge the work performed by mechanical engineering students, Kawshik Ahmed and Siwen Zhao.
Declaration of conflicting interests
The author(s) declared no potential conflicts of interest with respect to the research, authorship, and/or publication of this article.
Funding
The author(s) disclosed receipt of the following financial sup-port for the research, authorship, and/or publication of this article: The work presented in this paper was supported by an RCAC grant, U042784 from the office of research, University of Michigan-Flint, USA.
References
1. Mazumder QH. Effect of liquid and gas velocities on mag-nitude and location of maximum erosion in U-bend.Open J Fluid Dyn2012; 2: 29–34.
2. Ionescu D. Reduction of pipe wall erosion by creating a vortex flow in anthracite powder pneumatic transport for power plants.Renewable Energy Power Quality J 2012; 1. 3. Sharifi A and Mohebbi A. A combined CFD modeling with population balance equation to predict pressure drop in venturi scrubbers. Res Chem Intermed 2014; 40: 1021–1042.
4. Wang J and Shirazi SA. A CFD based correlation for ero-sion factor for long-radius elbows and bends. J Energy Resour Technol2003; 125: 26–34.
5. Mazumder QH, Siamack AS and Brenton SM. Prediction of solid particle erosive wear of elbows in multiphase annular flow-model development and experimental valid-ations.J Energy Resour Technol2008; 130: 023001. 6. Finnie I. Erosion of surfaces by solid particles.Wear1960;
3: 87–103.
7. Rudolf P and Desova´ M. Flow characteristics of curved ducts.Appl Comput Mech2007; 1: 255–264.
8. Weske JR. Experimental investigation of velocity distribu-tion downstream of a single duct bend. N.A.C.A, TN-1471, 1948.
9. Niazmand H and Jaghargh ER. Bend sweep angle and Reynolds number effects on hemodynamics of S-shaped arteries.Annu Biomed Eng2010; 38: 2817–2828. 10. Sudo K, Sumida M and Hibara H. Experimental
investi-gation on turbulent flow through a circular 180 degree bend.Exp Fluids2000; 28: 51–57.
11. Wong CY, Solnordal C, Swallow A, et al. Predicting the material loss around a hole due to sand erosion. Wear 2012; 276: 1–15.
12. Chen X, Brenton SM and Siamack AS. Application and experimental validation of a computational fluid dynam-ics (CFD)-based erosion prediction model in elbows and plugged tees.Comput Fluids2004; 33: 1251–1272. 13. Mills D and Mason JS. Particle size effects in bend
ero-sion.Wear1977; 44: 311–328.
14. Fan J, Yao J, Zhang X, et al. Experimental and numer-ical investigation of a new method for protecting bends from erosion in gas-particle flows. Wear 2001; 251: 853–860.
15. Horii K, Matsumae Y, Cheng XM, et al. An erosion resistant pipe bend.J Fluids Eng1991; 113: 149–151. 16. FLUENT User Guide. ANSYS. 14.5, 2012. Canonsburg,
PA: Ansys, Inc.
17. Edwards JK.Development, validation, and application of a three dimension, CFD-based erosion prediction procedure. PhD Thesis, the University of Tulsa, Tulsa, 2000. 18. Njobuenwu DO and Fairweather M. Modelling of pipe
bend erosion by dilute particle suspensions. Comput Chem Eng2012; 42: 235–247.
19. Suhane A and Agarwal VK. Effect of bend geometry on erosion and product degradation in pneumatic con-veying pipeline systems. Int J Eng Res Appl 2012; 2: 129–136.
20. Mazumder QH.Development and validation of a mechan-istic model to predict erosion in single-phase and multi-phase flows. PhD Dissertation, The University of Tulsa, Tulsa, Oklahoma, USA, 2004.
21. Chen Q and Li DY. Computer simulation of solid par-ticle erosion.Wear2003; 2: 203–210.
Appendix
Notation
Aface the area of the cell face at the wall
CD drag coefficient
dp particle diameter
D inside diameter of elbow
FD drag force
Fx additional acceleration
gx Acceleration of gravity
k Turbulent kinetic energy
mp particle mass
r turning radius of the elbow
Re Reynolds number