Farming expansion and land degradation in Western Bahia, Brazil
Mateus Batistella1,3 & Gustavo Souza Valladares2
1Empresa Brasileira de Pesquisa Agropecuária – EMBRAPA Monitoramento por Satélite, Av. Soldado Passarinho, 303, Fazenda Chapadão, CEP 13070-115, Campinas, SP, Brazil
2Departamento de Ciências do Solo – DCS, Centro de Ciências Agrárias, Universidade Federal do Ceará – UFC, Av. Mister Hull, 2977, Bloco 807, Campus do Pici,
CEP 60021-970, Fortaleza, CE, Brazil, e-mail: valladares@ufc.br 3Corresponding author: Mateus Batistella, e-mail: mb@cnpm.embrapa.br
BATISTELLA, M. & VALLADARES, G.S. Farming expansion and land degradation in Western Bahia, Brazil. Biota Neotrop. 9(3): http://www.biotaneotropica.org.br/v9n3/en/abstract?article+bn00909032009.
Abstract: Land degradation by soil erosion has called attention in tropical developing countries, particularly when natural vegetation is converted to farmland. Thus, the occupation of Brazilian savannas in Western Bahia is a matter of growing environmental concern. There are approximately 10 million hectares affected by this relatively recent land-use dynamics, but little is known about the temporal and spatial distribution of the process. To better understand such transformations, this paper addresses three related topics: land use/land cover (LULC) in 1985 and 2000; LULC dynamics between 1985 and 2000; and risk of land degradation by soil erosion as a function of farming expansion. The study area is located in Northeastern Brazil, between the coordinates 11° S and 46° 30’ W and 14° S and 43° 30’ W. All classes of natural vegetation cover decreased their areas during the period of study. Savanna (cerrado) lost 21.0% of its original area. Modern farming and irrigated areas increased 154.4 and 526.0%, respectively. Farming expansion reached 1,675,233 ha. Moderate risk of land degradation by soil erosion increased from 28.0 to 36.8% of the landscape mosaic between 1985 and 2000. The spatial and temporal dynamics observed reproduces development and land degradation examples of other savanna lands in Brazil. The integrity of native vegetation cover and the dissemination of soil and water conservation practices should be considered. This research contributes with an understanding of landscape transformations as a baseline for strategic environmental and land-use planning within the region.
Keywords: landscape change, land-use/land-cover, soil erosion, Brazilian savannas, Bahia.
BATISTELLA, M. & VALLADARES, G.S. Expansão agrícola e degradação da terra no Oeste da Bahia, Brasil. Biota Neotrop. 9(3): http://www.biotaneotropica.org.br/v9n3/pt/abstract?article+bn00909032009.
Resumo: A degradação da terra por erosão do solo tem chamado atenção em países em desenvolvimento, particularmente quando a vegetação nativa é convertida em área agrícola. Portanto, a ocupação do cerrado no Oeste da Bahia é um tema de crescente preocupação ambiental. Existem aproximadamente 10 milhões de hectares afetados por esta recente dinâmica de uso da terra, mas pouco se sabe sobre a distribuição temporal e espacial do processo. Para melhor entender estas transformações, este trabalho aborda três tópicos relacionados: uso e cobertura da terra em 1985 e 2000; dinâmica do uso e cobertura entre 1985 e 2000; e risco de degradação da terra por erosão de solo como função da expansão de áreas agrícolas. A área de estudo localiza-se no Nordeste brasileiro, entre as coordenadas 11° S e 46° 30’ O e 14° S e 43° 30’ O. Todas as classes de vegetação nativa diminuíram suas áreas durante o período de estudo. O cerrado perdeu 21,0% de sua área original. A agricultura moderna e as áreas irrigadas aumentaram 154,4 e 526,0%, respectivamente. A expansão de áreas agrícolas alcançou 1.675.233 ha. O risco moderado de degradação da terra por erosão de solo aumentou de 28,0 para 36,8% do mosaico de paisagem entre 1985 e 2000. A dinâmica espacial e temporal observada reproduz exemplos de desenvolvimento e degradação da terra de outras áreas de cerrado no Brasil. A integridade da cobertura vegetal nativa e a disseminação de práticas de conservação de solo e água deveriam ser consideradas. Esta pesquisa contribui para um entendimento das transformações da paisagem como uma base para o planejamento ambiental estratégico e do uso das terras na região.
62
Batistella M. & Valladares G.S.
http://www.biotaneotropica.org.br http://www.biotaneotropica.org.br/v9n3/en/abstract?article+bn00909032009 Biota Neotrop., vol. 9, no. 3
Material and Methods
1. Study area
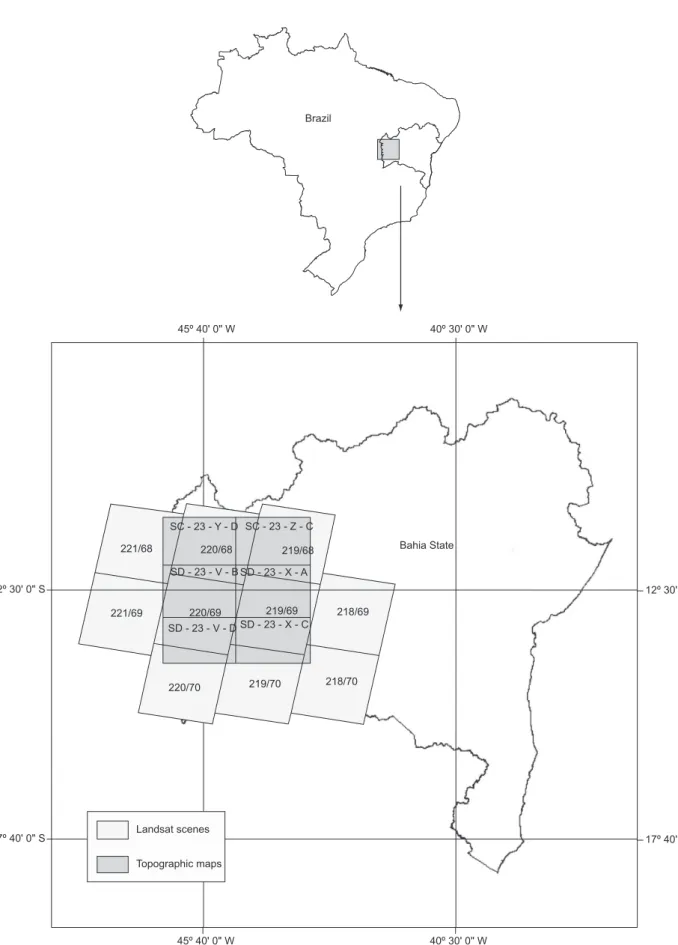
The study area is located in the Western portion of Bahia State, Northeastern Brazil, between the coordinates 11° S and 46° 30’ W and 14° S and 43° 30’ W, including three watersheds (Grande, Cor-rente, and Carinhanha), all tributaries of the São Francisco River (Batistella et al. 2003).
This region has two well-defined seasons: the dry season with mild temperatures between May and September, and the hot and rainy season between October and April. Its geographic location assures high temperatures during most of the year, due to the powerful solar radiation. The average maximum and minimum precipitations vary in the eastern-western directions from 800 mm to 1,600 mm/year. The annual average for relative humidity is about 70%, ranging be-tween 50% in August and 80% in December (Prefeitura Municipal de Barreiras 2000).
The geological features within the study area includes Forma-tions of the: Holocene, composed by recent sediments; Quaternary (i.e., Vazantes Formation), with sediments from various origins, sometimes concretionary; Superior Cretaceous (i.e., Urucuia or Itapecuru Formation), which encompasses the largest part of Western Bahia and is constituted by sandstone; and Superior Cambrian (i.e., Bambuí Group), where limestones or clastic materials can be found (Jacomine et al. 1976).
Based on structural characteristics and topographic variation, Jacomine et al. (1976) distinguished the following geomorphological units in Western Bahia: Alluvial Plains, between 350 and 400 m high, with undulating terrain; Western Plateau, occupying approximately half of the entire study area, with altitudes up to 900 m; Oriental Plain, a large flat surface, inserted between the principal front of the Western Plateau and the São Francisco River, with altimetric variation ranging between 400 and 600 m; Northern Plains and Pediplanes, a narrow area including an irregular intermountain plain with pediplaned sec-tions, located between the mountains delimiting the Oriental Plain and the boundaries of the study area; and Mountains and Inselbergs, represented by solid elevated residuals.
Oxisols predominate in the Western Plateau. In the river valleys and wetlands with palm trees, Aquox and Histosols are more frequent. These soils have low natural fertility, with the flat topography be-ing the main advantage for agricultural use. In the plains, soil types include Oxisols, Ultisols, Psamments, and, less frequently, Alfisols. The considerable soil variation in the region is closely related to the variation in the original geologic substract. In mountains and insel-bergs, shallow Entisols predominate (Valladares 2002).
Vegetation formations within the Western Region of Bahia follow latitudinal, longitudinal, and altimetric gradients and are associated with physical factors such as climate, soils, and topography. In the Western Plateau, the savanna (cerrado) is the dominant physiognomy, usually correlated to flat surfaces, Oxisols, and Psamments. The more representative patches of seasonal forest cover the central portion of the study area, where calcareous rocks dominate. Most of the São Francisco River valley and the northeastern portion of the study area belong to an ecological transition between the savanna (cerrado) and the dry forest (caatinga). Riparian vegetation is associated with natu-ral landscape corridors, such as the main rivers and smaller streams (Batistella et al. 2003).
2. Data gathering
Bibliographic, cartographic, and satellite imagery searches, to-gether with data acquisition during fieldwork was the first step to build a database for Western Bahia. Figure 1 illustrates the topographic
Introduction
Land degradation by soil erosion has called attention in tropical developing countries, particularly when natural vegetation is con-verted to farmland. Vegetation cover protects the soil from the impacts of rain drops, smoothing erosive processes (Favis-Mortlock & Guerra 1999). Rain drops can also produce crusts on soil surfaces, which re-duce the infiltration potential (Roth 1997). Infiltration is the movement of water through the soil by capillarity and gravity forces (Bertoni & Lombardi Neto 1985). Thus, soil structural and textural characteristics also define the potential of water infiltration and erosion. Depending on management practices, land use may cause compactation and decrease soil moisture (Neufeldt et al. 1999). Besides rainfall and vegetation cover, topography plays an important role in defining erosion potentials. The size and amount of particulated materials in water runoffs are closely related to slope variations (Wischmeier & Smith 1978, Renard et al. 1997, Lu et al. 2004).
The occupation of Brazilian savannas is a matter of growing en-vironmental concern, due to land-use intensification during the past decades (Brannstrom 2001, Neufeldt et al. 2002). The expansion of soy bean fields, for instance, can cause the erosion of approximately 8 mg.ha–1 per year if conservative practices are not adopted (Mattsson
et al. 2000). Erosion control in agricultural systems is necessary to avoid land degradation and nutrient loss (Giller et al. 1997). It is estimated that an average of 20 to 70 kg.ha–1 of Nitrogen and
Potas-sium are exported from agricultural lands in Latin America annually (Boddey et al. 1997). When comparing natural savanna areas with pasturelands in Brazil, Balbino et al. (2002) showed that, at various soil depths, the pore volume was smaller in pastures than in areas with natural vegetation cover, characteristic that may increase land degradation.
The Western Region of Bahia State, located in the transition be-tween savanna (cerrado) and dry forest (caatinga) biomes in Brazil, was traditionally used for extensive cattle ranching and traditional farming, but observed an important development of the agricultural activity beginning in the early 1980’s (Nepstad et al. 1997). Farmers have invested in the production of grains (mainly soy bean and corn), and irrigated perennial crops, including coffee (AIBA 2001). Most of these farmers are originally from Southern Brazil (e.g., Rio Grande do Sul, Santa Catarina, and Paraná States), but also from other states and even from foreign countries (e.g., Portugal and United States).
This fast and intense change in land use has caused environmental impacts, such as habitat loss, alteration of animal populations, bio-diversity reduction, outflow reduction of rivers draining the region, hydric, eolian, and genetic erosion (Baccaro 1999). There are ap-proximately 100,000 km2 affected by this relatively recent land-use
dynamics, but little is known about the temporal and spatial distribu-tion of the process. The impacts vary among the distinct watersheds within the region, as a function of land conversion and geomorphic characteristics. Moreover, with the current pace of development, investments in the region tend to grow, stimulated by the recent suc-cess of the Brazilian agribusiness.
Bahia State Brazil
Landsat scenes
Topographic maps
45º 40' 0" W 45º 40' 0" W
40º 30' 0" W 40º 30' 0" W
12º 30' 0"
17º 40' 0" 17º 40' 0" S
12º 30' 0" S
218/70 218/69 219/69
219/68 220/68
220/69
219/70 220/70
221/69 221/68
SD - 23 - X - C SD - 23 - X - A SD - 23 - V - B
SD - 23 - V - D
SC - 23 - Y - D SC - 23 - Z - C
Figure 1. Topographic maps and Landsat scenes covering the study area in Western Bahia, Brazil.
64
Batistella M. & Valladares G.S.
http://www.biotaneotropica.org.br http://www.biotaneotropica.org.br/v9n3/en/abstract?article+bn00909032009 Biota Neotrop., vol. 9, no. 3
Seasonal Forest can be classified as semi-deciduous or deciduous vegetation in function of biophisical factors, such as latitude, climate, topography, soil, and floristic composition. In Western Bahia, it oc-curs in patches of various sizes, located in higher elevations, over calcareous and pelitic substrate.
Riparian Vegetation is spatially associated with rivers, streams, and wetlands. It includes gallery forests, grassy and herbaceous-shruby formations. The gallery forest defines landscape corridors along the water courses. This broadleaf evergreen vegetation is often encircled by narrow herbaceous-shruby formations as a buffer zone for the abrupt transition to savannas and agricultural lands. Riparian vegetation is characterized by the dominance of Mauritia flexuosa, a very typical palm tree (buriti). It is found in saturated soils, generally covering flat areas, bordering drainage lines.
Savanna (Cerrado) areas contain scattered trees and bushes over a grassy ground cover, without a continuous canopy. It is characterized by the presence of low trees, with irregular and twisted ramifications, generally showing evidences of burning events. Some shrub species present perennial deep roots that allow sprouting after burning or cutting. Generally, the tree stems have coarse barks, and the apical meristems are often piliferous. Leaves are generally rigid and coria-ceous. The savanna physiognomy predominates in Western Bahia, be-ing often related to Cretaceous and to patches of Tertiary-Quaternary structures, where Oxisols and Entisols predominate.
Open Savanna (Campo Cerrado) of natural or anthropic origin is dominated by herbaceous species, some shrub species, and has no trees. When undisturbed, it is delimited by riparian vegetation. It can also occur in saturated soils, with the presence of surface rocks. In this case, the species composition is different, including plants adapted to this environmental condition. Open savannas are found mainly in the western portion of the study area, by the border with Tocantins State.
Dry Forest/Seasonal Forest/Savanna Transition, locally known as Carrasco, Grameal or Catanduva, is characterized by the abun-dance of woody climbing species, high density of woody shrubs and trees, lack of stratification, and the absence of Cactaceae and Bromeliaceae. This vegetation represents a transition between the Brazilian biomes of savannas and dry forests, covering the largest portion of the São Francisco river basin, over Oxisols and Entisols of Tertiary and Quaternary areas.
Dry forest/Seasonal Forest/Savanna/Humid Fields Transition is similar to the vegetation type described above, but with the presence of flooded depressions during the rainy season. It is located mainly in the northeastern portion of the study area.
Traditional Farming is generally undertaken by small farmers with the use of traditional practices. The knowledge of techniques is transmitted through generations and no specific technical orientation is used for land management. The productive system is based on fa-miliar structure. The spatial pattern of traditional farming in Western Bahia is characterized by clusters of small agricultural patches.
Modern Farming is practiced by farmers who use state-of-the-art production techniques (e.g., large scale mechanization and fertiliza-tion). The activity is supervised by technical assistance, from the farm to the market. Productivity is generally high and social rela-tions are always based on employment of permanent and temporary workers.
Irrigated Areas encompass areas with infrastructure and proce-dures for the application of water in agricultural production. Center pivots are often used in Western Bahia, but other sprinkler irrigation systems were also found.
Forestry is the plantation of woody species such as Pinus sp. and Eucaliptus sp. It occurs in very specific locations within the study area.
maps in 1:250,000 scale (IBGE 1984a-f) and Landsat TM and ETM+
scenes covering the study area.
After preliminary tests, dry season satellite imagery was selected to maximize spectral differentiation between LULC classes. Landsat TM and ETM+ scenes were acquired for 1985 and 2000 (Table 1).
Using image processing systems, these scenes were georeferenced. The elaboration of mosaics encompassed the area covered by the six topographic maps.
3. Mapping land-use and land-cover dynamics
LULC maps were produced for 1985 and 2000 through the use of LANDSAT TM 5 and ETM+ 7 images with spatial resolution
resampled to 30 m. Visual interpretation of the boundaries between LULC classes was performed ‘on the fly’ at scales ranging from 1:150,000 to 1:180,000. The cartographic output was represented in 1:250,000 based on the available topographic maps for the region. The minimum map unit was of approximately 13 ha (i.e., polygons of 0.04 cm2). As the geometric correction was performed for a maximum
error of 30 m (i.e., 1 pixel), the vectors generated for year 2000 were overlayed to the 1985 mosaic for the edition of LULC polygons in 1985 (Figure 2).
LULC maps for Western Bahia used a legend based and adapted from Brasil (1982), Veloso et al. (1991), Eiten (1994), Ribeiro & Walter (1998), Walter & Sampaio (1998), Araújo & Martins (1999), and Araújo et al. (1999). A summarized description of each LULC class is listed below.
Table 1. Landsat scenes used and date of acquisition in 1985 and 2000.
Tabela 1. Cenas Landsat utilizadas e datas de aquisição em 1985 e 2000.
Scenes Dates of Acquisition
1985 (LANDSAT TM) 2000 (LANDSAT ETM+)
221/68 02.09.85 22.11.00
221/69 10.08.85 05.08.01
220/68 10.08.85 27.08.00
220/69 10.08.85 27.08.00
220/70 26.08.85 14.10.00
219/68 16.06.85 01.07.99
219/69 20.09.85 20.08.00
219/70 03.08.85 17.06.00
218/69 20.08.85 22.03.00
218/70 03.08.85 28.03.99
1985 2000
Figure 2. Land-use/land-cover vectors overlaid to subsets of Landsat mosaics
from 1985 and 2000.
Figura 2. Limites interpretados para o uso e cobertura da terra, sobrepostos
produced. The accuracy measures UA, PA and OA are presented. A total of 588 and 869 sample plots were randomly allocated over the 2000 and 1985 LULC classifications, respectively. For the accuracy assessment, these plots were examined through visual interpretation supported by field data and high spatial resolution data (i.e., IKONOS, QUICKBIRD, and aerial photos).
5. Mapping land degradation risks by soil erosion
Land cover protects the soil against erosion. Even in steep areas, this effect is more efficient where vegetation presents greater den-sity and provides more ground cover (Lu et al. 2004). For example, agricultural lands submitted to mechanization suffer greater impact of erosive processes than lands covered by forest plantations. In Western Bahia, peri-urban areas may also play an important role on these processes, as dirty roads and steep slopes created by civil construction speed up material transportation and, as a consequence, increase erosion.
To map land degradation risk by soil erosion, we used a soil map in the scale 1:1,000,000 that includes legends for geology, geomor-phology, and slope, and the LULC map for 2000 (Valladares et al. 2002). An additive multi-criteria method, defined by Xavier-da-Silva (2000) as weighted mean, was applied (Equation 1). The integration of GIS and multi-criteria methods can be found in several works (Jankowski 1995, Malczewski 1999, Gomes & Estellita Lins 2002). After the conversion of vector data to raster matrices, we applied the following algorithm:
=
=
∑
n
k 1
Aij
(Pk.Nk)
(1)Urban Areas include towns and villages occupied mainly by industrial, commercial, and residential complexes.
Water bodies include the main rivers, streams, lakes, and artificial reservoirs.
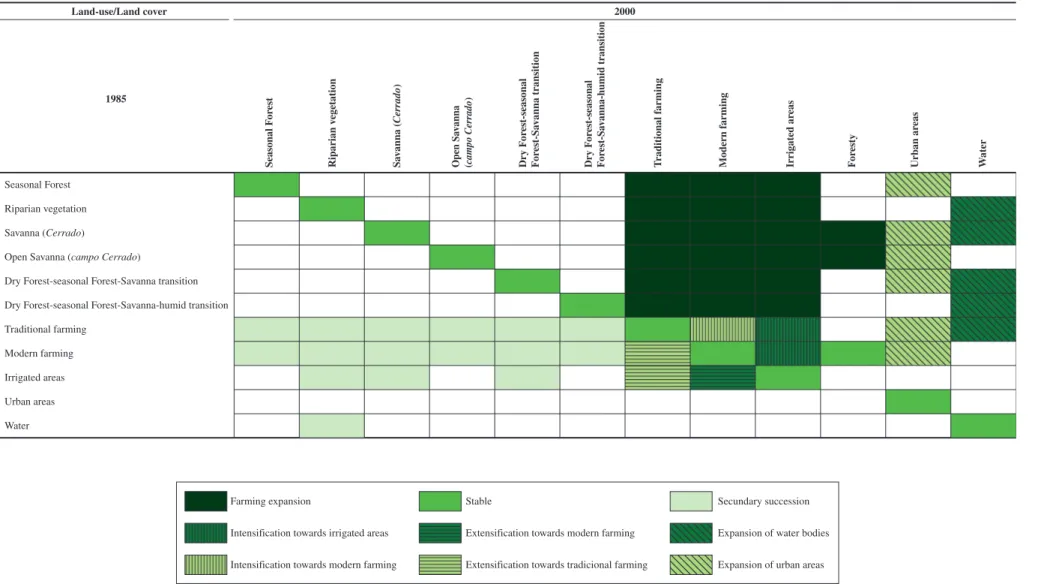
After the production of preliminary maps based on patterns il-lustrated in Figure 3, fieldwork was carried out for ground truthing. The cartographic limits and the classification system were checked through aerial and terrestrial surveys. The final products included eleven LULC classes. Using Boolean algebra, the LULC maps for 1985 and 2000 were overlaid in a Geographic Information System following the criteria expressed in Table 2. The legend in this table expresses the classes of land-use and land-cover dynamics in the region as a result of the application of the operator ‘and’ between the LULC classes in 1985 and 2000. Table 2 must be read always from the LULC class in 1985 to the class in 2000. For instance, an area covered by savanna in 1985 that was converted to modern farming in 2000 was reclassified as farming expansion.
4. Accuracy assessment
Accuracy assessment is an important part of image classification processes. A common method for accuracy assessment is through the use of an error matrix. Previous literature has provided the interpre-tations and calculation methods to determine the overall accuracy (OA), producer’s accuracy (PA), user’s accuracy (UA) and Kappa coefficient. The Kappa coefficient is a measure of overall statistical agreement of a matrix, which takes the non-diagonal elements into account. Kappa analysis was recognized as a powerful technique used for analyzing a single error matrix and comparing the difference between different error matrices (Congalton 1991, Smits et al. 1999). Error matrices for the LULC classifications in 2000 and 1985 were
Seasonal forest Riparian vegetation Savanna (cerrado) Open savanna (campo cerrado)
Dry forest seasonal forest -savanna transition
Dry forest seasonal forest -savanna - humid fields transition
Tradicional farming
Irrigated areas Forestry Urban areas Water
Modern farming
Figure 3. Land-use/land-cover classes mapped in Western Bahia, Brazil.
66
Batistella M. &
V
alladares G.S.
http://www
.biotaneotropica.or
g.br
http://www
.biotaneotropica.or
g.br/v9n3/en/abstract?article+bn00909032009
Biota Neotr
op.,
vol. 9, no. 3
Land-use/Land cover
1985
Seasonal Forest
Seasonal F
or
est
2000
Riparian vegetation
Riparian v
egetation
Savanna (Cerrado)
Sa
v
anna (
Cerrado
)
Open Savanna (campo Cerrado)
Open Sa
v
anna
(
campo Cerrado
)
Dry Forest-seasonal Forest-Savanna transition
Dry F
or
est-seasonal
F
or
est-Sa
v
anna transition
Dry Forest-seasonal Forest-Savanna-humid transition
Dry F
or
est-seasonal
F
or
est-Sa
v
anna-humid transition
Traditional farming
T
raditional farming
Modern farming
Moder
n farming
Irrigated areas
Irrigated ar
eas
Urban areas
Urban ar
eas
Water
W
ater
Farming expansion
Intensification towards irrigated areas
Intensification towards modern farming
Stable
Extensification towards modern farming
Extensification towards tradicional farming
Secundary succession
Expansion of water bodies
Expansion of urban areas
F
or
esty
Table 2. Classification scheme used to map land-use and land-cover dynamics in Western Bahia, Brazil.
was represented as intensification towards modern farming. On the other hand, agricultural extensification processes as well as expansion of water bodies and urban areas are also mapped. The class named “secondary succession” includes areas dominated by farming activi-ties in 1985, with evidences of land abandonment favoring vegetation regrowth (Figure 6).
Approximately 81% of the total area did not present LULC alterations during the period analyzed. Farming expansion reached 1,675,233 ha or 15.49% of the study area. Intensification towards modern farming or irrigated areas occurred only in 0.29% of the total area. Different stages of secondary succession cover 322,281 ha or 2.98% of the 10,813,413 ha mapped. Areas with alterations in Western Bahia landscapes were of approximately 2 million hectares or 19% of the total area. Simple calculations show that farming expansion represents about 81% of the area where LULC change occurred (Table 7).
3. Risks of land degradation by soil erosion in 1985 and 2000
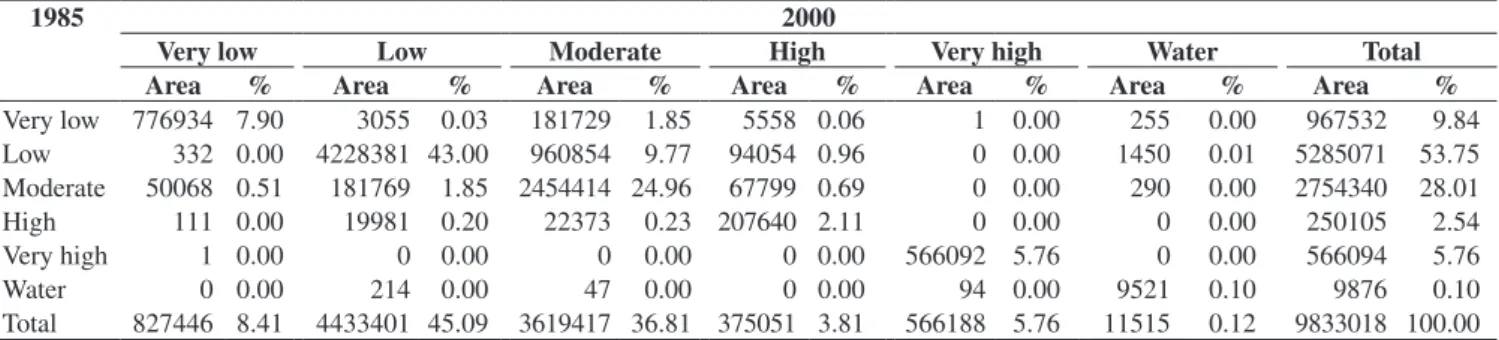
Table 8 shows how the risk of land degradation by soil erosion increased in Western Bahia, as a result of farming expansion and intensification. A very low risk of land degradation by soil erosion occurs mainly in the eastern and northeastern portions of the study area, in flat sites associated with riparian vegetation and forests. The large amount of biomass of these vegetation classes leads to the re-duction of erosive processes. These areas also present low density of the drainage network and high soil permeability. The areas with very low risk of land degradation by soil erosion decreased from 9.84 to 8.41% of the total study area in the period of study.A low risk of land degradation by soil erosion predominates in Western Bahia (53.75% in 1985 and 45.09% in 2000). It is associated with native vegetation cover and flat or slightly undulating terrain. Savannas, forests, and transitions between these vegetation classes are the dominant land covers in areas with low density of drainage network and high soil permeability. Farming expansion and inten-sification over these areas will certainly increase erosive processes, making them move towards a higher risk of land degradation, as it happened in approximately 9% of the total area during the period of study.
A moderate risk of land degradation by soil erosion increased from 28.01 to 36.81% t of the study area. In the plateau, it occurs over sandstones and Oxisols with loam texture, fine sand predominance, and with weak structure, indicating their susceptibility to erosion. In the plains, moderate risk of land degradation is associated with farming activities, in areas with slightly undulating terrain over surfaces and sediments susceptible to erosion. Areas with deep, less susceptible grounds to erosion, but in undulating terrain and under farming use were also considered with moderate risk of land degra-dation. These areas lack detailed studies and land management must favor soil conservation.
A high risk of land degradation by soil erosion increased from 2.54 to 3.81% of the study area. It is related to traditional farming in undulating terrains and irrigated agriculture, mainly through cen-tral pivot systems, particularly on sandy soils with weak structure. Mechanization and cattle ranching increase the erosive processes in these areas. Thus, soil conservation techniques are recommended. If these practices are not adopted, land degradation processes can lead to irreversible impacts on the productive systems.
A very high risk of land degradation by soil erosion is mainly associated with areas where Entisols predominate. It occurs mainly in the northeastern portion of Western Bahia, where soils are shal-low and with shal-low permeability. These areas encompass 5.76% of the study area in 1985 and 2000, where native vegetation cover is still where: Aij = any raster cell; n = number of map units involved;
P = weight attributed to the thematic maps, and scaled between 0 and 1; N = value from 0 to 100, attributed to the cell category.
Equal weights (P) of 0.5 were considered for the two themes (cri-teria). The values for the erosion risks were attributed to the mapped units, in a range of 0 (minimum) to 100 (maximum). The weights and values were defined by the authors, based on their knowledge about the regional soils and ecology. Such definition was submitted to three other experts for consensus evaluation. Areas with shallow soils (Entisols) and steep topography were considered as with very high risk of erosion, independently of the land use and land cover. Table 3 presents the values attributed to each class (in parenthesis), as well as the reclassification for the risk of erosion (cells), defined by the use of the Boolean algebra operator ‘and’, which allowed the overlay of soil and LULC data. The resultant maps for 1985 and 2000 included five classes of risk, indicating aptitudes for land use and management. These maps were then overlaid to generate a synthetic map expressing where the risk of land degradation by soil erosion increased and decreased within the study area.
Results
1. Land use and land cover
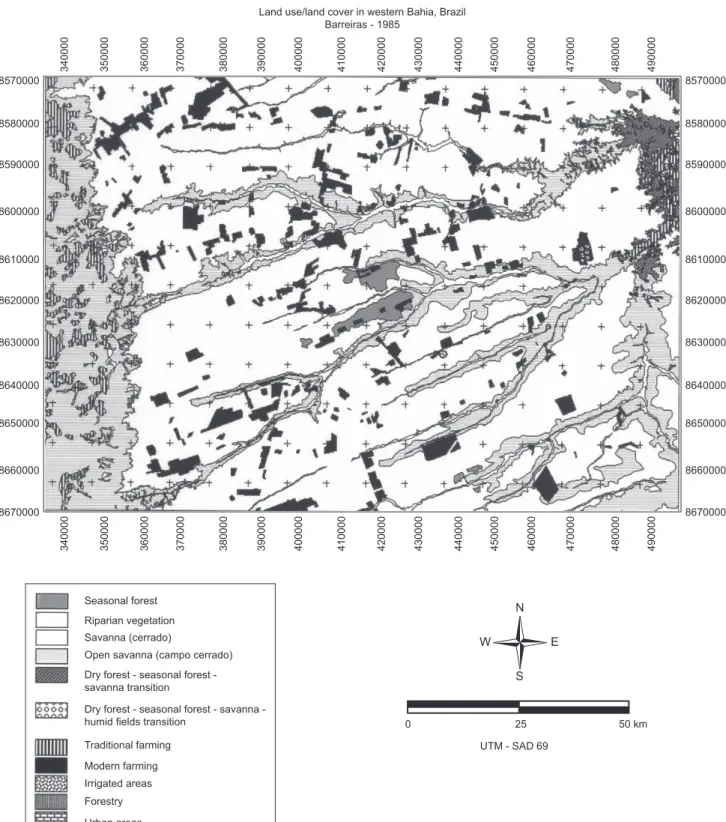
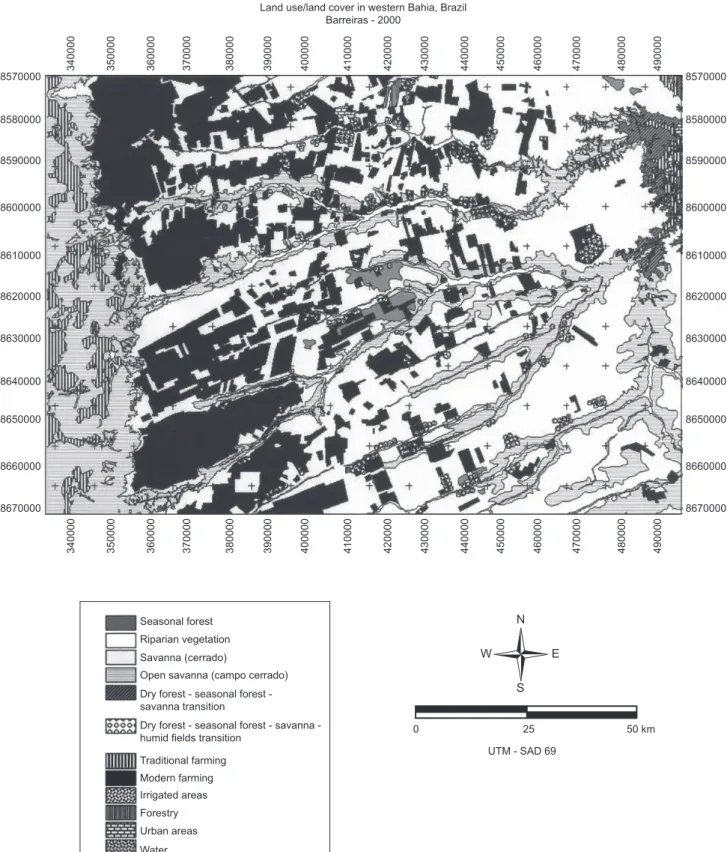
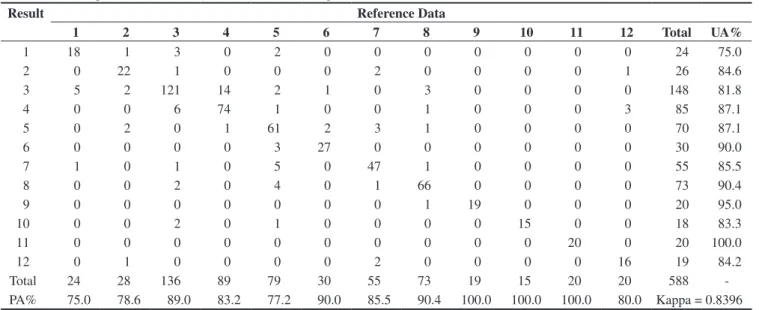
Figures 4 and 5 illustrate LULC maps produced for Western Bahia (Barreiras sheet), in 1985 and 2000, respectively. LULC results for 1985 and 2000, produced through the use of orbital images, enabled not only the quantification of the mapped categories in each date, but also the identification of landscape change patterns and processes. A Kappa index of 0.8396 and 0.7874 was achieved for the 2000 and 1985 classifications, respectively (Tables 4 and 5). Area calculations and the maps themselves show the quantitative dimension and the spatial distribution of landscape changes throughout the region (Table 6).
In 1985, modern farming occupied 631,175 ha of the study area, reaching 1,605,762 ha in 2000. Irrigated areas increased from 17,554 ha in 1985 to 109,883 ha in 2000. Traditional farming sur-passed one million hectares during the same period, going from 8.6 to 11.0% of the study area. Urban areas also increased, from 4,335 ha in 1985 to 9,799 ha in 2000 (i.e., 126.0%). Modern farming and irrigated areas increased 154.4 and 526.0%, respectively. In absolute values, this means an expansion of more than 1 million hectares in intensively cultivated areas in the region. Traditional farming presented smaller relative variation (i.e., 28.3%), but expressive absolute variation (261,898 ha). The area of water bodies increased 15.3%, mainly due to the construction of dams and reservoirs for irrigation.
All classes of natural vegetation cover decreased their areas during the period of study. Savanna (cerrado) lost 21.0% (i.e., 881,483 ha) of its original area. The dry forest-seasonal forest-savanna transition lost 15.2% and the seasonal forest, 11.5% of their areas, respectively. The open savanna (campo cerrado) and the riparian vegetation also lost 6.7 and 2.6% of their areas, respectively. These results indicate that Western Bahia is facing an important LULC change process as a consequence of farming expansion over natural vegetation cover.
2. Land-use and land-cover dynamics between 1985 and 2000
68
Batistella M. & Valladares G.S.
http://www.biotaneotropica.org.br http://www.biotaneotropica.org.br/v9n3/en/abstract?article+bn00909032009 Biota Neotrop., vol. 9, no. 3
Table 3. Classes of risk of land degradation by soil erosion in Western Bahia, Brazil, based on soil types and land use and land cover. Weights to each class
are presented in parenthesis.
Tabela 3. Classes de risco de degradação da terra por erosão do solo na Região Oeste da Bahia, Brasil, com base nos tipos de solo e uso e cobertura da terra.
Pesos para cada classe são apresentados em parênteses.
Soil units1 Land Use/Land Cover
Modern farming
(80)
Tradition-al farming
(70)
Open Savanna
(50)
Savanna (30)
Seasonal Forest
(10)
Dry forest / Seasonal Forest/ Savanna/
Humid fields transition
(50)
Forestry (40)
Irrigated areas (100)
Urban areas
(70)
Dry Forest / Seasonal
Forest/ Savanna transition
(10)
Riparian
vegeta-tion (10)
GXbd1(0) GXbd2(20) LAd1(40) LAd2(30) LAd3(40) LAd4(50) LAd5(60) LAd6(40) LAd7(50) LAd8(50) LAd9(40) LVAd1(30) LVd1(20) LVd2(20) LVd3(50) LVe1(30) PAe1(50) PAe2(80) PVAe1(50) PVAe2(40) PVAe3(40) PVAe4(40) PVAe5(40) PVe1(70) PVe2(70) PVe3(80) RL1(1002)
RQo1(50) RQo2(50) RQo3(50) RQo4(70) RQo5(40) RQo6(40) RQo7(40) RUed1(30) RUed2(20) TCp1(70)
1 Source for soil types: Jacomine et al. (1976). 2 Areas with this soil type were considered as with very high risk of land degradation by erosion.
340000 350000 360000 370000 380000 390000 400000 410000 420000 430000 440000 450000 460000 470000 480000 490000
340000 350000 360000 370000 380000 390000 400000 410000 420000 430000 440000 450000 460000 470000 480000 490000
8570000
8580000
8590000
8600000
8610000
8620000
8630000
8640000
8650000
8660000
8670000
8570000
8580000
8590000
8600000
8610000
8620000
8630000
8640000
8650000
8660000
8670000
N
S
W E
Seasonal forest
Riparian vegetation Savanna (cerrado)
Open savanna (campo cerrado)
Dry forest - seasonal forest - savanna transition
Dry forest - seasonal forest - savanna - humid fields transition
Traditional farming
Modern farming
Irrigated areas
Forestry
Urban areas
Water
0 25 50 km
UTM - SAD 69 Land use/land cover in western Bahia, Brazil
Barreiras - 1985
Figure 4. Example of a land-use/land-cover map of Western Bahia, Brazil for 1985 (Barreiras).
Figura 4. Exemplo de mapa de uso e cobertura da terra para a Região Oeste da Bahia, Brasil em 1985 (Barreiras).
predominant. However, because of the very high erosive potential, any anthropic alteration can speed up land degradation processes resultant from landslides.
Although most of the study area remained stable in terms of risks of land degradation by soil erosion, such risks in-creased in considerable portions where farming expansion
70
Batistella M. & Valladares G.S.
http://www.biotaneotropica.org.br http://www.biotaneotropica.org.br/v9n3/en/abstract?article+bn00909032009 Biota Neotrop., vol. 9, no. 3
Figure 5. Example of a land-use/land-cover map of Western Bahia, Brazil for 2000 (Barreiras).
Figura 5. Exemplo de mapa de uso e cobertura da terra para a Região Oeste da Bahia, Brasil em 2000 (Barreiras).
Land use/land cover in western Bahia, Brazil Barreiras - 2000
340000 350000 360000 370000 380000 390000 400000 410000 420000 430000 440000 450000 460000 470000 480000 490000 340000 350000 360000 370000 380000 390000 400000 410000 420000 430000 440000 450000 460000 470000 480000 490000
8570000
8580000
8590000
8600000
8610000
8620000
8630000
8640000
8650000
8660000
8670000 8570000
8580000
8590000
8600000
8610000
8620000
8630000
8640000
8650000
8660000
8670000
Seasonal forest
Riparian vegetation
Savanna (cerrado)
Open savanna (campo cerrado)
Dry forest - seasonal forest - savanna transition
Dry forest - seasonal forest - savanna - humid fields transition
Traditional farming
Modern farming
Irrigated areas
Forestry
Urban areas
Water
0 25 50 km
UTM - SAD 69
N
S
W E
Discussion
The recent history of Western Bahia is embedded in the context of the conversion of Brazilian savannas to agricultural lands, particularly by soy bean production (Ribeiro & Walter 1998). Farming expansion and intensification are the main drivers of landscape change. Modern
The rate of native vegetation conversion within the biome cerrado is controversial. Machado et al. (2004) estimate an annual loss of 1.1 to 1.5% of the total biome. Ferreira et al. (2007) compared three different studies assessing annual losses from 2001 to 2005. The authors report a variation of cerrado conversion from 2.87% in 2001-2002 to 1.20% in 2004-2005. The present study indicates the conversion of 1,360,280 ha of native vegetation between 1985 and 2000, which corresponds to a loss of 0.84% per year. The differences may be due to the various sensors used for land-use and land-cover mapping. While the numbers reported by Ferreira et al. (2007) were based on images with spatial resolution of 1 km (e.g., MODIS and SPOT V), the present study used Landsat TM and ETM + imagery (AIBA 2001). To follow these processes, the use of geoinformation
and geotechnologies allows relatively rapid assessments, particularly for actions regarding strategic environmental management and land-use planning.
The spatial and temporal dynamics observed in the study area requires effective initiatives for the sustainability of agribusiness and natural resources. The results presented considered a regional scale of analysis, contributing to a broader view on related LULC processes and promoting the identification of opportunities and limitations for conservation and development. They also highlight the need of more detailed maps, particularly for soils and land aptitude to improve the precision of further studies.
Table 5. Accuracy achieved for land-use and land-cover classes in Western Bahia, Brazil (1985).
Tabela 5. Acurácia para as classes de uso e cobertura da terra na Região Oeste da Bahia, Brasil (1985).
Result Reference data
1 2 3 4 5 6 7 8 9 10 11 12 Total UA%
1 31 1 9 1 11 0 0 0 0 0 0 0 53 58.5
2 0 39 6 4 2 5 0 2 1 0 0 0 59 66.1
3 1 1 210 16 2 0 2 4 0 0 0 0 236 89.0
4 0 4 19 87 0 0 1 0 0 0 0 0 111 78.3
5 1 1 14 0 75 5 6 1 0 0 0 0 103 72.8
6 0 0 0 0 0 59 0 0 0 0 0 0 59 100.0
7 0 0 0 0 0 0 51 0 0 0 0 0 51 100.0
8 0 1 0 1 1 0 1 42 0 0 0 0 46 91.3
9 1 4 0 0 6 0 10 0 29 0 0 1 51 56.9
10 0 0 0 0 0 0 0 0 0 0 0 0 0
-11 0 0 1 0 0 0 0 0 0 0 49 0 50 98.0
12 0 5 3 3 0 1 0 0 0 0 0 38 50 76.0
Total 34 56 262 112 97 70 71 49 30 0 49 39 869
-PA% 91.2 69.6 80.2 77.7 77.3 84.3 71.8 85.7 96.8 0 100.0 97.4 Kappa = 0.7874
UA = User’s Accuracy; PA = Producer’s Accuracy; 1 = Seasonal Forest; 2 = Riparian Vegetation; 3 = Savanna (Cerrado); 4 = Open Savanna (Campo Cerrado); 5 = Dry Forest-Seasonal Forest-Savanna Transition; 6 = Dry Forest-Seasonal Forest-Savanna-Humid Fields Transition; 7 = Traditional Farming; 8 = Modern Farming; 9 = Irrigated Areas; 10 = Forestry; 11 = Urban Areas; 12 = Water.
Table 4. Accuracy achieved for land-use and land-cover classes in Western Bahia, Brazil (2000).
Tabela 4. Acurácia para as classes de uso e cobertura da terra na Região Oeste da Bahia, Brasil (2000).
Result Reference Data
1 2 3 4 5 6 7 8 9 10 11 12 Total UA%
1 18 1 3 0 2 0 0 0 0 0 0 0 24 75.0
2 0 22 1 0 0 0 2 0 0 0 0 1 26 84.6
3 5 2 121 14 2 1 0 3 0 0 0 0 148 81.8
4 0 0 6 74 1 0 0 1 0 0 0 3 85 87.1
5 0 2 0 1 61 2 3 1 0 0 0 0 70 87.1
6 0 0 0 0 3 27 0 0 0 0 0 0 30 90.0
7 1 0 1 0 5 0 47 1 0 0 0 0 55 85.5
8 0 0 2 0 4 0 1 66 0 0 0 0 73 90.4
9 0 0 0 0 0 0 0 1 19 0 0 0 20 95.0
10 0 0 2 0 1 0 0 0 0 15 0 0 18 83.3
11 0 0 0 0 0 0 0 0 0 0 20 0 20 100.0
12 0 1 0 0 0 0 2 0 0 0 0 16 19 84.2
Total 24 28 136 89 79 30 55 73 19 15 20 20 588
-PA% 75.0 78.6 89.0 83.2 77.2 90.0 85.5 90.4 100.0 100.0 100.0 80.0 Kappa = 0.8396
72
Batistella M. & Valladares G.S.
http://www.biotaneotropica.org.br http://www.biotaneotropica.org.br/v9n3/en/abstract?article+bn00909032009 Biota Neotrop., vol. 9, no. 3
This process is intensified by the dryer and warmer climate on these areas when compared to the plateau.
The occidental plateau of Western Bahia has flat topography with altitudes varying from 700 to 900 m (Jacomine et al. 1976) and deep soils (Valladares 2002). Under native vegetation cover, these soils present low erosion potential (Valladares et al. 2002, Embrapa 1999). However, its limestone substrate has high susceptibility to erosion. When subjected to the suppression and degradation of the native vegetation and to intense agricultural activities, erosive proc-esses may take place.
Although the classes of high and very high risk of land degrada-tion by soil erosion added up to only 8.30% of the total study area in 1985 and 9.57% in 2000, this is equivalent to approximately 30% of the entire state of Alagoas. Land classified as with moderate risk of erosion need special attention if converted to agriculture. If soil conservation practices are not adopted, the risk may pass to high or very high.
An alternative to conventional agricultural practices in Brazilian savannas is the no-tillage system, a primary management strategy for increasing soil organic matter (Bayer et al. 2000). The continuous use of no-tillage systems results in the increase of microbial biomass, decrease in soil basal respiration, and increase in soil organic matter content. These practices also improve bulk density and chemical properties of savanna soils (Valpassos et al. 2001). Further studies, in more detailed scales, have to be done to evaluate the impact of these alternative practices within the region.
The abundant water resources, flat topography, and the tropical climate with dry winters and humid summers favor soy bean produc-tion, as well as crops such as corn, bean, rice, cotton, and the irrigated fruit plantations. However, farming expansion and intensification caused the conversion and degradation of the native vegetation, mainly the savannas. Factors such as unplanned tourism activities, lack of environmental law enforcement, and migration have contributed to the landscape transformations during the last two decades. Further studies
Table 6. Area, percentage of the study area, and area variation of land-use and land-cover classes in Western Bahia, Brazil.
Tabela 6. Área, porcentagem da área total e variação da área das classes de uso e cobertura da terra na Região Oeste da Bahia, Brasil.
Legend Area
1985 (ha)
Percentage of the study area
1985 (%)
Area 2000 (ha)
Percentage of the study area
2000 (%)
Absolute variation
(ha)
Relative variation
(%)
Seasonal forest 577,269 5.3 510,853 4.7 –66,417 –11.5
Riparian vegetation 359,263 3.3 349,771 3.2 –9,492 –2.6
Savanna (Cerrado) 4,197,354 38.8 3,315,870 30.6 –881,483 –21.0
Open Savanna (Campo Cerrado)
1,976,212 18.3 1,844,444 17.0 –131,768 –6.7
Dry Forest-Seasonal Forest-Savanna transition
1,777,386 16.4 1,507,795 13.9 –269,592 –15.2
Dry Forest-Seasonal Forest-Savanna humid fields transition
337,437 3.1 335,909 3.1 –1,528 –0.4
Traditional Farming 924,750 8.6 1,186,648 11.0 261,898 28.3
Modern farming 631,175 5.8 1,605,762 14.9 974,587 154.4
Irrigated areas 17,554 0.2 109,883 1.1 92,329 526.0
Forestry 0 0.0 24,364 0.3 24,364 0.0
Urban areas 4,335 0.1 9,799 0.1 5,464 126.0
Water 10,677 0.1 12,316 0.1 1,639 15.3
Total 10,813,413 100.0 10,813,413 100.0 -
-Table 7. Area and percentage of the study area for classes of land-use and
land-cover dynamics in Western Bahia, Brazil.
Tabela 7. Área e porcentagem da área total das classes de dinâmica de uso e
cobertura da terra na Região Oeste da Bahia, Brasil.
Classes Area (ha) Percentage of the
study area (%)
Stable 8,752,307 80.94
Farming expansion 1,675,233 15.49
Intensification towards irrigated areas
21,138 0.20
Intensification towards modern farming
31,495 0.29
Extensification towards modern farming
421 0.01
Extensification towards traditional farming
3,166 0.03
Expansion of water bodies 1,989 0.02
Expansion of urban areas 5,383 0.05
Secondary succession 322,281 2.98
Total 10,813,413 100.00
allowing the detection of smaller fragments and possibly having as a consequence a larger number for the total native vegetation cover.
Figure 6. Example of a land-use/land-cover dynamics map of Western Bahia, Brazil (Barreiras).
Figura 6. Exemplo de mapa da dinâmica de uso e cobertura da terra para a Região Oeste da Bahia, Brasil (Barreiras).
340000 350000 360000 370000 380000 390000 400000 410000 420000 430000 440000 450000 460000 470000 480000 490000
340000 350000 360000 370000 380000 390000 400000 410000 420000 430000 440000 450000 460000 470000 480000 490000
8670000
8660000
8650000
8640000
8630000
8620000
8610000
8600000
8590000
8580000
8570000 8670000
8660000
8650000
8640000
8630000
8620000
8610000
8600000
8590000
8580000
8570000
Stable
Farming expansion
Intensification towards irrigated areas Intensification towards modern farming Extensification towards modern farming Extensification towards traditional farming Expansion of water bodies
Expansion of urban areas Secondary succession
0 25 50
km UTM - SAD 69
N
S
W E
Land-user/land-cover dynamics in western Bahia, Brazil Barreiras 1985 - 2000
Table 8. Area (ha) and percentage of the study area for risk of land degradation by soil erosion in Western Bahia, Brazil in 1985 and 2000.
Tabela 8. Área e porcentagem da área total das classes de risco de degradação da terra por erosão de solo na Região Oeste da Bahia, Brasil em 1985 e 2000.
1985 2000
Very low Low Moderate High Very high Water Total
Area % Area % Area % Area % Area % Area % Area %
Very low 776934 7.90 3055 0.03 181729 1.85 5558 0.06 1 0.00 255 0.00 967532 9.84
Low 332 0.00 4228381 43.00 960854 9.77 94054 0.96 0 0.00 1450 0.01 5285071 53.75
Moderate 50068 0.51 181769 1.85 2454414 24.96 67799 0.69 0 0.00 290 0.00 2754340 28.01
High 111 0.00 19981 0.20 22373 0.23 207640 2.11 0 0.00 0 0.00 250105 2.54
Very high 1 0.00 0 0.00 0 0.00 0 0.00 566092 5.76 0 0.00 566094 5.76
Water 0 0.00 214 0.00 47 0.00 0 0.00 94 0.00 9521 0.10 9876 0.10
74
Batistella M. & Valladares G.S.
http://www.biotaneotropica.org.br http://www.biotaneotropica.org.br/v9n3/en/abstract?article+bn00909032009 Biota Neotrop., vol. 9, no. 3
350000 400000 450000 500000 550000 600000 650000
350000 400000 450000 500000 550000 600000 650000
8800000
8750000
8700000
8650000
8600000
8550000
8500000
8450000
8800000
8750000
8700000
8650000
8600000
8550000
8500000
8450000
0 15 30 60 90 120 km
Stable
Decreased soil erosion risk
Increased soil erosion risk
N
S
W E
Figure 7. Risk of land degradation by soil erosion in Western Bahia, Brazil between 1985 and 2000.
Figura 7. Risco de degradação da terra por erosão do solo na Região Oeste da Bahia, Brasil entre 1985 e 2000.
should enhance the knowledge about disturbances provoked by these transformations and the driving forces leading to land degradation. Multiscale approaches may also contribute to the understanding of possible environmental impacts caused by farming expansion and intensification, from the landscapes to the region.
References
Associação de Agricultores do Oeste da Bahia - AIBA. 2001. Caderno especial: café. AIBA, Barreiras, 4 p.
Associação de Agricultores do Oeste da Bahia - AIBA. 2002. Safra 2002: região oeste da Bahia. AIBA, Barreiras, 8 p.
ARAÚJO, F.S., MARTINS, F.R. & SHEPHERD, G.J. 1999. Variações estruturais e florísticas do carrasco no planalto da Ibiapaba, Estado do Ceará. Rev. Bras. Biol. 59(4):663-687.
ARAÚJO, F.S. & MARTINS, F.R. 1999. Fisionomia e organização da vegetação do carrasco no planalto da Ibiapaba, Estado do Ceará. Acta Bot. Bras. 13(1):1-13.
BACCARO, C.A.D. 1999. Processos erosivos no domínio do Cerrado. In Erosão e conservação dos solos: conceitos, temas e aplicações (Guerra, A.J.T., Silva, A.S. & Botelho, R.G.M, eds.). Bertrand Brasil, Rio de Janeiro, p.141-168.
BALBINO, L.C., BRUAND, A., BROSSARD, M., GRIMALDI, M., HAJNOS, M. & GUIMARÃES, M.F. 2002. Changes in porosity and microaggregation in clayey Ferralsols of the Brazilian Cerrado on clearing for pasture. Eur. J. Soil Sci. 53(2):219-230.
BATISTELLA, M., GUIMARÃES, M., MIRANDA, E.E., VIEIRA, H.R., VALLADARES, G.S., MANGABEIRA, J.A.C. & ASSIS, M.C. 2003. Monitoramento da expansão agropecuária na Região Oeste da Bahia. Embrapa Monitoramento por Satélite, Campinas, 39 p. (Documentos, 20).
BAYER, C., MIELNICZUK, J., AMADO, T.J.C., MARTIN-NETO, L. & FERNANDES, S.V. 2000. Organic matter storage in sandy clay loam Acrisol affected by tillage and cropping systems in southern Brazil. Soil Till. Res. 54(1-2):101-109.
BERTONI, J. & LOMBARDI NETO, F. 1985. Conservação do solo. Livroceres, Piracicaba, 392 p.
BODDEY, R.M., SÁ, J.C.M., ALVES, B.J.R. & URQUIAGA, S. 1997. The contribution of biological nitrogen fixation for sustainable agricultural systems in the tropics. SoilBiol. Biochem. 29(5-6):787-799.
BRANNSTROM, C. 2001. Conservation-with-development models in Brazil’s agro-pastoral landscapes. World Dev. 29(8):1345-1359.
BRASIL. Ministério das Minas e Energia. Secretaria Geral. 1982. Projeto RADAMBRASIL: Folha SD. 23. Rio de Janeiro, 660 p. (Levantamento de Recursos Naturais, v. 29).
CHIARA, M. 2002. Oeste da Bahia vive boom de novos negócios. O Estado de São Paulo, São Paulo, 23 de Junho. (Economia, Especial).
CONGALTON, R.G. 1991. A review of assessing the accuracy of classification of remotely sensed data. Rem. Sens. Env., 37(1):35-46.
EITEN, G. 1994. Vegetação. In Cerrado: caracterização, ocupação e perspectivas (M.N. Pinto, org.). Universidade de Brasília, Brasília, p. 17-74.
Empresa Brasileira de Pesquisa Agropecuária- EMBRAPA. 1999. Sistema brasileiro de classificação de solos. EMBRAPA, Rio de Janeiro, 306 p. FAVIS-MORTLOCK, D.T. & GUERRA, A.J.T. 1999. The implications of
general circulation model estimates of rainfall for future erosion: a case study from Brazil. Catena. 37(3-4):329-354.
FERREIRA, M.E., FERREIRA Jr., L.G., FERREIRA, N.C., ROCHA, G.F. & NEMAYER, M. 2007. Desmatamentos no bioma cerrado: uma análise temporal (2001-2005) com base nos dados MODIS - MOD13Q1. In Simpósio Brasileiro de Sensoriamento Remoto. INPE, Florianópolis, p. 3877-3883.
GILLER, K.E., BEARE, M.H., LAVELLE, P., ISAC, A.M.N. & SWIFT, M.J. 1997. Agricultural intensification, soil biodiversity and agroecosystem function. Appl. Soil Ecol. 6(1):3-16.
GOMES, E.G. & ESTELLITA LINS, M.P. 2002. Integrating geographical information systems and multi-criteria methods: a case study. Ann. oper. res. 116(1-4):243-269.
Instituto Brasileiro de Geografia e Estatística - IBGE. 2005. Banco de dados agregados. http://www.ibge.gov.br (Sistema IBGE de recuperação automática - SIDRA).
Landscape change processes taking place in Western Bahia are mainly due to farming expansion. These processes alter physical and chemical properties of soils, vegetation structure, composition, and stability, as well as biodiversity. Socioeconomic drivers are also part of the process, affecting public policies related to the regional management. Satellite monitoring of these changes and information systems integrating biophysical and socioeconomic data may help future plans to integrate the need of regional development with more sustainable land-use practices.
Although areas covered by natural vegetation still predominate in Western Bahia, the spatial dimension of farming expansion (1,675,233 ha) and farming intensification (52,633 ha) is of great relevance. The process is evident and is fostered by incentives of all sorts, including governmental and private investments. Farming expansion and intensification tend to increase even more, favored by the state-of-the-art agricultural practices in areas of savanna. Counties such as São Desidério, Correntina, Barreiras, Luís Eduardo Magal-hães, Formosa do Rio Preto, and Riachão das Neves are the main areas where these processes take place (AIBA 2002).
Farmers in Western Bahia expect a long cycle of highly produc-tive agriculture. However, due to the fragmentation of areas with natural vegetation cover and the consequent loss of biodiversity, land planning measures are urgent to conciliate the regional development with the conservation of natural resources. Recently, the Bahia State government has established land zoning as a priority. Hopefully, the results produced by this research will serve as a basis to mitigate further impacts of farming expansion and intensification, as well as their outcomes in terms of land degradation by soil erosion.
Final Remarks
Farming expansion and intensification in the Western Region of Bahia State reproduce the land degradation and development examples of other savanna lands in Brazil. The positive aspects of such processes include the modernization of production systems and economic development within the region, creating a cycle of develop-ment for this portion of the country. Soy bean production and irrigated agriculture play central roles in these transformations.
On the other hand, the challenges of this development approach should include the conservation of native vegetation cover, the ad-vance of agricultural, biotechnological, and ecological research, the creation of a mosaic of conservation units, and the dissemination of soil and water conservation practices.
The engagement of associations of farmers, governmental and non-governmental organizations, public and private institutions at local and regional levels opens new opportunities for a more sustain-able development in Western Bahia, avoiding problems such as land degradation by soil erosion. This research contributes with elements related to landscape transformations as a baseline for further initia-tives on strategic decision making processes regarding environmental and land-use planning within the region. Land zoning based on detailed socioeconomic and ecological studies may be a reasonable way to overcome the problems associated with farming expansion in the region.
Acknowledgements
76
Batistella M. & Valladares G.S.
http://www.biotaneotropica.org.br http://www.biotaneotropica.org.br/v9n3/en/abstract?article+bn00909032009 Biota Neotrop., vol. 9, no. 3
NEUFELDT, H., AYARZA, M.A., RESCK, D.V.S. & WOLFGANG, Z. 1999. Distribution of water-stable aggregating agents in Cerrado Oxisols. Geoderma. 93(1-2):85-99.
Prefeitura Municipal de Barreiras. 2000. Barreiras: a capital do Oeste da Bahia/Barreiras: Bahia’s West Capital City. Prefeitura Municipal de Barreiras, Barreiras, 29. p.
RENARD, K.G., LAFTEN, J.M., FOSTER, G.R. & MCCOOL, D.K. 1997. The revised universal soil loss equation. In Soil erosion research methods (Lal, R.,ed.). Soil and Water Conservation Society, Ankeny, p. 105-124.
RIBEIRO, J.F. & WALTER, B.M.T. 1998. Fitofisionomias do Bioma Cerrado. In Cerrado: ambiente e flora (Sano, S.M. & Almeida, S.P. eds.). Embrapa CPAC, Planaltina, p. 89-166.
ROTH, C.H. 1997. Bulk density of surface crusts: depth function and relationships to texture. Catena. 29(3-4):223-237.
SMITS, P.C., DELLEPIANE, S.G. & SCHOWENGERDT, R.A. 1999. Quality assessment of image classification algorithms for land-cover mapping: a review and a proposal for a cost based approach. Int. J. Remote Sens. 20(8):1461-1486.
VALLADARES, G.S., GUIMARÃES, M. & BATISTELLA, M. 2002. Susceptibilidade à erosão da região Oeste do Estado da Bahia. Embrapa Monitoramento por Satélite, Campinas, 9. p. (ComunicadoTécnico, 10).
VALLADARES, G.S. 2002. Caracterização dos solos e classes de terra para irrigação do Oeste da Bahia. Embrapa Monitoramento por Satélite, Campinas, 44. p. (Documentos, 19).
VALPASSOS, M.A.R., CAVALCANTE, E.G.S., CASSIOLATO, A.M.R. & ALVES, M.C. 2001. Effects of soil management systems on soil microbial activity: bulk density and chemical properties. Pesq. Agropecu. Bras.
36(12):1539-1545.
VELOSO, H.P., RANGEL FILHO, A.L.R. & LIMA, J.C.A. 1991. Classificação da vegetação brasileira, adaptada a um sistema universal. IBGE, Rio de Janeiro. (Departamento de Recursos Naturais e Estudos Ambientais). WALTER, B.M.T. & SAMPAIO, A.B. 1998. A vegetação da Fazenda
Sucupira. Embrapa Recursos Genéticos e Biotecnologia, Brasília, 110. p. (Documentos, 36).
WISCHMEIER, W.H. & SMITH, D.D. 1978. Predicting rainfall erosion losses. USDA, Washington, 58. p. (US Department of Agriculture, Agriculture Handbook 537).
XAVIER-DA-SILVA, J. 2000. Geoprocessamento e análise ambiental. Rev. Bras. Geogr. 54:47-61.
Received 06/08/07 Revised 30/05/09 Accepted 01/07/09
Instituto Brasileiro de Geografia e Estatística - IBGE. 1984a. Barreiras: Folha SD-23-V-B: MIR-346. IBGE, Rio de Janeiro. (Mapa/1:250.000). Instituto Brasileiro de Geografia e Estatística - IBGE. 1984b. Formosa
do Rio Preto: Folha SC-23-Y-D: MIR-326. IBGE, Rio de Janeiro. (Mapa/1:250.000).
Instituto Brasileiro de Geografia e Estatística - IBGE. 1984c. Santa Maria da Vitória: Folha SD-23-X-C: MIR-364. IBGE, Rio de Janeiro. (Mapa/1:250.000).
Instituto Brasileiro de Geografia e Estatística - IBGE. 1984d. Santa Rita de Cássia: Folha SD-23-Z-C: MIR-327. IBGE, Rio de Janeiro. (Mapa/1:250.000).
Instituto Brasileiro de Geografia e Estatística - IBGE. 1984e. Santana: Folha SD-23-X-A: MIR-347. IBGE, Rio de Janeiro. (Mapa/1:250.000). Instituto Brasileiro de Geografia e Estatística - IBGE. 1984f. São Domingos:
Folha SD-23-V-D: MIR-363. IBGE, Rio de Janeiro. (Mapa/1:250.000). JACOMINE, P.K.T., CAVALCANTI, A.C., RIBEIRO, M.P., MONTENEGRO,
J.O., BURGOS, N., MELO FILHO, H.F.R. & FORMIGA, R.A. 1976. Levantamento exploratório-reconhecimento de solos da margem esquerda do rio São Francisco, estado da Bahia. Embrapa, Rio de Janeiro. (Boletim Técnico, 38/Divisão de Recursos Renováveis, 7).
JANKOWSKI, P. 1995. Integrating geographical information systems and multiple criteria decision-making methods. Int. J. Geogr. Inf. Syst. 9(3):251-273.
LAL, R. 2001. Soil degradation by erosion. Land Degrad. Dev. 12:519-539. LU, D., LI, G., VALLADARES, G.S. & BATISTELLA, M. 2004. Mapping
soil erosion risk in Rondônia, Brazilian Amazonia: using RUSLE, remote sensing and GIS. Land Degrad. Dev. 15:499-512.
MACHADO, R.B., RAMOS NETO, M.B., PEREIRA, P.G.P., CALDAS, E.F., GONÇALVES, D.A., SANTOS, N.S., TABOR, K. & STEININGER, M. 2004. Estimativas de perda da área do Cerrado brasileiro. Conservação Internacional, Brasília. (Relatório técnico não publicado). http://www. conservation.org.br/arquivos/RelatDesmatamCerrado.pdf
MALCZEWSKI, J. 1999. GIS and multicriteria decision analysis. John Wiley & Sons, New York.
MATTSSON, B., CEDERBERG, C. & BLIX, L. 2000. Agricultural land use in life cycle assessment (LCA): case studies of three vegetable oil crops. J. Clean. Prod. 8(4):283-292.
NEPSTAD, D.C., KLINK, C.A., UHL, C., VIEIRA, I.C., LEFEBVRE, P., PEDLOWSKI, M., MATRICARDI, E., NEGREIROS, G., BROWN, I.F., AMARAL, E., HOMMA, A. & WALKER, R. 1997. Land-use in Amazonia and the cerrado of Brazil. Cienc. Cult. 49(1-2):73-86. NEUFELDT, H., RESCK, D.V.S. & AYARZA, M.A. 2002. Texture and