INVESTIGATION ON THE PRESSURE MATCHING PERFORMANCE
OF THE CONSTANT AREA SUPERSONIC-SUPERSONIC EJECTOR
by
Jian CHEN, Zhenguo WANG*, Jiping WU, and Wanwu XU
Science and Technology on Scramjet Laboratory, National University of Defense Technology, Changsha, China
Original scientific paper DOI: 10.2298/TSCI120405114C
The pressure matching performance of the constant area supersonic-supersonic ejector has been studied by varying the primary and secondary Mach numbers. The effect of the primary fluid injection configurations in ejector, namely periph-eral and central, has been investigated as well. Schlieren pictures of flow struc-ture in the former part of the mixing duct with different stagnation pressure ratio of the primary and secondary flows have been taken. Pressure ratios of the pri-mary and secondary flows at the limiting condition have been obtained from the results of pressure and optical measurements. Additionally, a computational fluid dynamics analysis has been performed to clarify the physical meaning of the pressure matching performance diagram of the ejector. The obtained results show that the pressure matching performance of the constant area supersonic- -supersonic ejector increases with the increase of the secondary Mach number, and the performance decreases slightly with the increase of the primary Mach number. The phenomenon of boundary layer separation induced by shock wave results in weaker pressure matching performance of the central ejector than that of the peripheral one. Furthermore, based on the observations of the experiment, a simplified analytical model has been proposed to predict the limiting pressure ratio, and the predicted values obtained by this model agree well with the exper-imental data.
Key words: ejector, high-energy chemical laser, pressure recovery system, pressure matching
Introduction
Supersonic ejectors are fluid devices in which two fluid streams are allowed to per-form the mixing and re-compression. One fluid with higher total energy is the primary flow, and the other fluid with lower total energy is the secondary flow. In a supersonic ejector, transfer of mechanical energy from the primary flow to secondary flow is accomplished by mixing of these two streams, and supersonic ejector is operated without moving parts. Its simplicity makes supersonic ejectors found many applications in engineering, such as high-altitude test facilities [1], ejector ramjets [2], and ejector based refrigeration cycle [3], etc. However, the primary motivation for this investigation is the application of the supersonic ejector as the pressure recovery system in the high-energy chemical laser. In the continuous-wave chemical laser, the flow at the laser cavity exit is supersonic and with low static pressure (~400 Pa) [4]. To start and sustain the lasing process, the laser cavity flow must be pumped to ––––––––––––––
the ambient condition. Thus, the pressure recovery system is necessary for the high-energy chemical laser system.
The subsonic-supersonic ejector is used as the conventional approach to solve the pressure recovery problem in the past decades, fig. 1(a). However, the requirement of high flexibility on the transportable tactical high-energy laser expects a further reduction on the weight and volume with a better performance of the pressure recovery system [5]. The super-sonic-supersonic ejector (SSE), fig. 1(b), seems to be a very suitable means to satisfy the re-quirement of the tactical high-energy laser mentioned above [6]. In the supersonic-supersonic ejector, the diffusers between the laser cavity exit and the ejector are eliminated, and the su-personic laser cavity flow is pumped directly by the susu-personic ejector.
Figure 1. Approaches to the pressure recovery problem; (a) subsonic-supersonic ejector, (b) supersonic-supersonic ejector
However, investigations on the supersonic-supersonic ejector [7] have been rarely reported. In 1980s, Mikkelsen et al. [8], and Dutton et al. [9] performed 1-D analyses of the constant area supersonic-supersonic ejector (CASSE), and a series of small-scale CASSE ex-periments have been conducted to validate the theoretical results. Recently, researches con-cerned with the SSE have not been available in the open literature until the work of Dvorak et al. [10, 11] on a 2-D CASSE, and the flow structures in former part of the mixing duct and the transonic instability of the ejector were analyzed.
For a supersonic-supersonic ejector, the Mach number of the secondary flow at the mixing duct inlet must be greater than unity. However, if the primary-to-secondary inlet static pressure ratio is great than unity, the secondary flow is compressed by the mutual interaction of the primary and secondary flows within the mixing duct, this process is limited, and a con-dition is eventually reached for which the secondary flow is compressed to “aerodynamic choking” condition, fig. 2. The inlet static pressure ratio of the primary and secondary flows ξi
(= Ppi/Psi) at this limiting condition is called the limit pressure ratio (ξi)lim. When the value of
ξi exceeds the value of (ξi)lim, separation of the secondary flow occurs. Thus, (ξi)lim is used as
Due to the low cavity pressure of the high-energy chemical laser, high compres-sion ratio Pb/Psi is required. Figure 3
illus-trates a typical operation plane for the CAS-SE, and the uppermost boundary of the plane defines the maximum compression ra-tio of the ejector. In fig. 3 it is observed that the value of the maximum compression ratio at the limiting condition is greater than that at the matched pressure condition. However, when ξi exceeds (ξi)lim, performance of the
ejector declines because of the separation of the secondary flow [9]. Therefore, the pres-sure matching performance of the constant area supersonic-supersonic ejector should be investigated in detail.
Experimental setup and numerical methods Experimental set-up
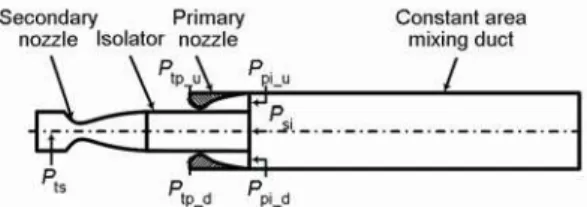
In this study, the rectangular CASSE with the depth being 80 mm are investigat-ed. Figure 4 shows the schematic view of the model ejectors, the supersonic primary flow is symmetrically injected along the top and bottom walls, and the secondary flow is injected through a constant area isolator with its length being 270 mm. Then, the primary and secondary flows mix in the 840 mm long constant area mixing duct which is 84 mm high. The primary and sec-ondary inlet heights at the entrance of the mixing duct are 20 mm and 40 mm, respec-tively. Both the primary and secondary
noz-zles are designed by the method of characteristics to produce uniform distributions of velocity and pressure at the confluence point of two streams. Pressure taps are installed at six locations, namely, two stagnation pressures of the primary flows (Ptp_u and Ptp_d, respectively), stagnation
pressure of the secondary flow (Pts), and static pressures of the primary and secondary flows at
the entrance of the mixing duct (Ppi_u, Ppi_d, and Psi). Piezopressure transducers with an
operat-ing range of 0-1 MPa and an accuracy of 0.5% are used to measure Ptp_u and Ptp_d, and the
transducers with a range of 0-100 kPa and an accuracy of 0.05% are used for the measurement of the pressure at the other points. The data rates of all the pressure measurements are 1000 Hz.
The Mach numbers of the primary and secondary at the entrance of the mixing duct are calibrated by the measured pressures via eq. (1):
t
i i
π( , ) P
M
P = γ (1)
Figure 2. Schematic of the flow field at the limiting condition
Figure 3. Typical operation plane for the CASSE
where
1 2
1 π( , ) 1
2
M M
γ γ
γ
γ =⎛⎜ + − ⎞⎟ −
⎝ ⎠ (2)
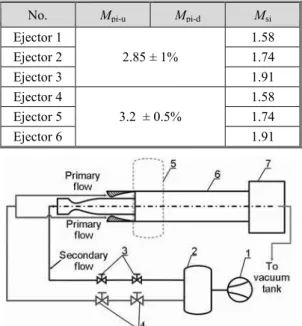
The calibrated Mach numbers at the mixing duct inlet are listed in tab. 1.
The schematic of the test facility is il-lustrated in fig. 5. Both the primary and secondary fluids are the compressed air from a pressure tank, and these two fluids are led through the closing and control valves to the ejector. Then the mixed flow is led through a final stagnation chamber with back pressure control valve, which is located downstream from the ejector exit. However, the back pressure control valve is fully open in the current study.
The characteristic of flow in the su-personic ejector is rather complex, shock waves, mixing layers, the interaction tween shock waves and the interaction be-tween shock waves and mixing layers oc-cur frequently, and the schlieren method seems to be very suitable for investigation. Schlieren pictures are taken with turning the knife edge to horizontal position (0 de-gree), so the optical measurements are sensitive to changes of density in direction perpendicu-lar to the symmetrical plane of the ejector, and the right-most border of the region visible at optical measurements is approximately 100 mm downstream from the mixing duct inlet.
Numerical model
In the current computational analysis, the 2-D Reynolds averaged Navier-Stokes (RANS) equations are solved with the density based solver of FLUENT [12]. The k-ε RNG turbulence model with the enhanced wall treatment is employed to simulate the turbulent flow field in the ejector, and the k-ε RNG model is selected for it gives good results for the shock phase and strength [13]. The equations are solved using a finite-volume integration scheme, the second order spatially accurate upwind scheme with the advection upstream splitting method (AUSM) flux vector splitting is utilized.
The cold air is considered to be a calorically perfect gas with a constant ratio of spe-cific heats, namely = 1.4. The air, using the idea gas approximation, and the total tempera-ture is 293.15 K, is used as the working fluid. The Sutherland law of viscosity is employed. The solutions can be considered as converged when most of the residuals reach their mini-mum values after falling for more than three orders of magnitude, and the computed in flow and the outflow mass flux is required to drop below 0.0001 kg/s.
The domain of the ejectors is considered to be symmetrical about the central plane. Boundary conditions are defined by inlet pressure in entrances of the ejector and by outlet pres-Table 1. Inlet Mach numbers for the ejector
experiments
No. Mpi-u Mpi-d Msi
Ejector 1
2.85 ± 1%
1.58
Ejector 2 1.74
Ejector 3 1.91
Ejector 4
3.2 ± 0.5%
1.58
Ejector 5 1.74
Ejector 6 1.91
Figure 5. Test installation of the investigated model ejectors;
1 – compressor, 2 – pressure tank,
sure at the exit of the ejector, and no-slip conditions are applied along the solid walls by setting the velocity components to zero and nullifying the energy contributions of the wall faces to the dissipative fluxes. The structured quadrilateral mesh containing approximately 90,000 cells is created by the commercial software Gambit. The concentration of grid density is focused on the areas where significant phenomena is expected [14], also the grid is densely clustered near the walls of the mixing duct, and the height of the first row of cells is set at a distance to the wall of 0.01 mm, which results in a value of y+ smaller than 1.0 for all of the flow field.
Results and discussion
Supersonic flow structures with varied pressure ratio
The essential of the pressure matching between the primary and secondary flows in the CASSE is the interaction of two supersonic jets in a confined duct. In this section, the near field flow structures of the primary and secondary jets with varied ξi are studied. Since the
primary and secondary inlet static pressures, Ppi and Psi, are difficult to be obtained when
op-tical measurements are performed, thus, the stagnation pressure ratio ξt (=Ptp/Pts) is also used
in this paper, and the corresponding ξi can be determined by using eq. (1).
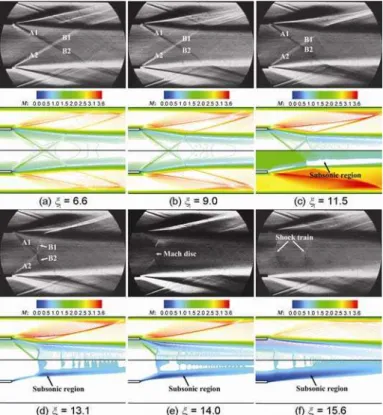
Figure 6 shows the super-sonic flow field in former part of the mixing duct of the ejec-tor 3 for different ξt.
In fig. 6(a), when ξt = 6.6,
and the corresponding ξi≈ 1.6,
the secondary flow is com-pressed and two oblique shock waves, namely A1 and A2, in-tersect at the symmetric plane, and two shock waves B1 and B2 go on. The angles of shock waves A1 and A2, together with their reflected shock waves B1 and B2, increase with the increase of ξt, figs.
6(b)-(d). However, it is ob-served from the numerical re-sults shown in figs. 6(a)-(d), the reflected shock waves B1 and B2 are strong oblique shock waves when ξt = 13.1,
and the shock waves B1 and B2 are weak ones in the other cases. As depicted in fig. 6(e), when ξt increases to 14.0, a
Mach disc appears in the
sec-ondary flow. As ξt increases further, the secondary inlet at the mixing duct entrance is no
longer occupied by the supersonic secondary flow completely, the boundary layer of the sec-ondary flow separates in the isolator, and a shock train runs into the mixing duct, fig. 6(f).
Thus, there exists a limiting pressure ratio (ξi)lim_01, when ξi exceeds (ξi)lim_01, separation of the
secondary flow occurs. However, (ξi)lim_01 is hard to be obtained accurately via schlieren
pic-tures, an alternate “limiting pressure ratio”, (ξi)lim_02, is set in this paper when the Mach disc
just disappears, as depicted in fig. 6(d). Thus, the value of (ξi)lim_02 can be determined
experi-mentally, in this case, (ξi)lim_02≈ 3.11, and the value of (ξi)lim_01 is determined by numerical
computation in the following sections.
Effect of the primary and secondary Mach numbers on the pressure matching performance
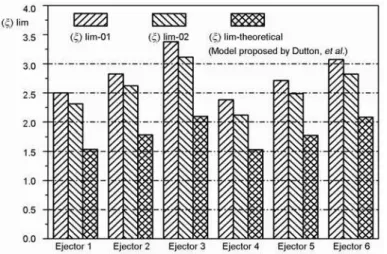
The limiting pressure ratios of the CASSE with different inlet primary and secondary Mach numbers are presented in fig.7, and the limiting pressure ratios calculated by the theoret-ical model proposed by Dutton, et al. [9] are also given.
It is observed from fig. 7 that, the pressure matching performance of the CASSE increases with the increase of the secondary Mach number, and the performance decreases slightly with the increase of the primary Mach number. The effect of the secondary Mach number on the pressure matching performance can be explained by the model proposed by Dutton, et al. The flow model is shown in fig. 2 with the assumptions [9]:
– The primary and secondary streams remain distinct and do not mix be-tween stations i and 2.
– The flow is isentropic for both the pri-mary and secondary flows between stations i and 2.
– The Mach number of the secondary flow at station 2 is unity, i. e. Ms2 = 1.0. Mpi, Api, and Asi keep constant, and Psi is assumed to be unaltered when Msi
increas-es. Figure 8 shows the control volume of the secondary flow in section i-2.
Applying the momentum conservation equation to this control volume yields:
si
s2
2 2
si si s si s2 s2 s s2
2
p s2 s2 s s2 p si s2
(1 ) (1 )
d (1 ) ( )
γ γ
γ
+ = + +
+
∫
= + + −A
A
P A M P A M
P A P A M P A A (3)
Re-arranging eq. (3) as:
Figure 7. Comparison of the limiting pressure ratios
2 2
si s2
s si s s2
p s2 si
si si
s2
(1 ) (1 )
1
A P
M M
P A P
A P A γ γ + − + = − (4) where
s2 s si si s s2
π( , ) π( , )
P M
P M
γ γ
= (5)
(ss )
1 2 1 2
si s
si s2 si s
1 1 2 1 1 2 γ γ γ γ + − ⎧⎛ ⎞ ⎡ ⎛ − ⎞ ⎤⎫ ⎪ ⎪ = ⎨⎜ ⎟ ⎢ +⎜ ⎟ ⎥⎬ + ⎝ ⎠ ⎪⎝ ⎠⎣ ⎦⎪ ⎩ ⎭ A M
A M (6)
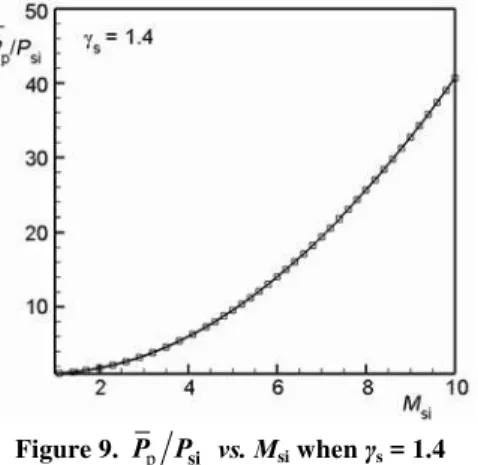
Figure 9 shows the variation of Pp Psiwith the increase of Msi when
γ
s=1.4. It is illustrated in fig. 9 that Pp Psi is a monotonically increasing function of Msi.When Msi increases, the slipline moves toward the symmetrical plane, and the cross-sectional
area of the primary flow between i and 2 increases. Since Psi is assumed unaltered and Pp is the average
static pressure of the primary flow between i and 2, an increase of Pp Psi can be obtained only when Ppi
increases. Therefore, the limiting pressure ratio of the CASSE increases with the increase of the sec-ondary Mach number.
Although the model proposed by Dutton, et al. shows good applicability in explaining the influence of the secondary Mach number, the theoretical value of (ξi)lim calculated by this model is much smaller
than (ξi)lim_01 and (ξi)lim_02, fig. 7. It is learned from
the fundamental of the aerodynamics that shock wave is inevitable when decelerating a supersonic flow, and the supersonic structures in the former part
of the mixing duct given in last section also show that, the strength of the shock waves in the secondary flow is fairly strong when ξi keeps near to the limiting condition. However, the
as-sumption of an isentropic compression of the secondary flow is used in the model proposed by Dutton, et al., the deviation of this assumption from the actual compression process of the su-personic flow results in a large underestimate of the limiting pressure ratio.
The pressure matching performance of the central CASSE
As for a supersonic ejector, there are two types of ejectors, namely the peripheral and central ejectors. Figure 10 illustrates the cross-sectional view of the mixing duct inlet for both the peripheral and central ejectors.
Figure 11 shows the comparison of the predicted limiting pressure ratios calculated by the model proposed by Dutton, et al. with the experimental results of the central CASSE (adapted from [9]). It is observed from fig. 11 that the experimental limiting pressure ratios of the central CASSE are smaller than the theoretical values, and this is just opposite for the pe-ripheral ones, fig. 7.
Figure 11. Comparison of the theoretical and experimental limiting pressure ratio of the central CASSE with Mpi = 2.5. (adapted from [9])
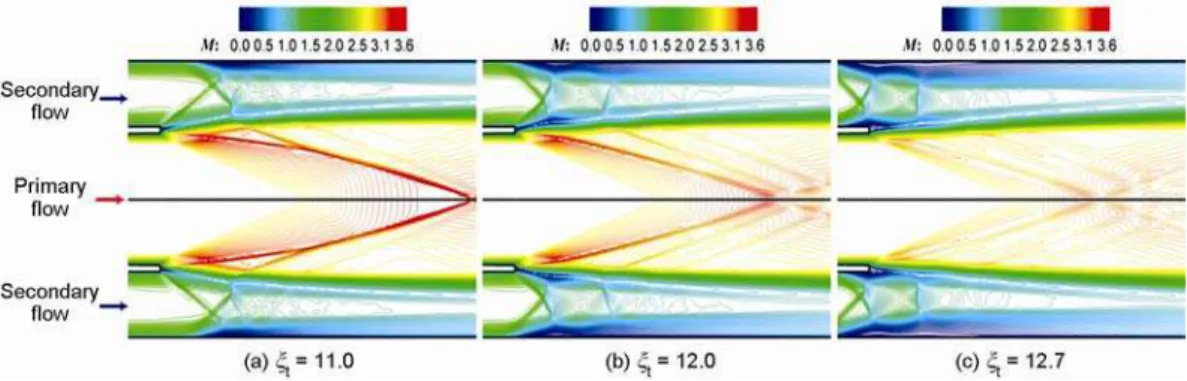
Figure 12 shows flow structures in former part of the mixing duct of a central CASSE (ejector 3 central CASSE) with different ξt, and ejector 3
central CASSE has the same inlet primary and secondary Mach numbers as ejector 3 peripheral CASSE lists in tab.1. It is observed from fig. 12(c) that the secondary flow separation occurs when ξt = 12.7, however, the secondary inlet of the ejector 3 peripheral CASSE is still
occu-pied by the complete supersonic secondary flow when ξt = 14.0, fig. 6(e).
Figure 12. Flow structures in the former part of the mixing duct of the ejector 3 central CASSE with different ξt(for color image see journal web-site)
The streamlines in the former part of the mixing duct of the central CASSE are shown in fig. 13. It is observed from fig.13 that a recirculation zone is formed because of the boundary layer separation, and this separation is induced by shock waves. The recircula-tion zone reduces the effective area of the secondary flow, and this results in a stronger compression of the secondary flow. Thus, the pressure gradient along the flow direction of the secondary flow increases. This means that the local back pressure of the secondary flow at the mixing duct inlet increases. Therefore, the pressure matching performance of the cen-tral CASSE is reduced by boundary layer separation induced by shock waves.
Figure 13. Streamlines in the former part of the mixing duct of the ejector 3 central CASSE
A modified model for predicting the limiting pressure ratio of the CASSE
Since the strength of shock waves in the secondary flow just downstream the mixing duct inlet is fairly strong when ξi keeps near to the limiting condition, the effect of the shock
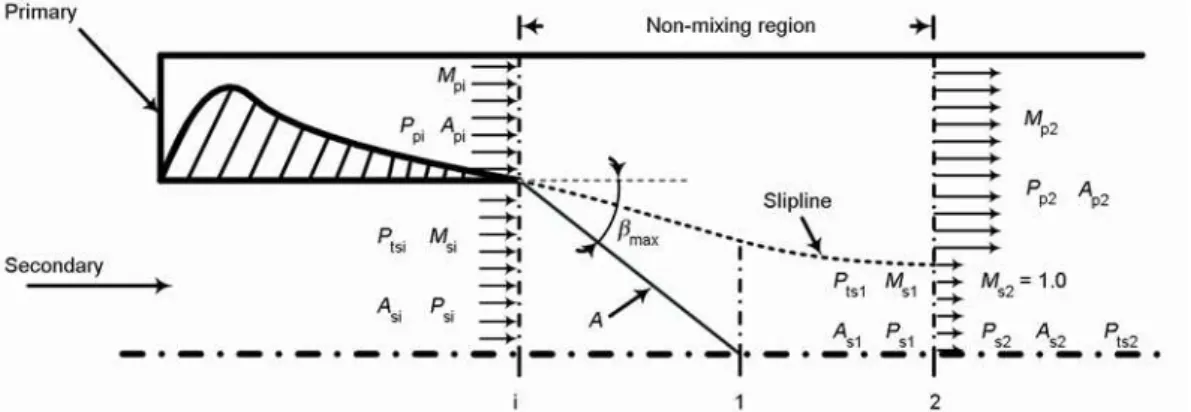
waves must be considered in the theoretical model for predicting the limiting pressure ratio. Figure 14 is a schematic of the flow field in concern.
Figure 14. Diagram of stations and nomenclature used in the theoretical analysis
When wall shear stresses are negligible, the momentum conservation equation can be applied to the primary and secondary flows as a whole control volume between stations i and 2. It is assumed that the mixing of the primary and secondary flows is negligible between stations i and 2, thus, the mass conservation equation can be applied to the primary and secondary flows, respectively. By applying the mass and momentum conservation equations together with the following assumptions, the limiting pressure ratio of the CASSE can be determined.
(1) The flow between stations i and 2 is steady, adiabatic and one-dimensional. (2) The working fluids are ideal gases with constant specific heat ratio, namely p and s.
(3) The primary and secondary flows are piecewise uniform at station i. (4) The static pressures are such that Ppi > Psi.
(5) The primary flow is isentropic between stations i and 2. (6) The secondary flow is choked at station 2.
(7) The secondary flow experiences an oblique shock wave A, the shock wave angle max is
(8) The oblique shock wave A affects only the properties of the secondary flow after station 1. (9) The secondary flow is uniform at station 1, and it is isentropic between stations 1 and 2. One consequence of assumption (7) is that the shock wave standing at the exit of isolator is a strong oblique shock wave. Of course, the true oblique shock wave induced by the turning angle is a weak one.
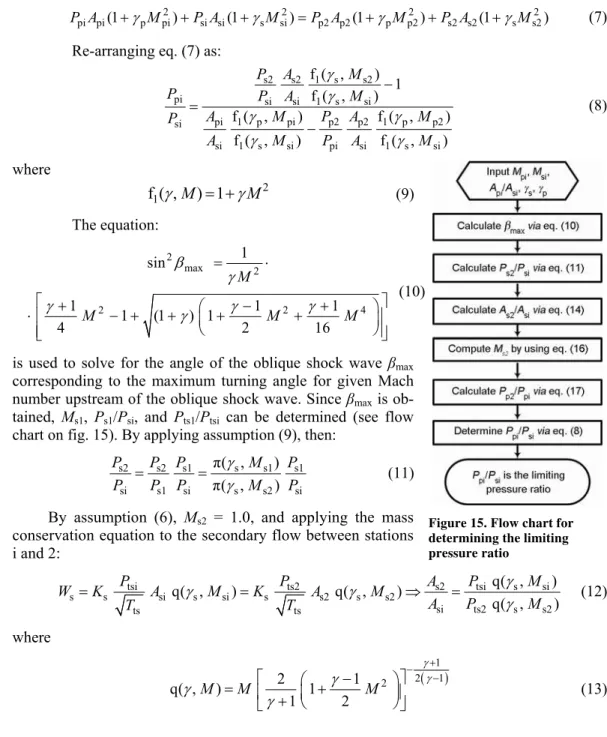
Applying the momentum conservation equation to the primary and secondary flows between stations i and 2 together with assumptions (1 and 3) yields:
2 2 2 2
pi pi(1 p pi) si si(1 s si) p2 p2(1 p p2) s2 s2(1 s s2)
P A +γ M +P A +γ M =P A +γ M +P A +γ M (7)
Re-arranging eq. (7) as:
s2 s2 1 s s2
pi si si 1 s si
pi 1 p pi p2 p2 1 p p2
si
si 1 s si pi si 1 s si
f ( , )
1
f ( , )
f ( , ) f ( , )
f ( , ) f ( , )
γ γ γ γ γ γ − = −
P A M
P P A M
A M P A M
P
A M P A M
(8)
where
2 1
f ( ,
γ
M) 1= +γ
M (9)The equation:
2
max 2
2 2 4
1 sin
1 1 1
1 (1 ) 1
4 2 16
M
M M M
= ⋅ ⎡ + ⎛ − + ⎞⎤ ⋅⎢ − + + ⎜ + + ⎟⎥ ⎝ ⎠ ⎢ ⎥ ⎣ ⎦ β γ
γ γ γ γ (10)
is used to solve for the angle of the oblique shock wave max
corresponding to the maximum turning angle for given Mach number upstream of the oblique shock wave. Since max is
ob-tained, Ms1, Ps1/Psi, and Pts1/Ptsi can be determined (see flow
chart on fig. 15). By applying assumption (9), then:
s2 s2 s1 s s1 s1
si s1 si s s2 si
π( , ) π( , )
P P P M P
P P P M P
γ γ
= = (11)
By assumption (6), Ms2 = 1.0, and applying the mass
conservation equation to the secondary flow between stations i and 2:
tsi ts2 s2 tsi s si
s s si s si s s2 s s2
si ts2 s s2
ts ts
q( , )
q( , ) q( , )
q( , )
γ
γ γ
γ
= P = P ⇒ A = P M
W K A M K A M
A P M
T T (12)
where
( 1) 2 1 2
2 1
q( , ) 1
1 2
M M M
γ γ γ γ γ + − − ⎡ ⎛ − ⎞⎤ = ⎢ ⎜ + ⎟⎥ + ⎝ ⎠
⎣ ⎦ (13)
According to assumption (9), Pts2 = Pts1, therefore: s2 tsi s si
si ts1 s
q( , )
q( , 1.0)
A P M
A P
γ γ
= (14)
The isentropic area ratio function is expressed as:
1 2( 1) 2
2 cr
1 1 2
1 f ( , )
2 1
A
M M
A M
γ γ
γ γ
γ
+ −
⎡⎛ − ⎞⎛ ⎞⎤
= ⎢⎜ + ⎟⎜ ⎟⎥ =
+
⎝ ⎠ ⎝ ⎠
⎣ ⎦ (15)
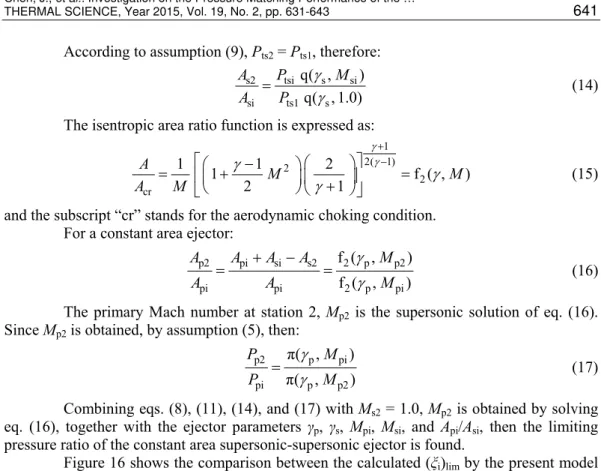
and the subscript “cr” stands for the aerodynamic choking condition. For a constant area ejector:
p2 pi si s2 2 p p2
pi pi 2 p pi
f ( , )
f ( , )
A A A A M
A A M
γ γ
+ −
= = (16)
The primary Mach number at station 2, Mp2 is the supersonic solution of eq. (16).
Since Mp2 is obtained, by assumption (5), then: p2 p pi
pi p p2
π( , ) π( , )
P M
P M
γ γ
= (17)
Combining eqs. (8), (11), (14), and (17) with Ms2 = 1.0, Mp2 is obtained by solving
eq. (16), together with the ejector parameters p, s, Mpi, Msi, and Api/Asi, then the limiting
pressure ratio of the constant area supersonic-supersonic ejector is found.
Figure 16 shows the comparison between the calculated (ξi)lim by the present model
and the model proposed by Dutton, et al. (ξi)lim_01 and (ξi)lim_02, which are used as the
bench-mark to estimate the precision of the theoretical value, are also given in fig. 16. It is observed from fig. 16 that the present model gives a superior agreement between the calculated (ξi)lim
and the experimental (ξi)lim_02 compared to the model proposed by Dutton, et al. Within the
range of parameters investigated in the current study, the calculated (ξi)lim by the present
el agrees well with the experimental (ξi)lim_02, especially when the primary Mach number is
relatively high. However, the calculated (ξi)lim by the present model is still 14-21% less than
(ξi)lim_01 when Mpi = 2.85, and 6-18% less than (ξi)lim_01 when Mpi = 3.2. This discrepancy may
be caused by the simplification of the complex and strong shock waves, and the ignorance of the complex physical phenomena, such as mixing of the primary and secondary flows, shock wave/mixing layer interaction, etc.
Conclusions
The interactions between the primary and secondary flow in a confined mixing duct have been investigated experimentally and numerically, the physical meaning of the pressure matching performance of the constant area supersonic-supersonic ejector has been clarified. Influences of the primary and secondary Mach numbers on the pressure matching perfor-mance of the ejectors have been examined, and the primary fluid injection configuration in ejectors has been studied as well. Based on the results of experiments and numerical simula-tions, a simplified analytical model has been proposed to predict the limiting pressure ratio of the constant area supersonic-supersonic ejector. From these investigations, we have come to the following conclusions.
● When the pressure ratio of the primary and secondary flows keeps near to the limiting condition, the complex shock wave structures are generated in the secondary flow, and these shock waves improve the pressure matching performance of the constant area super-sonic-supersonic ejector.
● The limiting pressure ratio of the constant area supersonic-supersonic ejector increases with the increase of the secondary Mach number, and this limiting pressure ratio decreas-es slightly with the increase of the primary Mach number.
● The pressure matching performance of the central constant area supersonic-supersonic ejector is lower than that of the peripheral one, and this is due to boundary layer separa-tion induced by shock wave in the central supersonic-supersonic ejector.
● By introducing a strong oblique shock wave into a previous isentropic compression mod-el, the gap between the theoretical value of the limiting pressure ratio and the experi-mental one is reduced from 30-35% to approximately 10%.
Acknowledgments
This work was supported by the National Natural Science Foundation of China (Grant No. 11172324). Also the authors are indebted to Dr. Wei Huang for his valuable sug-gestions when writing this paper.
Nomenclature
A – cross-sectional area, [m2]
M – Mach number [= V ( RT)–0.5], [–]
P – pressure, [Pa]
R – gas constant, [Jkg–1K–1]
T – temperature, [K]
V – velocity, [ms–1]
W – mass flow rate, [kgs–1]
Greek symbols
–oblique shock wave angle, [°]
– specific heat ratio, [–]
ξ – pressure ratio, [–]
Subscripts
i, 1, 2 – station i, 2 in fig. 2 and station i, 1, 2 in fig. 14
lim – limiting condition
max – maximum value
p – primary
s – secondary
t – stagnation condition
Abbreviations
CASSE – constant area supersonic-supersonic ejector
References
[1] Kumaran, R. M., et al., Optimization of Second Throat Ejectors for High-Altitude Test Facility, Journal of Propulsion and Power, 25 (2009), 3, pp. 697-706
[2] Nelson, K. W., Experimental Investigation of an Ejector Scramjet RBCC at Mach 4.0 and 6.5 Simulated
Flight Conditions, Ph. D. thesis, The University of Alabama, Huntsville, Ala., USA, 2002
[3] Zhu, Y. H., et al., Numerical Investigation of Geometry Parameters for Design of High Performance
Ejectors. Applied Thermal Engineering, 29 (2009), 5-6, pp. 898-905
[4] Singhal, G., et al., Pressure Recovery Studies on a Supersonic Coil with Central Ejector Configuration,
Optics & Laser Technology, 42 (2010), 7, pp.1145-1153
[5] Shwartz, J., et al., Tactical High-Energy Laser. Proceedings (Eds. S. Basu, J. F. Riker), Laser and Beam Control Technologies, San Jose, Cal., USA, 2002, Vol. 4632, pp. 10-20
[6] Zimet, E., Steady State and Transient Operation of an Ejector for a Chemical Laser Cold Flow Mixing
Experiment, Report No. TR 76-142, White Oak Laboratory, Md., USA, 1976
[7] Guile, R. N., US Patent, 4 379 679, 1983
[8] Mikkelsen, C. D., et al., Theoretical and Experimental Analysis of the Constant-Area, Supersonic-
-Supersonic Ejector, Report No. UILU-ENG-76-4003. University of Illinois at Urbana-Champaign, Ill., USA, 1976
[9] Dutton, J. C., et al., A Theoretical and Experimental Investigation of the Constant Area, Supersonic-
-Supersonic Ejector, AIAA Journal, 20 (1982), 10, pp. 1392-1400
[10]Dvorak, V., Safarik, P., Supersonic Flow Structure in the Entrance Part of a Mixing Chamber of 2D
Model Ejector, Journal of the Thermal Science, 12 (2003), 4, pp. 344-349
[11]Dvorak, V., Safarik, P., Transonic Instability in Entrance Part of Mixing Chamber of High-Speed
Ejec-tor, Journal of Thermal Science, 14 (2005), 3, pp. 258-271 [12]***, Fluent Inc., Fluent 6.3 User’s Guide, 2006
[13]Bartosiewicz, Y., et al., Numerical and Experimental Investigations on Supersonic Ejectors, Internation-al JournInternation-al of Heat and Fluid Flow, 26 (2005), 1, pp. 56-70
[14]Sriveerakul, T., et al., Performance Prediction of Steam Ejector Using Computational Fluid Dynamics,
Part 1, Validation of the CFD Results, International Journal of Thermal Sciences, 46 (2007), 8,
pp. 812-822