Submitted29 January 2016 Accepted 6 June 2016 Published6 July 2016 Corresponding author Nicholas A. Famoso, [email protected] Academic editor Laura Wilson
Additional Information and Declarations can be found on page 14
DOI10.7717/peerj.2181
Copyright 2016 Famoso and Davis Distributed under
Creative Commons CC-BY 4.0
OPEN ACCESS
On the relationship between enamel band
complexity and occlusal surface area in
Equids (Mammalia, Perissodactyla)
Nicholas A. Famoso and Edward Byrd Davis
Department of Geological Sciences, University of Oregon, Eugene, OR, United States Museum of Natural and Cultural History, University of Oregon, Eugene, OR, United States
ABSTRACT
SubjectsEvolutionary Studies, Paleontology, Statistics
Keywords Occlusal enamel complexity, Fractal dimensionality, Equidae, PGLS, Phylogeny, Body size, Tooth area, Evolution, Phylogenetic signal
INTRODUCTION
Dental morphology in ungulates has been a matter of great discussion with respect to phylogeny, diet, and habitat (Simpson,1951;Rensberger, Forsten & Fortelius,1984; Strömberg,2006;Heywood,2010;Kaiser et al.,2010;Damuth & Janis,2011). Equid dentition has been the focus of many studies as they are a modern taxon with deep phylogenetic roots and a rich fossil record of dental material (MacFadden,1998;Famoso & Davis,2014). A great deal of work has focused on hypsodonty (Strömberg,2006;Mihlbachler et al.,2011) and enamel microstructure (Pfretzschner,1993) but only recently has there been focus on quantifying occlusal enamel band complexity (Famoso, Feranec & Davis,2013;Famoso & Davis,2014;Famoso et al.,2016), chewing surface complexity utilizing the occlusal patch count (OPC) method (Evans & Janis,2014), and total content of enamel quantified as a percentage of the total tooth volume (Winkler & Kaiser,2015a;Winkler & Kaiser,2015b).
Hipparionini and Equini are sister tribes, derived from the Merychippine-grade that lies at the base of the Equinae (MacFadden,1998;Famoso & Davis,2014). The Hipparionini and Equini first appear in the middle Miocene. The Hipparionini become extinct in the Pleistocene while the Equini are extant (MacFadden,1998). Initially both tribes were present in North America and the Old World, with Hipparionini the more prevalent. For example, in the Clarendonian North American Land Mammal Age (Miocene; 12.5–9 Ma), there was a 3:1 relationship between individuals of the Hipparionini and Equini in the Great Plains region, despite similar generic diversity (Famoso & Pagnac,2011). By the Pleistocene, Hipparionini had dwindled to only two African genera. Equini currently consists of only one genus with eight species (Orlando et al.,2009;Vilstrup et al.,2013).
Several methods have been employed to quantify complexity of the occlusal surface in mammal teeth. Indentation index, a structural density parameter that quantifies the degree of folding of the enamel pattern (Schmidt-Kittler,1984), has been used in rodents (Schmidt-Kittler,2002) and bovids (Gailer & Kaiser,2014).Becerra et al.(2012) developed the enamel index which divides the length of enamel on the occlusal surface by occlusal surface area and applied it to the teeth of rodents. 3D methods, such as OPC and 3D-dental topometry, have also been employed to quantify the chewing surface topography of horse (Evans & Janis,2014), carnivoran, rodent (Evans et al.,2007), and bovid teeth (Winkler et al.,2013). 3D methods quantify the entire occlusal surface texture that is utilized in the mastication of food stuffs as opposed to 2D methods that are focused on quantifying the relative proportion of the hardest material in the tooth, the occlusal enamel bands.
Figure 1 Examples of fractal dimensionality (D), increasing in complexity from left to right.(A) Gen-eralized representations of a simple line; (B) Example trace of Equini P3 (MVZ 154358,Equus asinus); (C) Example trace of Hipparionini P3 (AMNH F:AM 71891,Cormohipparion quinni); (D) Generalized repre-sentations of a plane.
Figure 2 Fractal box counting method applied to a trace of the P3 ofEquus asinus(MVZ 154358). The method uses a series of boxes (blue) of varying sizes to break down a convoluted linear pattern. The count of boxes for each box size and the box size (pixels) are then logged and a straight, fitted line is applied. The slope of this line is the inverse of the fractal dimensionality (D;Smith, Lange & Marks,1996).
scaling.Famoso, Feranec & Davis(2013) andFamoso & Davis(2014) proposed investigating other measures of complexity which were known to be independent of scaling, namely fractal dimensionality (Mandelbrot,1983). Nonetheless, both studies identified a significant relationship of phylogeny, diet, and tooth position on enamel complexity.Famoso & Davis (2014) found major differences in enamel complexity among the four major groups of horses (‘‘Anchitheriinae,’’Merychippus-grade, Hipparionini, and Equini) present in the middle Miocene to Recent. Of those four, Hipparionini had the highest complexity, while Equini had the second-highest.
The smaller the size of the box, the more boxes are required to fill the area. The fractal dimension is calculated from the sinuosity of the line within each box. The curviness and the number of lines are used in tandem to calculate fractal dimensionality. The scalable nature of the fractal dimension will assist in removing the effects of body size from studies of tooth complexity (Gibert & Palmqvist,1995;Famoso, Feranec & Davis,2013).
Previously, fractal dimensionality has been used to identify taxa from suture patterns of mammalian skulls (Gibert & Palmqvist,1995) and to investigate the evolution of suture morphology, structural functionality, and the relationship between metabolism and suture complexity in ammonites (Lutz & Boyajian,1995;Pérez-Claros, Palmqvist & Olóriz,2002; Pérez-Claros,2005). Fractal dimensionality has been successfully used in quantifying the occlusal enamel band complexity of giant caviomorph rodents (Candela, Cassini & Nasif,2013) and proboscideans (Stone & Telford,2005) but has not yet been applied to hypsodont equids.Stone & Telford(2005) quantified enamel ridge complexity with fractal dimensionality to identify different proboscidean taxa which verified the qualitative results of Cuvier which were made over 200 years prior to their study (Cuvier,1769;Cuvier,1799). Candela, Cassini & Nasif(2013) focused on a single enamel crest on the lower dentition ofEumegamys paranensisand found that complexity is most likely related to functional stresses from the masticatory cycle.Candela, Cassini & Nasif(2013) also concluded that the dentition ofE.paranensisis superficially more convoluted than that of proboscideans, a conclusion which speaks to the utility ofDwhen comparing taxa of disparate body masses. Kaiser(2002) found that thin enamel band plications do not contribute to shearing of the food, but have another undetermined biomechanical function in the hipparionin equid Cormohipparion occidentale. Fractals have also been applied to quantifying shape and dental ecology and have been specifically applied to dental microwear using scale-sensitive fractal analysis and dental microwear texture analysis (Evans,2013;DeSantis et al.,2013).
Questions and hypotheses
dimensions, it will wear enough that it will no longer effectively protrude above the dentin (Kaiser,2002). Consequently, larger teeth can support more complexity with enamel bands above this threshold. We also expect there to be a different relationship between the two tribes, with Hipparionini being more complex.
METHODS
We took scaled (centimeter), oriented digital photographs of the occlusal surface of fossil and modern equid dentitions. Photographs were taken with a Kodak DC290 (1,792×1,200 pixels; 72 dpi) and Olympus Stylus Tough (3,648×2,736 pixels; 314 dpi) cameras. We selected specimens which were in medial stages of wear (no deciduous premolars or teeth in extreme late stages of wear). Skulls and complete to nearly complete tooth rows were preferred because we can be more confident in taxonomic identification and tooth position. Isolated teeth were also included when more complete tooth-rows were not available for a taxon. Original photos were saved as jpegs.
We digitally traced 98 teeth by hand using a mouse and a Wacom Graphire3 USB tablet on original jpeg images in AdobeR IllustratorR CS5 version 15.0.2 producing TIFF files for fractal analysis. Only one tooth per individual was traced (Fig. 3). The preference was for P3, but if not available the next complete tooth between P3-M2 was measured. The sample comprised 31 Hipparionini and 67 Equini teeth representing 35 species (Table 1). Famoso & Davis(2014) found that all teeth in the tooth row, with the exception of the P2 and M3, had statistically similar occlusal enamel band complexity for equids. As a result, we restricted this analysis to the P3-M2 to reduce any effects from tooth position on the analysis; however, a majority of the specimens were P3s (Supplemental Information 1).
We calculatedDon the traces using the fractal box count method in the ij.plugin.filter package (class FractalBoxCounter) in the NIH image analysis program ImageJ version 1.45 for Windows (http://rsb.info.nih.gov/ij/). The fractal box counting method in ImageJ counts the number of boxes of a given size needed to cover a binary border that is one pixel wide and is repeated for boxes that are 2–64 pixels wide (Smith, Lange & Marks,1996). A straight, fitted line is then applied to the log of size (pixel width) versus the log of the box count and the slope of that line is the inverse of the fractal dimension,D(Smith, Lange & Marks,1996). The box counting method only looks at the exterior edges of the occlusal enamel bands so occlusal enamel band thickness is not considered with this method and is not considered to influenceD. True occlusal surface area of the tooth was collected from Famoso & Davis(2014). True occlusal surface area is defined as the two-dimensional area constructed as a polygon following the outer edge of the occlusal surface, including any cementum that may exist outside of the enamel, where cementum on the lingual side is part of the occlusal surface while that on the buccal is not (Famoso & Davis,2014).
Figure 3 Representative photos and traces of Hipparionini and Equini taxa.(A) Photograph of the P3 of the EquiniEquus caballus(UOMNH B-9092); (B) Trace of the P3 of the EquiniEquus caballus
(UOMNH B-9092); (C) Photograph of the P3 of the Hipparionini ‘‘Neohipparion’’ republicanus(UNSM 84000); (D) Trace of the P3 of the Hipparionini ‘‘Neohipparion’’republicanus(UNSM 84000). Scale bars equal 1 cm.
Table 1 Summary of species analyzed in this study and species averaged fractal dimensionality (D) and occlusal tooth area (cm2).
Tribe Genus and species n(D) Mean (D) SD (D) n(area) Mean (area) SD (area)
Equini Calippus placidus 2 1.5180 0.0891 2 2.0815 0.0629
Equini Calippussp. 1 1.3580 NA 1 3.6030 NA
Equini Equus asinus 1 1.2290 NA 1 5.1590 NA
Equini Equus caballus 4 1.4373 0.0549 4 7.5205 1.6367
Equini Equus calobutus 4 1.3223 0.0714 4 7.2530 1.9051
Equini Equus complicatus 1 1.4050 NA 1 6.0810 NA
Equini Equus conversidens 1 1.3270 NA 1 5.3290 NA
Equini Equus excelsus 4 1.3810 0.0879 3 6.6210 1.1453
Equini Equus fraternus 1 1.3030 NA 1 8.7110 NA
Equini Equus grevyi 1 1.2760 NA 1 7.5950 NA
Equini Equus idahoensis 6 1.3293 0.0418 5 6.5108 0.7770
Equini Equus occidentalis 1 1.4240 NA 1 8.2630 NA
Equini Equus quagga 4 1.2483 0.0176 4 5.6980 0.4205
Equini Equus scotti 7 1.3453 0.0598 7 6.8604 1.7839
Equini Equus simplicidens 13 1.3949 0.0330 9 7.8007 1.6641
Equini Equussp. 5 1.3266 0.0221 5 5.2488 0.5808
Equini Equusspp. 4 1.3075 0.0076 4 6.0648 0.5734
Equini Pliohippus mirabilis 1 1.4010 NA 0 NA NA
Equini Pliohippus pernix 1 1.4000 NA 1 3.8970 NA
Equini Pliohippussp. 1 1.3980 NA 1 5.2170 NA
Equini Protohippus perditus 2 1.3870 0.0170 2 3.3080 0.0198
Equini Protohippussp. 2 1.3880 0.0523 2 3.0135 0.5211
Hipparionini Cormohipparion goorisi 1 1.4150 NA 1 3.8000 NA
Hipparionini Cormohipparion ingenuus 1 1.3170 NA 1 3.1690 NA
Hipparionini Cormohipparion occidentale 4 1.3493 0.0326 4 4.3823 1.3176
Hipparionini Cormohipparion quinni 1 1.4450 NA 1 4.5870 NA
Hipparionini ‘‘Cormohipparion’’sphenodus 1 1.4270 NA 1 5.3150 NA
Hipparionini Neohipparion affine 5 1.4334 0.0821 5 3.6038 0.9205
Hipparionini Neohipparion eurystyle 2 1.3520 0.0764 2 4.0775 0.0700
Hipparionini Neohipparion leptode 1 1.4200 NA 1 4.2290 NA
Hipparionini ‘‘Neohipparion’’republicanus 3 1.4593 0.0577 3 3.4333 0.4258
Hipparionini Neohipparionsp. 5 1.4622 0.0905 5 3.9066 0.7120
Hipparionini Pseudhipparion gratum 2 1.3715 0.0445 0 NA NA
Hipparionini Pseudhipparionsp. 4 1.4600 0.1061 4 3.3113 0.3720
Hipparionini gen.etsp. indet. 1 1.4850 NA 1 3.0090 NA
Notes.
NA, no value;n, number of specimens; SD, standard deviation.
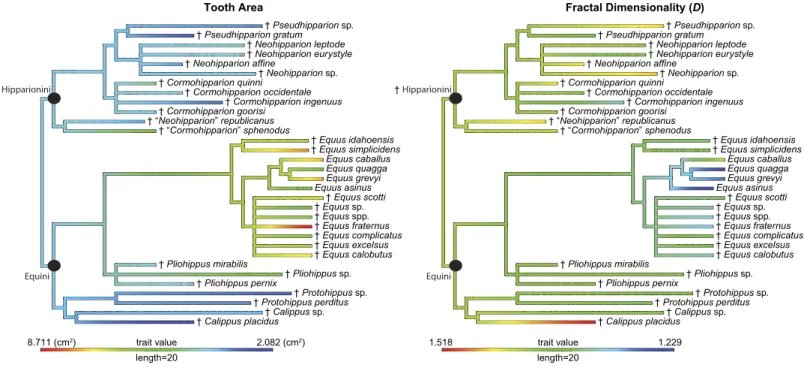
of MacFadden(1998),Kelly(1998),Hulbert(1993), andOrlando et al.(2009) (Fig. 4;
Figure 4 Phylogeny used in this study with continuous characters, tooth area and fractal dimensionality (D), mapped onto the tree.This tree is a time-scaled (Ma) informal supertree. Characters were mapped using the contMap function in the phytools package version 0.4–45 (Revell,2012) implemented in R. Length refers to the length of the legend in units of branch length.†=extinct taxon.
Table 2 t-test results for fractal dimensionality (D) versus Tribe-level affiliations.
t-value Degrees of freedom p-value Equini mean Hipparionini mean
–4.502 62.073 <0.0001 1.359 1.430
are default. The first and last occurrences used to time calibrate the tree were collected from the Paleobiology Database (http://paleobiodb.org/) on September 9, 2015 (Supplemental Information 3). Analyses were run on the two tribes independently of one another and on a unified tree of the tribes. Raw data and R code are presented inSupplemental Information 1and4.
RESULTS
Figure 5 Results of our phylogenetic generalized least square regression (PGLS) for fractal dimentionality (D) and occlusal tooth area (cm2) for the Equid tribes Hipparionini and Equini.Thep-value for the Hipparionini regression is not significant.
Table 3 Summary statistics for three PGLS regressions for fractal dimensionality (D) versus occlusal surface area.
λ Lower 95% CI Upper 95% CI Slope Standard error t-value p-value MultipleR2 AdjustedR2
Hipparionini 0 NA NA 0.0134 0.0187 0.7146 0.4912 0.0486 –0.0466
Equini 0 NA 0.935 –0.0159 0.0071 –2.2299 0.0176 0.1991 0.1591
Equinae 0 NA 0.832 –0.0196 0.0063 –3.1209 0.0040 0.2451 0.2199
Notes.
NA, no value; CI, confidence interval.
Table 4 Phylogenetic signal in fractal dimensionality (D) and occlusal tooth area for the equid tribes Hipparionini and Equini.
HipparioniniD Hipparionini area EquiniD Equini area EquinaeD Equinae area
λ 0.000 NA 0.505 0.800 0.462 0.747
Upper 95% CI NA NA 0.960 NA 0.886 0.995
Lower 95% CI NA NA NA 0.389 0.080 0.389
Notes.
NA, no value; CI, confidence interval.
are independently tested (Table 4). Because the analysis returned NA values for the occlusal surface area of Hipparionini, the sample size must be too small to calculate phylogenetic signal for either character (Table 4).
DISCUSSION
Dfor the Equini, and an equivocal relationship for the Hipparionini. We cannot reject the hypothesis that the Hipparionini have the same slope as the Equini, but the data are so scattered that we are circumspect in our interpretation of them. At least for Equini, as the chewing surfaces of their teeth become larger,Ddecreases. This correlation is intriguing, because previous work has shown a positive correlation between occlusal enamel length and occlusal surface area of the tooth in all equids (Famoso, Feranec & Davis,2013), which suggested an increase in occlusal enamel band complexity with body size. Thus, we can see that the body-size scaling of the occlusal enamel band length was obfuscating the underlying pattern of occlusal enamel band complexity: future studies need to use scale-independent measures of complexity likeDto avoid this problem. The similar pattern of decreased occlusal enamel band length with increased tooth area is observed in the bovid genus Myotragus(Winkler et al.,2013), suggesting that the relationship between occlusal enamel band morphology and tooth area may reflect selective pressure on increased efficiency in food processing with larger body mass operating across ungulates and not simply in equines. Alternatively, it is possible that the relationship between these two variables is controlled by developmental forces, because the dental wear properties of the tooth are mediated by the action of enamel organs during tooth development. A negative correlation between tooth area and occlusal enamel band complexity could be caused by, for example, an upper limit on the volume-filling convolutions possible in enamel organ growth and enamel/dentine production. If the observed pattern is governed by constraint in tooth development, it could be possible that the complexity-area relationship would change with wear state, because the wear states sample different stages of tooth ontogeny. Because we carefully controlled the wear stage of the specimens included in this analysis, we cannot address that possibility here. It would be informative to follow up with a longitudinal study of a single modern population or sample individuals from all age groups in a single fossil population and study whether this occlusal enamel band complexity-area relationship holds through a lifetime of tooth wear.
It is difficult to construct a scenario where selection on occlusal enamel band complexity drives body size if the two characters are negatively correlated.Famoso, Feranec & Davis (2013) showed a positive correlation between enamel band complexity (measured using OEI) and increased grazing diet in extinct and extant ungulates. If changing diets were the primary driver of horse evolution from the Miocene to Recent, body size change could be a spandrel of selection (sensuGould & Lewontin,1979) on optimal occlusal enamel band complexity. Because we have not yet explored the relationship between diet category and occlusal enamel band complexity measured usingD, we cannot sensibly speculate on the relationship here.
Horses were transitioning from a browsing to a grazing diet through the Miocene to Recent (MacFadden,2005), but most work has assumed that with opening habitats, large body size was selected for optimal foraging across large distances (e.g.,Janis,1993;Smith et al.,2010;Mihlbachler et al.,2011). If this were so, one would expect the selection on body size to have driven a decrease in occlusal enamel band complexity over time. Future work will need to parse out the relative roles of changes in body size and diet in the evolution of resistance to tooth wear. As a first step, it would be worth investigating the complexity-diet relationship in horses usingDonce proper dietary reconstructions can be calculated for an appropriate sample of taxa. As dietary reconstructions have only been calculated on a small number of the taxa sampled in this study, we were unable to address the relationship among body size, diet, and occlusal enamel band complexity measured usingD.
Hipparionini and Equini do not have a significantly different relationship between occlusal enamel band complexity and occlusal surface area, but the line of the Hipparionini regression is shifted upward: this lineage features consistently more complex occlusal enamel bands, a qualitative difference first noted byQuinn(1955) when he erected the two tribes. As such, the Hipparionini and Equini express distinct dental morphological solutions, with hipparionines producing higher enamel band complexity and equines producing teeth with greater hyposodonty. In this way, the two clades were able to accommodate the dental wear induced by foraging in open habitats of both the New and Old Worlds (MacFadden, Solounias & Cerling,1999;Passey et al.,2002;Maguire & Stigall,2008;Uno et al.,2011; Famoso & Davis,2014;Loffredo & Desantis,2014).
similar three dimensional chewing surface complexity between both tribes, this metric is the result of wear more so than enamel band complexity, pointing to a different aspect of evolving ecology. The processes behind the eventual extinction of the Hipparionini and persistence of the Equini are currently unclear, but our investigation of the differences in their occupation of enamel band complexity space provides an important insight.Maguire & Stigall(2009) found that niche partitioning and the fluctuation of niches across North America were a factor affecting the relative success of these two tribes over time, suggesting that climate change may have been a major driver in the dynamic relative abundance of the two tribes and the extinction of Hiparionini.
Fractal dimensionality has shown great utility for investigating tooth enamel band complexity (Stone & Telford,2005;Candela, Cassini & Nasif,2013), but has promise for several other lines of investigation. This tool alleviates the effects of allometric scaling, allowing a more nuanced investigation of the evolution of enamel band complexity in any setting (e.g.,Gibert & Palmqvist,1995;Stone & Telford,2005;Candela, Cassini & Nasif, 2013). Other potential applications include applyingDto the lateral profiles of carnivore dentition in the context of feeding ecology and evolutionary relationships, or to quantify the overall complexity of an entire community of herbivores. Crabeater seals (Lobodon carcinophaga) have a complex lateral dental profile as a response to feeding on Antarctic krill (Adams,2005), and would have higherDvalues than other Antarctic marine carnivorans (e.g., leopard seals (Hydrurga leptonyx)). An analysis ofDwould be complementary to other analyses which used OPC to infer dietary ecology of carnivorans from the occlusal surface topography (Evans et al.,2007).
ApplyingDto an entire mammalian herbivore community could allow one to investigate the relationship between diet and occlusal enamel band complexity between sites and to potentially tease out niche partitioning within a site or group of sites. For instance, communities of herbivores with higherDvalues would be expected in localities where microwear and isotopic analysis predict grazing diets. Within a community, browsing taxa would be expected to have a lower enamel band complexity than grazing taxa, allowing for a first order assessment of diet. An averageDvalue for each site could be calculated and then compared, orDcould be calculated for each species in a site and compared.
enamel band complexity. The size difference between the two tribes, then, can entirely explain their difference in occlusal enamel band complexity. This difference in complexity reflects divergence between the two lineages since their last common ancestor and suggests the two tribes differentiated by exploring different parts of the ecomorphospace, with Hipparionini maintaining smaller size, more complex occlusal enamel banding, and lower hypsodonty, while the Equini maintained larger size, less complex occlusal enamel banding, and higher hypsodonty (hypsodonty explored inFamoso et al.,2016). There is strong phylogenetic signal for bothDand occlusal surface area independently; however, there is no phylogenetic signal for the relationship betweenDand occlusal surface area. Equids have a strong correlation between occlusal surface area and enamel band complexity, and tribe-level differences in this relationship may have constrained their ability to respond to environmental change over the Neogene, leading to the differential survival of the Equini.
Institutional Abbreviations
AMNH F:AM Frick Collection, American Museum of Natural History, New York City, New York, USA
MVZ University of California Museum of Vertebrate Zoology, Berkeley, California, USA
UCMP University of California Museum of Paleontology, Berkeley,
California, USA
UF University of Florida Museum of Natural History, Gainesville,
Florida, USA
UNSM University of Nebraska State Museum, Lincoln, Nebraska, USA
UOMNH University of Oregon Museum of Natural and Cultural History, Eugene, Oregon, USA
USNM United States National Museum of Natural History, Smithsonian
Institute, Washington, District of Columbia, USA
ACKNOWLEDGEMENTS
ADDITIONAL INFORMATION AND DECLARATIONS
Funding
Funding for this project was provided by the University of Oregon Museum of Natural and Cultural History, Paleontological Society Richard K. Bambach Award, and Geological Society of America Graduate Student Grant. Some photographs were taken by RS Feranec who was funded by the Museum of Vertebrate Zoology, University of California Museum of Paleontology, University of California, Berkeley Department of Integrative Biology, the Society of Vertebrate Paleontology, and NSF DDIG 0308770. The funders had no role in study design, data collection and analysis, decision to publish, or preparation of the manuscript.
Grant Disclosures
The following grant information was disclosed by the authors: University of Oregon Museum of Natural and Cultural History. Paleontological Society Richard K. Bambach Award.
Geological Society of America Graduate Student. Museum of Vertebrate Zoology.
University of California Museum of Paleontology.
University of California, Berkeley Department of Integrative Biology. Society of Vertebrate Paleontology.
NSF: DDIG 0308770.
Competing Interests
The authors declare there are no competing interests.
Author Contributions
• Nicholas A. Famoso conceived and designed the experiments, performed the experiments, analyzed the data, wrote the paper, prepared figures and/or tables, reviewed drafts of the paper.
• Edward Byrd Davis contributed reagents/materials/analysis tools, wrote the paper, reviewed drafts of the paper.
Data Availability
The following information was supplied regarding data availability: The raw data has been supplied as aSupplemental Dataset.
Supplemental Information
Supplemental information for this article can be found online athttp://dx.doi.org/10.7717/ peerj.2181#supplemental-information.
REFERENCES
Adams PJ. 2005.Lobodon carcinophaga.Mammalian Species772:1–14
Bapst DW. 2012.paleotree: an R package for paleontological and phylogenetic analyses of evolution.Methods in Ecology and Evolution3:803–807
DOI 10.1111/j.2041-210X.2012.00223.x.
Becerra F, Vassallo AI, Echeverría AI, Casinos A. 2012.Scaling and adaptations of incisors and cheek teeth in caviomorph rodents (Rodentia, Hystricognathi).Journal of Morphology273:1150–1162DOI 10.1002/jmor.20051.
Bruno OM, Plotze RdO, Falvo M, De Castro M. 2008.Fractal dimension applied to plant identification.Information Science178:2722–2733DOI 10.1016/j.ins.2008.01.023. Candela AM, Cassini GH, Nasif NL. 2013.Fractal dimension and cheek teeth crown
complexity in the giant rodentEumegamys paranensis.Lethaia46:369-377
DOI 10.1111/let.12015.
Cuvier G. 1769.Lecons D’anatomie Comparée. v. 5. Paris: Baudouin Press.
Cuvier G. 1799.Mémoire sur les espèces d’éléphans vivantes et fossiles.Mémoires de L’institute (Classique Du Mathématique et Physique)2:1–22.
Damuth J, Janis CM. 2011.On the relationship between hypsodonty and feeding ecology in ungulate mammals, and its utility in palaeoecology.Biological Reviews86:733–758
DOI 10.1111/j.1469-185x.2011.00176.x.
DeSantis L, Scott JR, Schubert BW, Donohue SL, McCray BM, Van Stolk CA, Winburn AA, Greshko MA, O’Hara MC. 2013.Direct comparisons of 2D and 3D dental microwear proxies in extant herbivorous and carnivorous mammals.PLoS ONE 8(8):e71428DOI 10.1371/journal.pone.0071428.
Evans AR. 2013.Shape descriptors as ecometrics in dental ecology.Hystrix, the Italian Journal of Mammalogy 24(1):133–140DOI 10.4404/hystrix-24.1-6363.
Evans AR, Janis CM. 2014.The evolution of high dental complexity in the horse lineage. Annales Zooligici Fennici51(1–2):73–79DOI 10.5735/086.051.0209.
Evans AR, Wilson GP, Fortelius M, Jernvall J. 2007.High-level similarity of dentitions in carnivorans and rodents.Nature445:78–81DOI 10.1038/nature05433.
Famoso NA, Davis EB. 2014.Occlusal enamel complexity in middle Miocene to Holocene Equids (Equidae: Perrisodactyla) of North America.PLoS ONE 9(2):e90184DOI 10.1371/journal.pone.0090184.
Famoso NA, Davis EB, Feranec RS, Hopkins SSB, Price SA. 2016.Are hypsodonty and occlusal enamel complexity evolutionarily correlated in ungulates?Journal of Mammalian Evolution23(1):43–47DOI 10.1007/s10914-015-9296-7.
Famoso NA, Feranec RS, Davis EB. 2013.Occlusal enamel complexity and its im-plications for lophodonty, hypsodonty, body mass and diet in extinct and ex-tant ungulates.Palaeogeography, Palaeoclimatology, Palaeoecology387:211–216
DOI 10.1016/j.palaeo.2013.07.006.
Famoso NA, Pagnac DC. 2011.A comparison of the Clarendonian equid assemblages from the Mission Pit, South Dakota and Ashfall Fossil Beds, Nebraska.Transactions of the Nebraska Academy of Sciences32:98–107.
Feder J. 1988.Fractals. New York: Plenum Press.
Gailer J-P, Kaiser TM. 2014.Common solutions to resolve different dietary challenges in the ruminant dentition: the functionality of bovid postcanine teeth as a masticatory unit.Journal of Morphology275(3):328–341DOI 10.1002/jmor.20217.
Gibert J, Palmqvist P. 1995.Fractal analysis of the orce skull sutures.Journal of Human Evolution28:561–575DOI 10.1006/jhev.1995.1042.
Gould SJ, Lewontin RC. 1979.The spandrals of San Marco and the Panglossian
Paradigm: a critique of the adaptationist programme.Proceedings of the Royal Society of London B205:581–598DOI 10.1098/rspb.1979.0086.
Grafen A. 1989.The phylogenetic regression.Philosophical Transactions of the Royal Society B326:119–157DOI 10.1098/rstb.1989.0106.
Harvey PH, Pagel MD. 1991.The comparative method in evolutionary biology. Oxford: Oxford University Press.
Heywood JJN. 2010.Functional anatomy of bovid upper molar occlusal surfaces with respect to diet.Journal of Zoology281:1–11DOI 10.1111/j.1469-7998.2009.00668.x. Hulbert RC. 1993.Taxonomic evolution in North American neogene horses (subfamily
Equinae): the rise and fall of an adaptive radiation.Paleobiology19:216–234. Janis CM. 1993.Tertiary mammal evolution in the context of changing climates,
vege-tation, and tectonic events.Annual Review of Ecology and Systematics24:467–500
DOI 10.1146/annurev.es.24.110193.002343.
Kaiser TM. 2002.Functional significance of ontogenetic gradients in the enamel ridge pattern of the upper cheek dentition of the miocene hipparionin horse Cormohippar-ion occidentale(Equidae, Perissodactyla).Senckenbergiana Lethaea82(1):167–180
DOI 10.1007/BF03043782.
Kaiser TM, Fickel J, Streich WJ, Hummel J, Clauss M. 2010.Enamel ridge alignment in upper molars of ruminants in relation to their diet.Journal of Zoology81:12–25
DOI 10.1111/j.1469-7998.2009.00674.x.
Kelly TS. 1998.New middle Miocene equid crania from California and their implications for the phylogeny of the Equini.Contributions in Science, Natural History Museum of Los Angeles County473:1–43.
Loffredo LF, DeSantis LRG. 2014.Cautionary lessons from assessing dental mesowear observer variability and integrating paleoecological proxies of an extreme gener-alistCormohipparion emsliei.Palaeogeography, Palaeoclimatology, Palaeoecology 395:42–52DOI 10.1016/j.palaeo.2013.12.020.
Lutz TM, Boyajian GE. 1995.Fractal geometry of ammonoid sutures.Paleobiology 21(3):329–342DOI 10.1017/S0094837300013336.
MacFadden BJ. 1998. Equidae. In: Janis CM, Scott KM, Jacobs LL, eds.Evolution of tertiary mammals of North America. vol. 1. New York: Cambridge University Press, 537–559.
MacFadden BJ. 2005.Fossil horses—evidence for evolution.Science307:1728–1730
DOI 10.1126/science.1105458.
MacFadden BJ, Solounias N, Cerling TE. 1999.Ancient diets, ecology, and extinc-tion of 5-million-year-old horses from Florida.Science283(5403):824–827
Maguire KC, Stigall AL. 2008.Paleobiogeography of Miocene Equinae of North America: a phylogenetic biogeographic analysis of the relative roles of climate, vicariance, and dispersal.Palaeogeography, Palaeoclimatology, Palaeoecology267:175–184
DOI 10.1016/j.palaeo.2008.06.014.
Maguire KC, Stigall AL. 2009.Using ecological niche modeling for quantitative biogeo-graphic analysis: a case study of Miocene and Pliocene Equinae in the Great Plains. Paleobiology 35(4):587–61DOI 10.1666/0094-8373-35.4.587.
Mandelbrot BB. 1983.The fractal geometry of nature. New York: W. H. Freeman and Co. Mihlbachler MC, Rivals F, Solounias N, Semperbon GM. 2011.Dietary change and
evolution of horses in North America.Science331:1178–1181
DOI 10.1126/science.1196166.
Orlando L, Metcalf JL, Alberdi MT, Telles-Antunes M, Bonjean D, Otte M, Martin F, Eisenmann V, Mashkour M, Morello F, Prado JL, Salas-Gismondi R, Shockey BJ, Wrinn PJ, Vasil’ev SK, Ovodov ND, Cherry MI, Hopwood B, Male D, Austin JJ, Hänni C, Cooper A. 2009.Revising the recent evolutionary history of equids using ancient DNA.Proceedings of the National Academy of Sciences of the United States of America106(51):21754–21759DOI 10.1073/pnas.0903672106.
Orme D, Freckleton R, Thomas G, Petzoldt T, Fritz S, Nick I. 2011.Caper: comparative analyses of phylogenetics and evolution in R. R package version 0.4.Available at http:// CRAN.R-project.org/ package=caper.
Pagel M. 1997.Inferring evolutionary processes from phylogenies.Zoologica Scripta 26:331–348DOI 10.1111/j.1463-6409.1997.tb00423.x.
Passey BH, Cerling TE, Perkins ME, Voorhies MR, Harris JM, Tucker ST. 2002. Environmental change in the great plains: an isotopic record from fossil horses.The Journal of Geology110(2):123–140DOI 10.1086/338280.
Pérez-Claros JA. 2005.Allometric and fractal exponents indicate a connection be-tween metabolism and complex septa in ammonites.Paleobiology31(2):221–232
DOI 10.1666/0094-8373(2005)031[0221:AAFEIA]2.0.CO;2.
Pérez-Claros JA, Palmqvist P, Olóriz F. 2002.First and second orders of suture complexity in ammonites: a new methodological approach using fractal analysis. Mathematical Geology34(3):323–343DOI 10.1023/A:1014847007351.
Pfretzschner HU. 1993.Enamel microstructure in the phylogeny of the Equidae.Journal of Vertebrate Paleontology13:342–349DOI 10.1080/02724634.1993.10011514. Quinn JH. 1955.Miocene Equidae of the Texas Gulf Coastal Plain. Publication number
5516. Austin: University of Texas, 1–102.
R Core Team. 2013.R: a language and environment for statistical computing. Vienna: R Foundation for Statistical Computing. URL http:// www.R-project.org/.
Rensberger JM, Forsten A, Fortelius M. 1984.Functional evolution of the cheek tooth pattern and chewing direction in tertiary horses.Paleobiology 10:439–452.
Revell LJ. 2012.Phytools: an R package for phylogenetic comparative biology (and other things).Methods in Ecology and Evolution3:217–223
DOI 10.1111/j.2041-210X.2011.00169.x.
Schmidt-Kittler N. 1984.Pattern analysis of occlusal surfaces in hypsodont herbivores and its bearing on morpho-functional studies.Proceedings of the Koninklijke Nederlandse Akademie van Wetenschappen87(4):453–480.
Schmidt-Kittler N. 2002.Feeding specializations in rodents.Senckenbergiana Lethaea 82(1):141–152DOI 10.1007/BF03043780.
Simpson GG. 1951.Horses: the horse family in the modern world and through sixty million years of history. New York: Oxford University Press.
Smith FA, Boyer AG, Brown JH, Costa DP, Dayan T, Ernest SKM, Evans AR, Fortelius M, Gittleman JL, Hamilton MJ, Harding LE, Lintulaakso K, Lyons SK, McCain C, Okie JG, Saarinen JJ, Sibly RM, Stephens PR, Theodor J, Uhen MD. 2010.The evo-lution of maximum body size of terrestrial mammals.Science330(6008):1216–1219
DOI 10.1126/science.1194830.
Smith TG, Lange GD, Marks WB. 1996.Fractal methods and results in cellular morphology—dimensions, lacunarity and multifractals.Journal of Neuroscience Methods69(2):123–136DOI 10.1016/S0165-0270(96)00080-5.
Stone J, Telford M. 2005.Fractal dimensions characterizing mammal teeth: a case study involving Elephantidae.Mammal Review35:123–128
DOI 10.1111/j.1365-2907.2005.00054.x.
Strömberg CAE. 2006.Evolution of hypsodonty in Equids: testing a hypothesis of adaptation.Paleobiology 32:236–258
DOI 10.1666/0094-8373(2006)32[236:EOHIET]2.0.CO;2.
Theiler J. 1990.Estimating fractal dimension.Journal of the Optical Society of America 7:1055–1073.
Uno KT, Cerling TE, Harris JH, Kunimatsu Y, Leakey MG, Nakatsukasa M, Nakaya H. 2011.Late Miocene to Pliocene carbon isotope record of differential diet change among East African herbivores.Proceedings of the National Academy of Sciences of the United States of America108(16):6509–6514DOI 10.1073/pnas.1018435108.
Vilstrup JT, Seguin-Orlando A, Stiller M, Ginolhac A, Raghavan M, Nielsen SCA, Weinstock J, Froese D, Vasiliev SK, Ovodov ND, Clary J, Helgen KM, Fleischer RC, Cooper A, Shapiro B, Orlando L. 2013.Mitochondrial phylogenomics of modern and ancient equids.PLoS ONE8(2):e55950DOI 10.1371/journal.pone.0055950. Winkler DE, Kaiser TM. 2015a.Uneven distribution of enamel in the tooth crown of a
Plains Zebra (Equus quagga).PeerJ 3:e1002DOI 10.7717/peerj.1002.
Winkler DE, Kaiser TM. 2015b.Structural morphology of molars in large mam-malian herbivores: enamel content varies between tooth positions.PLoS ONE 10(8):e0135716DOI 10.1371/journal.pone.0135716.