Submitted 24 August 2015
Accepted 18 December 2015
Published13 January 2016
Corresponding author Mihai Udrescu, [email protected], [email protected] Academic editor Filippo Menczer
Additional Information and Declarations can be found on page 29
DOI10.7717/peerj-cs.42 Copyright
2016 Topirceanu et al.
Distributed under
Creative Commons CC-BY 4.0 OPEN ACCESS
Tolerance-based interaction: a new model
targeting opinion formation and
di
ff
usion in social networks
Alexandru Topirceanu1, Mihai Udrescu1, Mircea Vladutiu1and Radu Marculescu2
1Department of Computer and Software Engineering, Politehnica University Timisoara, Timisoara, Romania
2Department of Electrical and Computer Engineering, Carnegie Mellon University, Pittsburgh, PA, United States
ABSTRACT
One of the main motivations behind social network analysis is the quest for un-derstanding opinion formation and diffusion. Previous models have limitations, as they typically assume opinion interaction mechanisms based on thresholds which are either fixed or evolve according to a random process that is external to the social agent. Indeed, our empirical analysis on large real-world datasets such as Twitter, Meme Tracker, and Yelp, uncovers previously unaccounted for dynamic phenomena at population-level, namely the existence of distinctopinion formation phasesand
social balancing. We also reveal that a phase transition from an erratic behavior to social balancing can be triggered by network topology and by the ratio of opinion sources. Consequently, in order to build a model that properly accounts for these phenomena, we propose a new (individual-level) opinion interaction model based on tolerance. As opposed to the existing opinion interaction models, the new tol-erance model assumes that individual’s inner willingness to accept new opinions evolves over time according to basic human traits. Finally, by employing discrete event simulation on diverse social network topologies, we validate our opinion interaction model and show that, although the network size and opinion source ratio are important, the phase transition to social balancing is mainly fostered by the democratic structure of the small-world topology.
Subjects Network Science and Online Social Networks, Scientific Computing and Simulation, Social Computing
Keywords Social networks, Opinion diffusion, Phase transition, Discrete event simulation, Tolerance
INTRODUCTION
Taylor, 2013); this is because the social influence is the ability of individuals (agents) to influence others’ opinion in either one-on-one or group settings (Maxwell, 1993;Wang & Chen, 2003;McDonald & Wilson, 2011). Without social influence, the society would have an erratic behavior which would be hard to predict.
Existing studies on opinion formation and evolution (Axelrod, 1997;Riolo, Cohen & Axelrod, 2001;Acemoglu et al., 2013;Yildiz et al., 2013;Valente et al., 2013;Hussain et al., 2013;Guille et al., 2013;Ruan et al., 2015) rely on the contagion principle of opinion prop-agation. However, such studies offer limited predictability and realism because they are generally based on opinion interaction models which use either fixed thresholds (Deffuant et al., 2000;Javarone & Squartini, 2014), or thresholds evolving according to simple prob-abilistic processes that are not driven by the internal state of the social agents (Fang, Zhang & Thalmann, 2013;Deng, Liu & Xiong, 2013). To mitigate these limitations, we reveal new dynamical features of opinion spreading. The consistent and recurring real-world observations are then explained by introducing a new social interaction model which takes into account the evolution of individual’s inner state. We finally validate the proposed model by analyzing empirical data from Yelp, Twitter and MemeTracker, and by using our opinion dynamics simulation framework—SocialSim1(Topirceanu & Udrescu, 2014)—
1SocialSim is available atcs.upt.ro/∼ alext/socialsim.
which includes multiple complex topological models, as well as customizable opinion interaction and influence models. Consequently, our main contributions are threefold:
1. Identification of four distinct phases in opinion formation: this aspect isnotentirely captured by existing models (Sznajd-Weron & Sznajd, 2000;Li et al., 2012;Acemoglu et al., 2013;Chen, Wang & Li, 2014;Guille et al., 2013;Fang, Zhang & Thalmann, 2013) although previous research (Hołyst, Kacperski & Schweitzer, 2000) has noticed that there are some stages in opinion evolution. We argue that the succession of opinion formation phases is critical to thesocial balancingphenomenon (i.e., the general opinion becomes stable despite constant local oscillations). We also identify aphase transitionfrom an unstable opinion to social balancing which is related to the dynamics of opinion formation phases.
2. Modeling opinion dynamics: we propose a new graph and threshold based interaction model with stubborn agents (SA) (Acemoglu & Ozdaglar, 2011) which is able to reproduce the phenomena that we observe in real-world datasets. Inspired by social psychology, our new model assumes that individual’s willingness to accept new opinions (i.e., tolerance) changes over time according to his/her inner state.
3. Validation of the newly proposed tolerance modelvia our discrete-event simulator SocialSim (Topirceanu & Udrescu, 2014). The analysis we provide reveals the deep connection between social balancing and the relevant parameters of social networks such as network size, topology, and opinion source ratio (i.e., stubborn agents distribution)(Acemoglu et al., 2013); this correlates well with our empirical observations on large social networks.
we consider to be opinion sources), as well as underlying network topology. Consequently, our findings can be used to improve our understanding of opinion formation and diffusion in social networks, and predictability of social dynamics.
METHODS
Our empirical analysis is based on three full datasets from the SNAP online collection2and
2Datasets available online at:https://snap.
stanford.edu/data/volumeseries.html.
Yelp,3which contain opinion fluctuation data with time information.
3Dataset available online at:https://www.
yelp.com/dataset challenge/dataset.
The Yelp dataset: contains graded (1–5 stars) user reviews of American businesses, each with a timestamp. One can obtain insights on the popularity of a business at a given time. The usable information is the number of reviews at a given moment in time (interpreted as network size of individuals with an opinion), the average grade in time (the average opinion over time), and the number of votes to each review (ratio of agents with strong or “stubborn” opinions, because when an agent votes, his opinion is already made up). The dataset contains 366,715 users, 61,814 businesses and 1,569,264 reviews. Out of this data, we processed and filtered businesses with at least 100 reviews (i.e., we need a significant number of reviews for a relevant dynamical analysis). As such, we obtained 2,331 businesses for further analysis.
MemeTracker and Twitter hashtags with time information from the Stanford Large Network Dataset Collection (SNAP); which contain the history (repost rate in time) of diverse, popular hashtags. We can use this data to analyze the evolution of a particular opinion in time. MemeTracker phrases are the 1,000 highest total volume phrases among 343 million phrases collected within 2008–2009. Twitter hashtags are the 1,000 highest total volume hashtags among 6 million hashtags from Jun–Dec 2009. We filtered the Twitter and MemeTracker data so that only the memes or hashtags which can be related to opinions remain, e.g., we have excluded those related to rare events like natural disasters. As such, we rendered a number of 500 re-tweets and 500 hashtags for further processing.
Discrete simulation methodology
We test and validate our new opinion interaction model based on tolerance with the Java-based opinion dynamics simulator SocialSim (Topirceanu & Udrescu, 2014).
Like any discrete event simulation, we define the salient properties of the experimental setup which was used to obtain the simulation results. Events are synchronized by the simulation clock; we call the period of this clock a simulationday. One day is a simulation period in which agents can interact with their neighbors. However, an agent does not inter-act daily; in finter-act, each agent picks a random number of days to be ininter-active after each inter-active day. In our simulation, we use a random timeout interval between 1 day and 50 days. Only after this time has elapsed, will an agent interact again with one random neighbor. After that interaction, the agent will again choose to be inactive for a random period of days.
RESULTS
the opinion change of the social networks, denoted asω. For Yelp there is a clear link between the opinion state of the participants (denoted ass) and the number of stars awarded by the users. We also assume that Yelp users are agents in a social network with a typical structure; this underlying social network influences opinion dynamics in Yelp. As such, opinion change is simply the variation in time of the stars awarded by users:
ω=s(t)−s(t−1). For the Twitter and MemeTracker datasets, we interpret the number of replies as a proxy for opinion strength, e.g., more replies indicate a stronger opinion. When previously unopinionated people reply or re-tweet, they do so because they have formed a clear opinion on a particular subject (say, reflected in a hashtag) and they feel the need to express it publicly. As such, the assumption is that we can interpret the change in the number of people that retweet or reply to a hashtag as representing the opinion changeω.
Opinion formation phases and social balancing
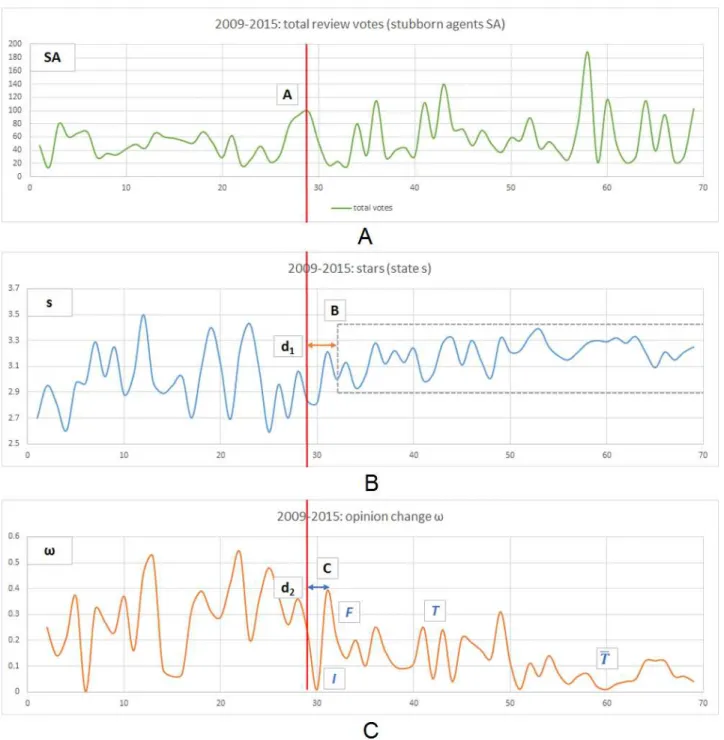
Using the Yelp context, we explain how the opinion formation phases (I-initiation,
F-fusion, T-tolerance andT-intolerance) are detected. For each business, we have automatically detected all spikes in the number of total votes (interpreted as opinion sources which never change their state, or stubborn agents SA) and have corroborated these with the point at which the state (average stars) has a variation of less than 1 star between maximum and minimum stars awarded. The reason behind considering the variation interval is that 1 star is the psychological threshold represented by the unit of measurement. Using an algorithmic explanation, we describe the pseudocode for detecting three points of interest—A (start of convergence of state), B (spike in SA concentration just before the convergence of state), C (spike in opinion change just after the spike in SA).
findtBso that:
maximum (s(k))-minimum(s(k))<1for alltB≤k<tmax assignB(tB,s(tB))
Algorithm 1:Detecting B: start of convergence in stars on OX-axis
find spike[ ] := list of all local maximums in the number of total votes find spike[tA] so that:
tA<tB(last spike beforetB) assignA(tA,SA(tA))
Algorithm 2:Detecting A: spike in SA just before convergence of stars
find spike[ ] := list of all local maximums in the opinion change find spike[tC] so that:
tB<tC(first spike aftertB) assignC(tC, ω(tC))
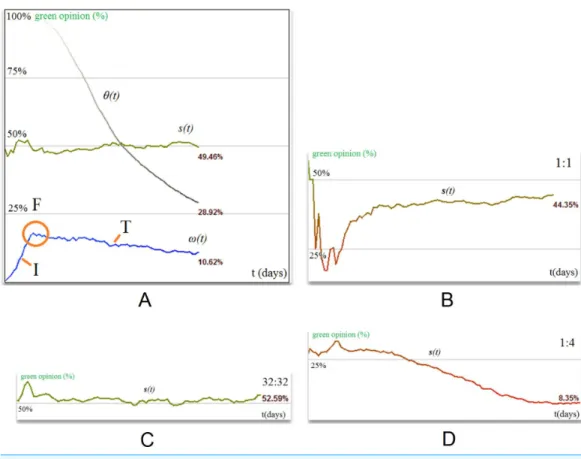
By automatically performing this methodology on all 2,331 businesses, we find that the average distance between the closest spike on the time axis OX (point A in the example fromFig. 1) which occurred before the convergence of stars (i.e., point B inFig. 1, where the variation of awarded stars becomes lower than 1 star) isdconv=4.131 time units. Distancedconvis relatively small with respect to the observation interval of 100 time units or days, suggesting the fact that spikes in SA trigger a (shortly delayed) convergence of stars.
Further, we show that the spike in SA (point A) also triggers a maximum spike in the opinion change (point C). By running this methodology on all businesses, we obtain an average distance between the spike in SA and maximum spike in opinion change of
dfusion=4.828 time units. These statistical results support the fact that spikes in SA trigger a maximum spike in opinion change.
Moreover, when we corroborate the average delays between the spike in SA and spikes in stars and opinion change, namely 4.131 and 4.828 time units, we can conclude that the convergence of opinion and the fusion phase are distanced, on average, by only
dcorr =0.697 time units. Backed up by this data, we can admit that the convergence of opinion (point B) and the triggering of the fusion phase (point C) are closely correlated. Apart from the above statistical analysis, in order to improve the readability of our insight, we also present an illustrative example. As such, inFig. 1, the phase transition happens at OX=28 (point A) as the spike in the total votes (green line) coincides with a delayed stabilization (point B at OX=33) of the average stars awarded (blue line). The triggered spike in opinion change is marked with point C (at OX=32).
We also extend our interpretation of Yelp dynamics in terms of opinion changeωby presenting some relevant examples from Twitter and MemeTracker datasets.Figure 2 illustrates a few cases of memes that can be related to users opinion about, for instance, Beyonce’s song (“single ladies put a ring on it”), a movie (“where the wild things are”), or the significance of elections outcome (#IranElections).
Inspired by a similar approach on Twitter data (Lehmann et al., 2012), we have conducted a statistical analysis on all three datasets. Using all datasets from Twitter (1,000 hashtags), MemeTracker (1,000 keywords) and Yelp (2,331 businesses) we have algorithmically detected the following characteristic phases in the opinion dynamics:
1. Fusion(2nd phase) is the spike centered around the previously detected point
C(tC,ω(tC))withtCbeing the time projection andω(tC)the corresponding opinion change of point C. For convenience, we will refer to the local spike in opinion change
ω(tC)asfs(fusion spike).
2. Initiation(1st phase): starting from timek=0 (on OX-axis), find 0≤k<tCso that
ω(k) <0.5·fsANDω(k+1) >0.5·fs. In other words, timekrepresents the first point at which the opinion changeωexceeds 50% of the fusion spikefs. We have used this threshold value because it represents the half amplitude of the fusion phase, which it precedes.
Figure 2 Evolution of replies/retweets (opinion changeω) for some representative hashtags containing user-expressed opinion from: (A) Meme-Tracker. Both tags 1 and 2 exhibit the fusion phase (F) (opinion spike), then they slowly converge towards intolerance (T). Tag 1 exhibits a second spike after theFphase, then enters the intolerance phase. (B) Twitter. Tag 1 exhibits the fusion phaseF(first opinion spike), then oscillates during the tolerance phase (T) keeping social balance. Tag 2 shows an example of convergence towards the intolerance phase, as social balancing does not occur.
other words, timekrepresents the first point, from end to beginning of time, at whichω
exceeds 10% of the fusion spike. We consider that a social network reaches intolerance if toleranceθ <0.1, so we use the 10% threshold for opinion change. Any higher than 10%, and opinion change is still in the tolerance phase, any lower, and opinion change is likely to converge towards 0.
4. Tolerance(3rd phase): starting from timek=tC+1 (start of social balance), find
tC<k<tmaxso thatω(k) >0.1·fsANDω(k+1) <0.1·fs(end of social balance). In other words, timekrepresents the point at whichωdecreases below the 10% threshold which we consider a transition into the intolerance phase.
we identify the following phases in opinion formation: an initiation phase (I) when new opinions are injected into the social network and the number of replies starts to increase rapidly; a fusion phase (F) when the opinion dynamics reaches a maximum and different opinions start to collide; a tolerance phase (T) which represents a fluctuating yet convergent behavior; and, occasionally, an intolerance phase (T) when the fluctuations of opinion decrease and converge towards zero. Based on network topology and/or ratio of opinion sources, the diffusion process may reach the fourth phase of intolerance. Opinion sources, or stubborn agents (Acemoglu, Ozdaglar & Yildiz, 2011;Acemoglu et al., 2013), are agents within the social network (i.e., Twitter or Yelp users) who try to instill a certain opinion by influencing their peers; they are represented by those people within the network who hold strong opinions that do not change over time. The concentration of opinion sources is expressed as their ratio relative to the entire population.
Additionally, the analysis of Twitter and MemeTracker results inFig. 2shows that all tags exhibit a clearFphase (first spike). InFig. 2B, tag 2 converges towards intolerance (T
phase), while tag 1 enters a balanced oscillation (Tphase) which supports the empirical observation of a phenomenon that we callsocial balancing, i.e., oscillations at microscopic scale of individuals opinion become stable and predictable at the macroscopic scale of the society. As such, social balancing is defined as the succession ofI−F−Tphases, whereas social imbalance occurs if either the society does not reachTor, after reachingT, it decays into aTphase. For example, tag 2 (#IranElections) inFig. 2Bhas a shorter, more abrupt oscillation. In this case, we consider that the number of opinion sources is not high enough (i.e., above a critical threshold) for social balancing to happen. Tag 2 is an example of social imbalance with a decisive crystallization of just one opinion, as there is noTphase.
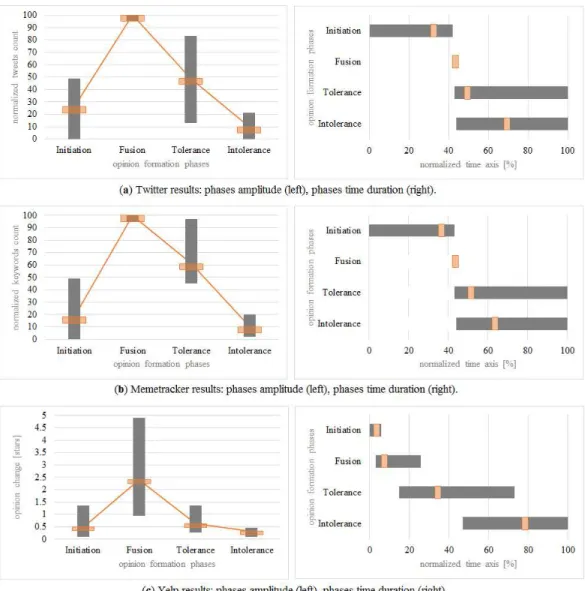
The averages of opinion change obtained for each considered dataset and for each phase are the following (their representation is given inFig. 3). Within square brackets are the minimum, maximum and standard deviation for each statistical average:
• Twitter: initiation starts at OX=0 and ends and OX=33 [0, 39, 9.06], and has an average amplitude OY=21% [0%, 49%, 5.08]. Fusion happens at OX=42 and has an amplitude of 100% (i.e., it represents the maximum spike). Tolerance starts on average at OX=48 (43, end of time series, 4.07), and has an average amplitude OY=44% [13%, 83%, 4.01]. Intolerance starts on average at OX=68 (44, end of time series, 26.54), and has an average amplitude OY=5% [0%, 21%, 4.06].
• MemeTracker: initiation starts at OX=0 and ends and OX=37 [0, 40, 6.24], and has an average amplitude OY=13% [0%, 49%, 10.59]. Fusion happens at OX=42 and has an amplitude of 100% (i.e., it represents the maximum spike). Tolerance starts on average at OX=50 (43, end of time series, 4.88), and has an average amplitude OY=56% [45%, 97%, 3.90]. Intolerance starts on average at OX=62 (44, end of time series, 17.95), and has an average amplitude OY=5% [2%, 20%, 3.74].
Figure 3 The four opinion formation phases represented in terms of: normalized amplitude (number of tweets/maximum number of tweets or opinion change in Yelp/maximum opinion change in stars), with each bar-plot depicting the minimum, maximum and average variation of opinion change; and time duration (on OX time-axis), with each horizontal bar depicting the minimum, maximum dura-tions of the phase (gray), and the time at which it occurs on average (orange).All datasets indicate the same shape of opinion dynamics and the same succession of phases:I-initiation,F-fusion,T-tolerance andT-intolerance.
happens at OX=6 [3, 23] and has an amplitude of OY=2.25 [0.93, 4.9] stars. Tolerance starts on average at OX=33 [15, 73], and has an average amplitude OY=0.475 [0.275, 1.36] stars. Intolerance starts on average at OX=77 [47, end of time series], and has an average amplitude OY=0.175 [0.095, 0.46] stars.
Phase transition
With data from Yelp, we show the effects of a phase transition from social instability to social balancing which can occur when a critical concentration of opinion sources is reached in a social network.Figure 1highlights the fact that opinion (i.e., the stars given by users to a particular business) stabilizes only after reaching a critical ratio of opinion sources (i.e., votes representing strong opinions). This can be viewed inFig. 1at time point OX=28. We interpret this phenomenon as a rise beyond aσ threshold for the concentration of opinion sources, which determines thesocial balancing,i.e., the average opinion stabilizes despite of opinion oscillations at local level.
Corroborating all these empirical observations with the statistical analysis, we can state that Twitter and MemeTracker illustrate aresponsivetype of behavior, i.e., an immediate evolution towards theFphase, so a high opinion change is quickly reached for a relatively small ratioσ of opinion sources. This behavior, in turn, correlates well with another study which shows that Twitter online networks have a strong random and small-world component (Duma & Topirceanu, 2014).
In contrast, the Yelp dataset can be associated with asaturatedtype of behavior, as the ratioσ(relative to the maximum number of votes) needed to trigger the phase transition towards social balancing is high in all three cases. Balancing does not occur until a high concentration of opinion sources (we interpret them as similar to opinion-influencing “stubborn agents” (Acemoglu et al., 2013) or “blocked nodes” (Ruan et al., 2015)) are inserted into the social network.
New tolerance-based opinion model
This section analyzes the characteristics of a new opinion model that can reproduce this kind of real-world phenomena, i.e., the four opinion formation phases and phase transition towards social balancing. Our interaction model is tested on synthetic networks and compared to the empirical data—introduced in the previous section—through qualitative means.
In terms of networkstructure, our analysis includes the basic topologies such as mesh, random (Erd¨os & R´enyi, 1960), small-world (Watts & Strogatz, 1998), and scale-free networks (Barab´asi & Albert, 1999). Also, based on the last decade of research on realistic social network topology generation which either adds the small-world property to scale-free models (Holme & Kim, 2002;Fu & Liao, 2006;Li, Qian & Wang, 2012), or adds a power-law degree distribution to the small-worlds (Jian-Guo, Yan-Zhong & Zhong-Tuo, 2006;Chen, Zhang & Huang, 2007;Wang & Rong, 2008;Zaidi, 2013), we also consider the Watts–Strogatz with degree distribution (WSDD) (Chen, Zhang & Huang, 2007).
Xiong, 2013;Li et al., 2011), but their evolution is not driven by the internal states of the social agents. On the other hand, our empirical references (i.e., Twitter, MemeTracker and Yelp) indicate that opinion does not cease to oscillate and consensus is a rare case in real world. Therefore, we propose an opinion interaction model based on stubborn agents, because it assumes that the society does not reach consensus. Based on recent research on stubborn agents which use a discrete (Yildiz et al., 2013) or continuous (Acemoglu et al., 2013) representation of opinion, we integrate the following opinion models: one-to-one (simple contagion) versus one-to-many diffusion (complex contagion) (Centola & Macy, 2007), and discrete (0 or 1) versus continuous (0–1) opinion representation. By combining opinion representation and opinion diffusion, we obtain 4 distinct models; they are defined inFig. 4Aand exemplified inFigs. 4Band4C. We build our tolerance-based opinion interaction model by using the SD (1) and SC (2) opinion representations as defined inFig. 4A.
Given a social networkG= {V,E}composed of agentsV = {1,2,...,N}and edges
E, we define the neighborhood of agenti ∈ V asNi= {j|(i,j) ∈ E}. The disjoint sets of stubborn agents V0,V1 ∈ V (opinion sources), andnull agents Vnull ∈ V (non-participants with no opinion) never change their opinion, while all other (regular) agentsV \ {V0∪V1∪Vnull}update their opinion based on the opinion of one or all of their direct neighbors.
We usexi(t)to represent the real-time opinion of agentiat timet. Normal (regular) agents can start with a predefined random opinion valuexi(0) ∈ [0,1]. The process of changing the opinion of regular agents is triggered according to a Poisson distribution and consists of either adopting the opinion of a randomly chosen direct neighbor, or an averaged opinion of all direct neighbors.
We represent withsi(t)the discrete opinion of an agentiat momentthaving continuous opinionxi(t). In case of the discrete opinion representation SD (1) (Fig. 4A),xi(t)=si(t); in case of the continuous opinion representation SC (2) (Fig. 4A),si(t)is given byEq. (1).
si(t)=
0 if 0≤xi(t) <0.5 NONE ifxi(t)=0.5 1 if 0.5<xi(t)≤1.
(1)
Furthermore,s(t)denotes the average state of the population at a certain timetby averaging the opinion of all individual agentsi ∈ V.
s(t)= 1 |V|
i∈V
si(t). (2)
models are only suited for theoretical contexts so bringing additional complexity to the interaction model would significantly increase the difficulty of mathematical analysis; second, involving measures of human personality (e.g., quantifying an individuals trust, credibility, or emotional state) is a complicated endeavor, in general; this was not the main goal of previous work.
Individual tolerance: interpretation and formalism
In order to improve the existing opinion interaction model based on a fixed threshold, we consider the evolution of personal traits by taking inspiration from social psychology. As a new contribution to the state-of-the-art, we introduce the concept oftolerance
which reflects the individual’s inner state and personal beliefs regarding surrounding opinions. For instance, egocentrism, as it is called in psychology, is highly correlated with individual’s emotional state (Elkind, 1967). We choose to extend this model because the egocentrism-emotional state correlation is a trait that has been shown to influence and evolve with individual opinion (Windschitl et al., 2008).
Corroborating literature on attitude certainty (Clarkson et al., 2013), consensus (Clarkson et al., 2013), confirmation bias (Nyhan & Reifler, 2010), social group influ-ence (Roccas & Amit, 2011), and ingroup emotion (Moons et al., 2009), we extrapolate the mechanism that leads to the formation of opinion into a measurable parameter. As such, we definetoleranceθas a parameter that reflects the willingness of an agent to accept new opinions. Similar to real life, individuals with higher tolerance will accept the others opinion easier; thus, this parameter can be defined as a real number 0≤θ ≤1. An agent with a tolerance value of 1 is called fully tolerant, whereas an agent with a tolerance of 0 is called fully intolerant (i.e., stubborn agent). Tolerance values which are greater than 0.5 describe a tolerance-inclined agent, while values smaller than 0.5 describe an intolerance-inclined agent.
Similar to the threshold-based continuous opinion fluctuation model described by Acemoglu et al. (2013), tolerance can be used as a trust factor for an agent relationship; however, as opposed to the trust factor, tolerance changes its value over time:
xi(t)=
0 ifi∈V0
1 ifi∈V1
0.5 ifi∈Vnull
θi(t)xj(t)+(1−θi(t))xi(t−1) ifj∈Ni
fort>0 (3)
where the new opinionxi(t)is a weighted sum of the agent’s prior opinionxi(t−1)and the current opinionxj(t)of one randomly selected direct neighbor. The weights for the two opinions are given by the current toleranceθi(t)of the agent, thus, the extent of how much it can be influenced depends on its internal state.
a more stable opinion. We further define the toleranceθ of the entire population as a normalized average of all individual tolerances:
θ (t)= 1 |V|
i∈V
θi(t). (4)
We also introduce the concept ofopinion changeωas the ratio of agents which have changed their current state (discrete time stept) since the last observation (timet−1):
ω(t)= 1 |V|
i∈V
|si(t)−si(t−1)|. (5)
If an agent changes its state from one opinion to another, then the absolute difference |si(t)−si(t−1)|will be 1; conversely, it will be 0 if the agent state does not change. This change, averaged over all agents at the interaction (discrete) momentt, defines the opinion change of the populationω(t). This metric is used to draw insights regarding the current tolerance level across the entire society.
Progressive tolerance model
Our model for tolerance evolution stems from the idea that the evolution towards both tolerance and intolerance varies exponentially (Hegselmann & Krause, 2002;Weidlich, 2002), e.g., a person under constant influence becomes convinced at an increased rate over time. If that person faces an opposing opinion, it will eventually start to progressively build confidence in that other opinion. Thus, our proposed progressive model represents the tolerance fluctuation as a non-linear function, unlike other models in literature. For the first time, we integrate these socio-psychological characteristics in the dynamical opinion interaction model; as such, the new tolerance state is obtained as:
θi(t)=
max(θi(t−1)−α0ε0,0) ifsi(t−1)=sj(t) min(θi(t−1)+α1ε1,1) otherwise.
(6)
InEq. (6), tolerance decreases by a factor ofα0ε0if the state of the agent before interaction,
si(t−1), is the same as the state of the interacting neighbor (randomly chosen from all direct neighbors)sj(t). If the states are not identical, i.e., the agent comes in contact with an opposite opinion, then the tolerance will increase by a factor ofα1ε1. Variabletrepresents the time step where an opinion update is triggered; these moments are considered as being randomly distributed. The two scaling factors,α0andα1, both initially set as 1, act as weights (i.e., counters) which are increased to account for every event in which the initiating agent keeps its old opinion (i.e., tolerance decreasing), or changes its old opinion (i.e., tolerance increasing). Therefore, we have:
α0=
α0+1 ifsi(t−1)=si(t)
1 otherwise (7)
α1=
1 ifsi(t−1)=si(t)
α1+1 otherwise.
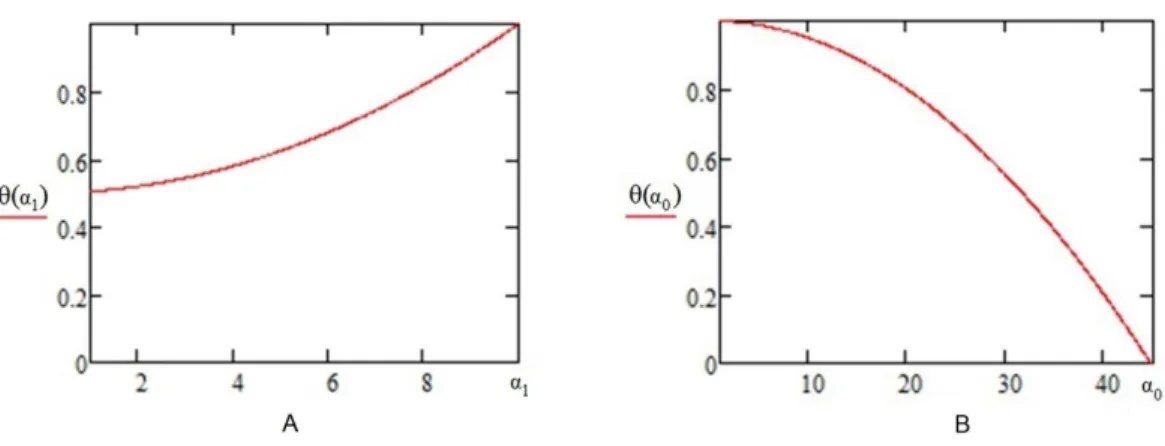
Figure 5 The tolerance function as defined by the progressive tolerance model.(A) Tolerance scaling: shows how toleranceθ increases with theα1ε1 scaling, as a result of continuous opinion change for an agenti. (B) Intolerance scaling: shows how toleranceθ drops with theα0ε0scaling, from an initial
toleranceθi(0)=1 to complete intolerance (θi(t)=0).
On even terms with the observation of themajority illusion(Lerman, Yan & Wu, 2015), which explains that globally rare opinions and bias may be strongly present in local neighborhoods as a result of the topology of social networks, we dynamically model bias using the two scaling factorsα0andα1. Whenever an event occurs, the counter corresponding to the other type of event is reset. These factors are used to increase the magnitude of the two tolerance modification ratiosε0(intolerance modifier weight) and
ε1(tolerance modifier weight). The two ratios are chosen with the fixed values ofε0=0.002 andε1=0.01. To determine these values, we have tried variousε0:ε1ratios as follows: ifε0 is increased such thatε0:ε1=1:1, most nodes will quickly become intolerant, as opinion will cease to diffuse; conversely, ifε0is decreased closer to a 1:10 ratio, then the society will become tolerance-inclined, with random opinion fluctuations. The usedε0:ε1ratio of 1:5 was chosen through consistent experimentation in order to provide a good balance between the deviations towards tolerance and intolerance, respectively.
As an illustration of the 1:5 ratio forε0:ε1,Fig. 5represents the non-linear tolerance function as implemented inEq. (6). The displayed examples show that a total of 10 consecutive steps are required to maximize the tolerance if an agent starts withθi(0)=0.5, because the cumulative sum ofθi(0)+ε0jα0reaches 1 after 10 iterations. Similarly, in Fig. 5B, the sumθi(0)−ε1jα1requirest=45 iterations to reach intolerance (θi(t)=0), having started fromθi(0)=1.
MODEL VALIDATION
Our dynamical opinion model adds significant complexity to the opinion interaction model. Therefore, we use discrete event simulation (SocialSim (Topirceanu & Udrescu, 2014)) over complex social network topologies, in order to validate our model’s capability to reproduce real-world phenomena like the opinion formation phases and the phase transition towards social balancing.
performed extensive simulations to compare it against our simple contagion results and we have found that when using complex contagion, the dynamics of the society is accelerated and theI,Fphases occur very fast, theT phase is omitted, and the society enters the intolerance phase. This is due to the fact that averaging the opinion of neighbors does not allow a node to be in contact with the likely divergent opinions of his neighbors, one by one, and thus tolerance cannot increase. As a consequence, nodes toleranceθwill decrease after each interaction. Conceptually, we have defined the tolerance model to keep nodes tolerant through individual interactions which present diversity in opinion, like we would have in real life. Even if humans usually evolve towards the average opinion of their social group, they do so through sequences of individual interactions, as our model tries to capture.
Simulation on basic topologies
Regular networks
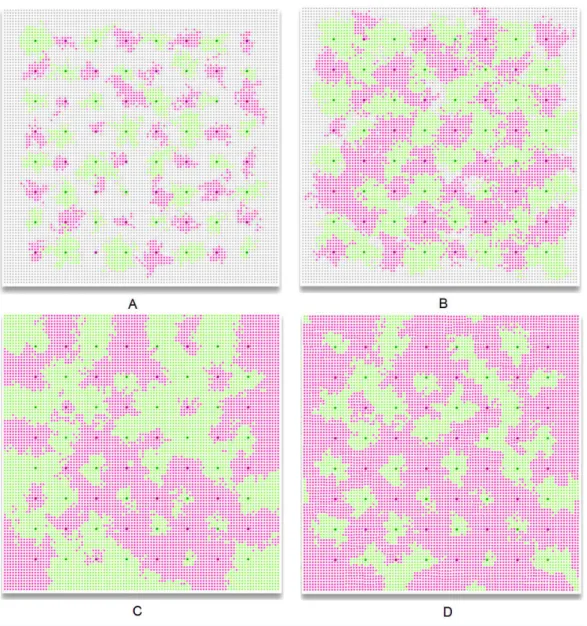
The first simulation setup is based on regular topologies, i.e., lattice and mesh. The results show that a homogeneous cluster of stubborn agents divides the overall society opinion (i.e., green (1) vs. red (0)) with a ratio that is directly proportional with their initial distribution.Figure 6is used as an exemplification of the four phases, as obtained in SocialSim, and shows how a mesh network of 100,000 agents (generated by placing nodes uniformly in a 1,000 by 1,000 unit space and connecting them within a radius of 10 with link probabilityp=0.15) evolves under the influence of 64 stubborn agents—32 of each opinion evenly distributed among the population. This way, we observe the same opinion formation phases as identified by our empirical observations: initiationI(Fig. 6A), fusion
F(Fig. 6B), toleranceT(Fig. 6C), and intoleranceT(Fig. 6D). The situation inFig. 6C may lead to one of two scenarios: a perpetual (proportional) balance of the two opinions, introduced by us associal balancing(the society remains in theTphase, andTis never reached), or a constant decrease in opinion dynamics which ultimately leads to a stop in opinion change (the society reaches theTphase), as depicted inFig. 6D.
Figure 7provides illustrative, single experiment results, which intend to capture the specific behavior of opinion evolution. Again, the same patterns were observed throughout all our multiple simulations.Figure 7Aillustrates a society which tends towards the tolerance phaseTand social balance, by providing the evolution of the overall society states(t)(as defined inEq. (2)), toleranceθ (t)(seeEq. (4)), and opinion changeω(t)
(Eq. (5)). For the society described inFig. 7A, the initiation phaseIis revealed by the early increase ofω(t), as the number of individuals with opinion increases. The climax ofω(t)
represents the fusion phaseF. At this stage, there is a maximum number of bordering agents with distinct opinions (a situation that is also depicted inFig. 6B) ands(t)evens out. In the tolerance phaseT, the agents tend to stabilize their opinion, i.e.,θ (t)stabilizes and
s(t)converges towards the ratio of stubborn agents (which was chosen as 1:1).
Figure 6 Green (1) vs. red (0) opinion evolution with homogeneous stubborn agent distribution in a 100,000 node social network.The network is initialized with 32 red and 32 green stubborn agents (represented as the darker nodes) which start influencing the neighboring regular agents. Initially, the regular agents have no opinion and are colored with grey. We distinguish between the following phases of opinion formation: (A) the initiation phaseIwhere the society has no opinion, i.e., the stubborn agents exercise their influence to the surrounding neighborhood without being affected by any other opinion. The opinion changeω(t)rises during this phase, whereas toleranceθ (t)remains high. (B) The fusion phaseFwhere the society is now mostly polarized (green or red) and different opinion clusters expand and collapse throughout the society. The opinion changeω(t)reaches a maximum, and toleranceθ (t) begins to slowly decrease. (C) Tolerance phaseT, where the cluster interaction stabilizes and new, larger, more stable clusters emerge. Most of the individuals within the society have been in contact with both opinions; each agent’s opinionsi(t)begins to converge, and the toleranceθ (t)is steadily declining or
Figure 7 Simulation of a 100,000 mesh network with SocialSim (Topirceanu & Udrescu, 2014), display-ing a representative example for the evolution ofs(t),θ (t), andω(t), as well as the opinion evolution s(t)with various stubborn agents distributions.(A) Representative setup for the mesh topology, where the lowest panel displays the opinion change (ω) evolution over three simulation phases: (I) initiation, (F) fusion, and (T) tolerance. The opinion state (s) and its tolerance (θ) are also displayed in the middle and upper panels. (B) Opinion evolutions(t)with few and evenly distributed stubborn agents SA (1:1 ratio: 1 green, 1 red). (C) Opinion evolution with many and evenly distributed stubborn agents (1:1 ratio: 32 green, 32 red), (D) opinion evolution with few and unevenly distributed stubborn agents (1:4 ratio: 1 green, 4 red).
fluctuates. This is explained by the fact that having few stubborn agents means few points of opinion control and stabilization in the local mesh structure; conversely, many stubborn agents make possible the control of more regular agents. Because of this,s(t)may drastically get biased in someone’s favor until the entire society stabilizes (Fig. 7B). Also, due to the small influencing power of a few agents, the opinion will not necessarily stabilize with the same distribution ratio. As expected, the opinion distribution of a society with a high opinion source concentration will tend towards the ratio of the two stubborn agent populations (Fig. 7C).
Figure 8 (A) Representative simulations depicting opinion evolution in networks with 32 uniformly dis-tributed stubborn agents for both competing opinions. (A) An uncorrelated random scale-free network in which opinion constantly oscillates, society becomes balanced and stabilizes in the tolerance phase (T) after going through the initiation (I) and fusion (F) phases. (B) An Erdos–Renyi network in which opinion change is maintained high and opinion presents high oscillations, but the overall statesof the society becomes stable and predictable around 50% (i.e., as expected for a balanced ratio of SAs).
The scenarios presented above hold true for lattices. Consequently, these conclusions are more of theoretical interest, as real social networks are typically not organized as such regular topologies. Next, we consider more realistic network topologies.
Random networks
In order to generate random topologies, we have implemented both Erdos–Renyi networks (Erd¨os & R´enyi, 1960) (seeFig. 8A), as well as uncorrelated networks with preferential attachment (uncorrelated scale-free) as defined by (Catanzaro, Boguna & Pastor-Satorras, 2005) (seeFig. 8B). We create networks of 100,000 nodes with the Erdos–Renyi algorithm (Erd¨os & R´enyi, 1960) with wiring probabilityp=10−4, and the algorithm described inCatanzaro, Boguna & Pastor-Satorras (2005)with 10,000 nodes with power-law distributed node degrees within the range 1–100. We use an exponent of
γ = −2.41, which is within the power-law interval−3< γ <−2.
Because of the random nature of this second topology, the results obtained with SocialSim are much closer to what we obtain for random networks.Figure 8represents the opinion formation phases. Due to the disassortative connectivity, opinion dynamics leads to an evolution towards social balance.
Small-world networks
By constructing Watts–Strogatz small-world networks of 100,000 nodes (Watts & Strogatz, 1998;Strogatz, 2001;Wang & Chen, 2003;Tsvetovat & Carley, 2005;Chen, Zhang & Huang, 2007;Bandyopadhyay et al., 2011), we show experimentally that a different type of behavior can emerge. Specifically, we used multiple simulation settings with rewiring probabilities
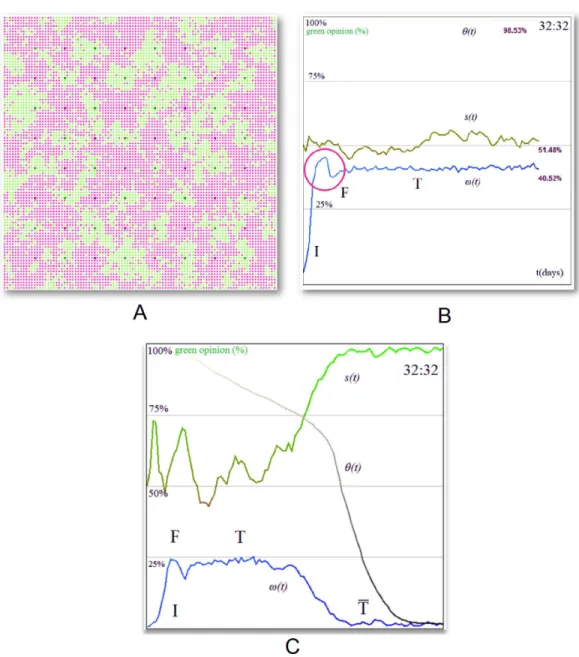
p=0.1,p=0.2 andp=0.5 respectively, and keep the results forp=0.1 as being the most representative, because the clustering coefficient remains high (i.e., 0.368). As such, Figs. 9Aand9Bpresent the society as having a mixed opinions distribution with clusters forming around stubborn agents. Similar to the representation inFig. 6, this topology allows multiple agents to cluster around the stubborn agents and converge towards their opinion. A higher rewiring parameterpis associated with a more random topology which is found to increase tolerance and dissolve agent clusters around opinion sources. Consequently, this model not only increases the dynamics of opinion fluctuation, but also keeps the society insocial balance. The fourth and final phase of opinion evolution—the intolerance phase—does not occur, and opinion changeω(t)is maintained at a (high) constant level. Moreover, the state of the societys(t)is stable.
The society depicted inFig. 9Ais homogeneously mixed from an opinion standpoint. Clusters do not form because many agents have long range links to other distant agents whose opinion can be different from the local one. This leads to a perpetual fluctuation which remains in balance. The noticeable effect on a small-world network is that the opinion stabilizes very fast and always at the ratio of the two stubborn agent populations (i.e., 1:1 in our case). In a mesh network, having few stubborn agents leads to an imbalance of opinion, but in the case of small-world topologies, opinion across the entire population always stabilizes. Opinion changeω(t)is also much higher compared to the mesh (i.e., 42% versus 10% under the same conditions) due to the long range links.
Networks with preferential attachment
Figure 9 Opinion evolution with homogeneous stubborn agent distribution (32:32) in small-world and BA networks.(A) Tolerance phase where visible clusters emerge for small-world networks. (B) For small-world networks, social balancing is attained because tolerance remains extremely high (θ (t) > 90%), opinion change (ω) exhibits the three opinion evolution phases (initiation I, fusion F, and toleranceT), and never reaches intolerance. The state of the societys(t)is stable. (C) Social balancing is not achieved for BA networks: tolerance drops constantly and the society reaches the intolerance phase (T). The state of the societys(t)is unstable during the first three phases of opinion change, then stabilizes as tolerance (θ) and opinion change (ω) fall.
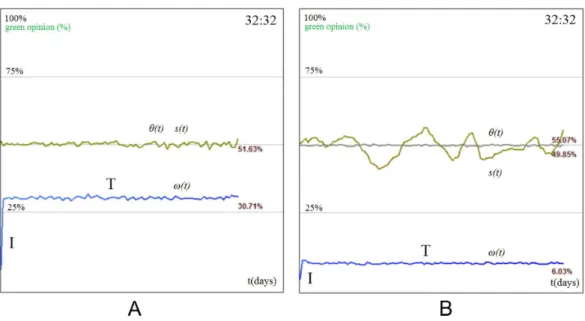
Figure 10 Simulation results on a small-world network with 32 red and 32 green stubborn agents for the: (A) fully random interaction model: there are no opinion formation phases, the society is balanced all the time and the opinion has almost no oscillations; (B) random-tolerance interaction model: there are no clear opinion formation phases, the society is balanced all the time, while the opinion has oscillations.
communities, each with 1,000 nodes. The nodes are connected withK=2 neighbors on each side and a rewiring probabilityp=0.1.
Validation hypotheses
In order to strengthen the idea of social balancing, which is observed in our experimental data, we propose to validate the tolerance model against a null/random model. This is addressed by the implementation of random interacting agents in our simulation tool, followed by a replication of the experiments, and a final conclusion. We have added randomness in two ways:
• Fully-random interaction model: all agents have random tolerance values, random initial opinions, interact with random neighbors who posses random opinions, and tolerance is updated randomly after each interaction. Looking at the simulation results with random interaction model, we obtain the same output regardless of topology and SA concentration.
• Random-tolerance interaction model: similar with our proposed opinion interaction model, but here each agent receives a static tolerance initialized with a random value in the [0,1] interval at startup.
phases are not clear. We can only conclude that using a random/null model for validation shows that tolerance actually plays an important role in the statistical results obtained in our paper.
In real-world social networks there are agents which do not hold any opinion, and they simply do not participate the diffusion process. We have covered this scenario inEq. (1)as an agent which has opinionx(t)=0.5 will carry the stateNONE. These agents are called
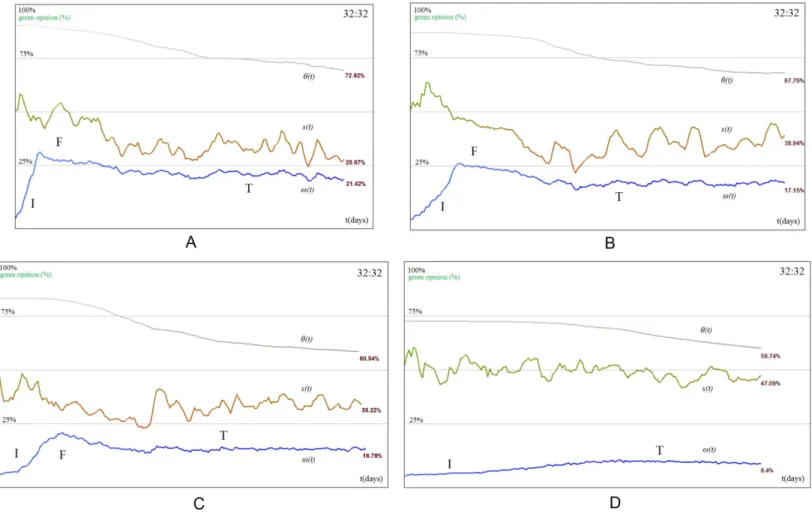
null agents(NA) and do not take part in the opinion interaction. Theoretically, we consider thatNAs should act like edge-disconnections in the graph. By addingNAs in SocialSim, we were able to test them with all our synthetic topologies. The higher the population of randomly distributedNAs, the fuzzier the four phases become. Initiation (I) is less steeper, fusion (F) isn’t thatspikyanymore, tolerance (T) is achieved harder/later as the state oscillates more, but the society is still in balance and predictable; opinion change stabilizes with some delay. The phases tend to dissolve after a concentration of approximately 30% population of null agents.
Additional simulations have been run withNAs and all obtained results lead to the same observations as those presented inFigs. 11A–11F. All tests fromFig. 11were run on small-worlds with 10,000 nodes.
In referenceAcemoglu et al. (2013)the authors try to solve the equations that describe the stationarity of opinion evolution by using random walks from regular agents to stubborn agents which influence their state. Even if their model is simpler than the model proposed in our paper, they have to come up with some simplifying assumptions in terms of network topology (only regular topologies are tractable) and number of agents (they solve equations on small networks and then generalize the results in a qualitative discussion). Because our paper adds significant complexity to the model (i.e., node tolerance is not a fixed threshold, but a dynamic one which depends on the interactions with neighbors), solving the stationarity equations would require even stronger simplifying assumptions. This is the reason for using simulation in order to analyze the stationarity distribution. Nonetheless, in all simulation scenarios, the obtained stationarity described in the paper coincides with one of two (mutually exclusive) cases:
• The society reachesintoleranceas overall tolerance converges towards 0 (i.e.,θ (t)≃0 fort→ ∞). When this happens, no further modifications to the state of the society can be achieved. We obtain this behavior on mesh and BA topologies. Meshes imply only local connectivity to neighbors that converge towards a similar state, thus tolerance is bound to decrease to 0 (seeFig. 7A). BA networks imply connections to hub nodes, which means that all neighbors are influenced by the same local hubs, which in turn decreases tolerance to 0 (seeFig. 9C). Such a situation, in the case of regular small networks, was already mathematically described byAcemoglu et al. (2013). The authors measure the probability of being influenced by a SA using random walks. In our case, Eq. (3)can be simplified, for the majority of nodes withθi(t)≃0, to:xi(t)=xi(t−1), so the state of the society becomes stable.
Figure 11 Simulation results for the tolerance-based opinion interaction on a small-world network with 10,000 nodes, of which are 32 green SAs and 32 red SAs.The social network consists of (A) 20% null agents, (B) 30% null agents, (C) 40% null agents, (D) 80% null agents.
change to also stabilize (fort→ ∞). We obtain this phenomenon on random and small-world topologies. Small-worlds have the unique feature of being both regular and random in a proportionp, given by the rewiring parameter of the Watts–Strogatz algorithm. Thus, nodes interact with equal probability (forp=0.5, as used in our experiments) with neighbors with similar opinion, and with distant random nodes with different opinion. A proportional valuep=0.5 will keep tolerance at maximal value as can be seen inFig. 9B. Due to the random distribution of initial opinion and links (in random networks and small-worlds withp=0.5), nodes will oscillate ergodically, and bothEqs. (7)and(8)will be activated with relatively equal probability. This keeps the tolerance variation of each node around a certain convergence value:
Phase transition in opinion dynamics
This section aims at analyzing the impact of topology, network size, interaction model, stubborn agent placement, ratio and concentration on the opinion change (ω), and on convergence towards intolerance (θ).
Simulations show that, in a society with a fixed stubborn agent distribution, the topologyτdetermines if:
• the society enters the intolerance phaseI:θ →0 (withθ <0.1), which also results in
ω→0;
• the societybalancesand never enters the intolerance phaseI:θ →θlimit, where
θlimit>0.1 and maintains a highω;
• the society continues to oscillate for 0.1< θ <1, but the tolerance level does not stabilize.
In case of the Yelp dataset, we notice that for a given topologyτ, and a network of sizeN, when the concentration of stubborn agents is bigger than a critical ratioσ, the society never becomes intolerant. In such cases, the society becomes balanced, with slight oscillation in tolerance or opinion change. The goal is therefore to find the tuples (τ,N,σ) at which this phenomenon occurs.
To obtain our results we have used five topologiesτ (mesh, random, small-world, BA and WSDD), network sizesNof 400 up to 100,000 nodes, our new tolerance interaction model, a ratio of 1:1 between green (1) and red (0) stubborn agents, and an increasing concentration of stubborn agents ranging from 1% to 36%.
Impact of topology
The tolerance and opinion change with respect to the number of stubborn agents, as depicted inFigs. 12Aand12Bhighlight a clear difference between the five topologies, namely mesh, random, small-world, BA, and WSDD. There is a total of three clearly distinguishable behaviors: aresponsivebehavior (present in small-worlds and random graphs), alinearbehavior (for mesh networks), and asaturatedbehavior (corresponding to BA and WSDD networks).
The tolerance increaseslinearlyfor the mesh, as the population of stubborn agents increases. Consequently, there is no criticalσfor which a phase transition occurs due to the high regularity of the network, but there is a visible saturation point (when the blue graph begins to drop inFig. 12A). This happens because the society is physically filled with more stubborn agents than regular ones and because all stubborn agents haveθ =0, the overall tolerance begins to drop.
and small-world topologies are equivalent with the mesh topology as the society becomes saturated with stubborn agents (i.e., seeFigs. 12Aand12Bin terms of toleranceθ and opinion changeω, respectively).
Finally, thesaturatedbehavior groups together the BA and WSDD topologies, both of which have the feature of degree-driven preferential attachment. The two topologies show smaller responsiveness to social balancing. As depicted inFigs. 12Aand12B, the critical point of stubborn agents concentration for BA is by far the greatest one (i.e.,σ =16%) and the maximum toleranceθ reached is the smallest among the simulations aiming at the impact of topology (20%). The WSDD topology shows a better response, at a much lower critical stubborn agents concentration point (σ =4%) and reaches social balance at
θ =30%.
Impact of network size
When analyzing the opinion change at society level, the same observations and classifi-cation are valid for all other network sizes. The larger the sizeNis, the more accurate the delimitation shown inFigs. 12Aand12Bbecomes.
The impact of size offers a comparison of different tolerance stabilization on the same topology. The results inFigs. 12C–12Fshow how well the social balancing effect scales with increasing sizes of the network.
The behavior of meshes, presented inFig. 12C, shows a linearly proportional increase of the critical stubborn agents concentrationσ (around 20–25%) in accordance with the network sizeN. A similar evolution is visible inFig. 12F, on networks with preferential attachment, where the requiredσ is also proportionally bigger on larger networks. In Figs. 12Dand12E, the random and small-world networks exhibit similar behavioral patterns: they achieve the critical pointσ with maximal opinion change, and then evolve towards intolerance at a pace that is corroborated withN(i.e., a slower drop in tolerance for larger networks occurs).
The results presented inFig. 12contains averages stemming from multiple experiments run in SocialSim, then processed separately in Microsoft Excel. InFigs. 12C–12F, the points on the OX axis are fixed SA concentrations which are used throughout these exper-iments, and the values on the OY axis are averages obtained from multiple runs (i.e., 10). An individual graph from one sub-figure is based on 8 (different SA concentrations)×10 experiments=80 simulations. One subfigure is the result of 3×80=240 simulations, thereforeFig. 12is based on 4×240=960 simulations. All simulations presented in this section confirm our main observations (Twitter, MemeTracker, Yelp) on opinion formation phases and phase transition towards social balancing.
DISCUSSION
(opinion source) distribution across the entire population. Overall, the topology seems to have the strongest influence on opinion formation and spread; this can be summarized by the following different tendencies:
• Responsive behavior: Tolerance stabilization is attained right after reaching a relatively low critical ratio of stubborn agents. Inserting additional stubborn agents entail a drop in autonomy and opinion flow. Such a behavior is achieved by random and small-world topologies, and it can be motivated by the uniform degree distribution and the existence of both local and long-range links, which foster opinion diversity andsocial balancing; this can be representative for a decentralized and democratic society.
• Linear behavior: The critical threshold at which tolerance becomes stable for mesh topologies increases linearly with the stubborn agents concentration. The mesh topology corresponds to a limited, almost “autistic” social interaction behavior (where each agent only interacts with close proximity neighbors); therefore, the probability of opinion diversity only increases with the proportional addition of stubborn agents. For meshes,social balancingis attained only if a substantial number of stubborn agents is inserted.
• Saturated behavior: Tolerance converges slowly around a specific low value. This behavior is achieved in BA and WSDD networks. Due to the nature of these topologies, even though long-range links exist, nodes tend to be preferentially attached to the same hub nodes, meaning the same opinion sources. The amount of stubborn agents required to reachsocial balanceis much higher and the resulting balance saturates quickly. It is thus a conservative, stratified and oligarchic type of society which reacts later and slower to new stimuli. Most individuals within this type of society remain intolerant and opinion change is treated as suspicious and non-credible.
Besides these original contributions, the results obtained with our model confirm prior studies which show how individuals converge towards the state of their ingroup (Moons et al., 2009;Van Der Schalk et al., 2011). This is especially noticeable on networks with high modularity, like the WSDD network in which every member in a community converges towards the community’s dominant opinion, yet every community converges towards a different state.
An important real-world aspect of our new tolerance model (which assumes that the level of acceptance of neighboring opinions evolves over time) is that the tolerance level of an agentθi(t)is proportional to the degree of the node. In other words, the more neighbors a node has, the more likely it is to receive different influences which can guarantee a higher tolerance level. This observation is backed up by a recent study which proves that individuals with a higher (in)degree are less likely to be influenced, and the influence of friends is not significantly moderated by their friends’ indegree and friendship reciprocity (Geven, Weesie & Van Tubergen, 2013).
observations and opinion simulation results show a similar topological self-organization based on stubborn agent topological properties.
Finally, the study of opinion dynamics through our proposed concept ofsocial balancing
shows key features that may be used in practical applications, like marketing or conflict resolution. Under the requirement of keeping the social state stable, while never reaching intolerance, we provide a classification of network topologies based on the social balancing property. Networks with the democratic small-world structure promote balancing; the phenomenon is also exhibited if there is a high concentration of stubborn agents to stabilize opinion in mesh networks. If there are significantly fewer stubborn agents in the network, balancing will only be achieved if one side is using a placement strategy to counter its rivals (Gionis, Terzi & Tsaparas, 2013). A small-world network will not offer an advantage to any of the opinions due the link layout and uniform degree distribution. On the other hand, the oligarchic scale-free topology shows a clear importance of strategically placed agents in hub nodes which intrinsically render the opposing nodes on lower levels of the tree virtually powerless. The balancing phenomenon does not occur in networks with scale-free properties. Clearly, the social balancing concept remains open for further debate, improvement, and real-world validation.
ADDITIONAL INFORMATION AND DECLARATIONS
Funding
The authors received no funding for this work.
Competing Interests
Radu Marculescu is an Academic Editor for PeerJ Computer Science.
Author Contributions
• Alexandru Topirceanu and Mihai Udrescu conceived and designed the experiments, performed the experiments, analyzed the data, contributed reagents/materials/analysis tools, wrote the paper, prepared figures and/or tables, performed the computation work, reviewed drafts of the paper.
• Mircea Vladutiu conceived and designed the experiments, analyzed the data, reviewed drafts of the paper.
• Radu Marculescu conceived and designed the experiments, analyzed the data, wrote the paper, reviewed drafts of the paper.
Data Availability
The following information was supplied regarding data availability: Our social network interaction simulator SocialSim is available at: https://sites.google.com/site/alexandrutopirceanu/projects/socialsim. and
www.cs.upt.ro/∼alext/socialsim.
The Meme Tracker dataset:
http://snap.stanford.edu/data/memetracker9.html. The Twitter dataset:
http://snap.stanford.edu/data/twitter7.html. The Yelp dataset:
http://www.yelp.com/dataset challenge.
REFERENCES
Acemoglu D, Como G, Fagnani F, Ozdaglar A. 2013.Opinion fluctuations and disagreement in
social networks.Mathematics of Operations Research38(1):1–27DOI 10.1287/moor.1120.0570.
Acemoglu D, Ozdaglar A. 2011.Opinion dynamics and learning in social networks.Dynamic
Games and Applications1(1):3–49DOI 10.1007/s13235-010-0004-1.
Acemoglu D, Ozdaglar A, Yildiz E. 2011.Diffusion of innovations in social networks. In:Decision and control and European control conference (CDC-ECC), 2011 50th IEEE conference on. IEEE, 2329–2334DOI 10.1109/CDC.2011.6160999.
Albert R, Barab´asi A-L. 2002.Statistical mechanics of complex networks.Reviews of Modern Physics74(1):47–97DOI 10.1103/RevModPhys.74.47.
Axelrod R. 1997.The dissemination of culture a model with local convergence and global
polarization.Journal of Conflict Resolution41(2):203–226DOI 10.1177/0022002797041002001.
Bandyopadhyay S, Rao AR, Sinha BK, Sinha BK. 2011.Models for social networks with statistical applications. Vol. 13. Sage.
Barab´asi A-L, Albert R. 1999. Emergence of scaling in random networks. Science
286(5439):509–512DOI 10.1126/science.286.5439.509.
Biswas S, Chandra AK, Chatterjee A, Chakrabarti BK. 2011. Phase transitions and
non-equilibrium relaxation in kinetic models of opinion formation. In:Journal of physics: conference series, vol. 297. IOP Publishing, 012004DOI 10.1088/1742-6596/297/1/012004.
Catanzaro M, Boguna M, Pastor-Satorras R. 2005.Generation of uncorrelated random scale-free
networks.Physical Review E71(2):027103DOI 10.1103/PhysRevE.71.027103.
Centola D, Macy M. 2007.Complex contagions and the weakness of long ties1.American Journal
of Sociology113(3):702–734DOI 10.1086/521848.
Chau H, Wong C, Chow F, Fung C-HF. 2014.Social judgment theory based model on opinion
formation, polarization and evolution.Physica A: Statistical Mechanics and its Applications
415:133–140DOI 10.1016/j.physa.2014.07.082.
Chen G, Wang X, Li X. 2014.Fundamentals of complex networks: models, structures and dynamics. John Wiley & Sons.
Chen Y, Zhang L, Huang J. 2007.The watts–strogatz network model developed by including
degree distribution: theory and computer simulation.Journal of Physics A: Mathematical and Theoretical40(29):8237–8246DOI 10.1088/1751-8113/40/29/003.
Clarkson JJ, Tormala ZL, Rucker DD, Dugan RG. 2013.The malleable influence of social
consensus on attitude certainty.Journal of Experimental Social Psychology49(6):1019–1022
DOI 10.1016/j.jesp.2013.07.001.
Das A, Gollapudi S, Munagala K. 2014.Modeling opinion dynamics in social networks.
Deffuant G, Neau D, Amblard F, Weisbuch G. 2000.Mixing beliefs among interacting agents.
Advances in Complex Systems3(01n04):87–98DOI 10.1142/S0219525900000078.
Deng L, Liu Y, Xiong F. 2013.An opinion diffusion model with clustered early adopters.Physica A: Statistical Mechanics and its Applications392(17):3546–3554DOI 10.1016/j.physa.2013.03.058.
Duma A, Topirceanu A. 2014.A network motif based approach for classifying online social
networks. In:Applied computational intelligence and informatics (SACI), 2014 IEEE 9th international symposium on. IEEE, 311–315DOI 10.1109/SACI.2014.6840083.
Easley D, Kleinberg J. 2010.Networks, crowds, and markets. Vol. 8. Cambridge Univ Press.
Elkind D. 1967. Egocentrism in adolescence. Child Development 38(4):1025–1034
DOI 10.2307/1127100.
Erd¨os P, R´enyi A. 1960.On the evolution of random graphs.Publications of the Mathematical Institute of the Hungarian Academy of Sciences5:17–61.
Fang H, Zhang J, Thalmann NM. 2013.A trust model stemmed from the diffusion theory for
opinion evaluation. In:Proceedings of the 2013 international conference on autonomous agents and multi-agent systems. International Foundation for Autonomous Agents and Multiagent Systems, 805–812.
Fonseca A. 2011.Modeling political opinion dynamics through social media and multi-agent
simulation. In:First doctoral workshop for complexity sciences.
Fu P, Liao K. 2006.An evolving scale-free network with large clustering coefficient. In:Control, automation, robotics and vision, 2006. ICARCV’06. 9th international conference on. IEEE, 1–4
DOI 10.1109/ICARCV.2006.345053.
Galuba W, Aberer K, Chakraborty D, Despotovic Z, Kellerer W. 2010.Outtweeting the
twitterers-predicting information cascades in microblogs. In:Proceedings of the 3rd conference on Online social networks, vol. 39. 3–3.
Geven S, Weesie J, Van Tubergen F. 2013.The influence of friends on adolescents behavior
problems at school: the role of ego, alter and dyadic characteristics.Social Networks
35(4):583–592DOI 10.1016/j.socnet.2013.08.002.
Gionis A, Terzi E, Tsaparas P. 2013. Opinion maximization in social networks. ArXiv
preprint.arXiv:1301.
Golbeck J. 2013.Analyzing the social web. 1st edition. San Francisco: Morgan Kaufmann Publishers Inc.
Gross T, Blasius B. 2008.Adaptive coevolutionary networks: a review.Journal of the Royal Society Interface5(20):259–271DOI 10.1098/rsif.2007.1229.
Guille A, Hacid H, Favre C, Zighed DA. 2013.Information diffusion in online social networks: a survey.ACM SIGMOD Record42(2):17–28DOI 10.1145/2503792.2503797.
Hegselmann R, Krause U. 2002.Opinion dynamics and bounded confidence models, analysis,
and simulation.Journal of Artificial Societies and Social Simulation5(3).
Holme P, Kim BJ. 2002.Growing scale-free networks with tunable clustering.Physical Review E
65(2):026107DOI 10.1103/PhysRevE.65.026107.
Hołyst JA, Kacperski K, Schweitzer F. 2000.Phase transitions in social impact models of opinion formation.Physica A: Statistical Mechanics and its Applications285(1):199–210
DOI 10.1016/S0378-4371(00)00282-X.
Javarone MA, Squartini T. 2014.Conformism-driven phases of opinion formation on heterogeneous networks: the q-voter model case. ArXiv e-prints
DOI 10.1088/1742-5468/2015/10/P10002.
Jian-Guo L, Yan-Zhong D, Zhong-Tuo W. 2006.Multistage random growing small-world
networks with power-law degree distribution.Chinese Physics Letters23(3):746–749
DOI 10.1088/0256-307X/23/3/061.
Kempe D, Kleinberg J, Tardos ´E. 2003.Maximizing the spread of influence through a social
network. In:Proceedings of the ninth ACM SIGKDD international conference on Knowledge discovery and data mining. ACM, 137–146DOI 10.1145/956750.956769.
Lehmann J, Goncalves B, Ramasco JJ, Cattuto C. 2012.Dynamical classes of collective attention in twitter. In:Proceedings of the 21st international conference on World Wide Web. ACM, 251–260
DOI 10.1145/2187836.2187871.
Lerman K, Yan X, Wu X-Z. 2015. The majority illusion in social networks. ArXiv
preprint.arXiv:1506.03022.
Li Y, Chen W, Wang Y, Zhang Z-L. 2013. Influence diffusion dynamics and influence
maximization in social networks with friend and foe relationships. In:Proceedings of the sixth ACM international conference on Web search and data mining. ACM, 657–666
DOI 10.1145/2433396.2433478.
Li Y, Qian X, Wang D. 2012.Extended hk evolving network model. In:Control and decision
conference (CCDC), 2012 24th Chinese. IEEE, 4095–4097DOI 10.1109/CCDC.2012.6243111.
Li L, Scaglione A, Swami A, Zhao Q. 2011.Trust, opinion diffusion and radicalization in social networks. In:Signals, systems and computers (ASILOMAR), 2011 conference record of the forty fifth asilomar conference on. IEEE, 691–695DOI 10.1109/ACSSC.2011.6190091.
Li L, Scaglione A, Swami A, Zhao Q. 2012.Phase transition in opinion diffusion in social networks. In: Acoustics, speech and signal processing (ICASSP), 2012 IEEE international conference on. IEEE, 3073–3076DOI 10.1109/ICASSP.2012.6288564.
Maxwell JC. 1993.Developing the leader within you. Thomas Nelson Publishers.
McDonald M, Wilson H. 2011.Marketing plans: how to prepare them, how to use them. Wiley. com.
Moons WG, Leonard DJ, Mackie DM, Smith ER. 2009. I feel our pain: antecedents and
consequences of emotional self-stereotyping.Journal of Experimental Social Psychology
45(4):760–769DOI 10.1016/j.jesp.2009.04.016.
Muchnik L, Aral S, Taylor SJ. 2013.Social influence bias: a randomized experiment.Science
341(6146):647–651DOI 10.1126/science.1240466.
Nyhan B, Reifler J. 2010.When corrections fail: the persistence of political misperceptions.Political Behavior32(2):303–330DOI 10.1007/s11109-010-9112-2.
Pastor-Satorras R, Vespignani A. 2001.Epidemic spreading in scale-free networks.Physical Review Letters86(14):3200–3203DOI 10.1103/PhysRevLett.86.3200.
Riolo RL, Cohen MD, Axelrod R. 2001.Evolution of cooperation without reciprocity.Nature
414(6862):441–443DOI 10.1038/35106555.
Roccas S, Amit A. 2011.Group heterogeneity and tolerance: the moderating role of conservation
values.Journal of Experimental Social Psychology47(5):898–907DOI 10.1016/j.jesp.2011.03.011.
Ruan Z, Iniguez G, Karsai M, Kertesz J. 2015. Kinetics of social contagion. ArXiv preprint.arXiv:1506.00251.
Saito K, Ohara K, Yamagishi Y, Kimura M, Motoda H. 2011.Learning diffusion probability based