Fiabilitate si Durabilitate - Fiability & Durability No 1/ 2012 Editura “Academica Brâncuşi” , Târgu Jiu, ISSN 1844 – 640X 8
GRAPHIC INTERFACES FOR ENGINEERING APPLICATIONS
Assoc. Prof. PhD. Eng. Ion PANA, Petroleum and Gas University Ploieşti, e-mail: ion.pana@upg-ploiesti.ro
Abstract. Using effective the method of calculating Fitness for Service requires the achievement of graphical interfaces. This paper presents an example of such interfaces, made with Visual Basic program and used in the evaluation of pipelines in a research contract [4].
Key words: Visual Basic, out of roundness, graphic interface.
1.INTRODUCTION
Assessment of pipelines by the method Fitness for service requires the procedures of standard API 579 [3]. The application of these procedures involves the following aspects: - It has to handle a large volumes of data from inspections;
- The assessment is quite laborious, using more formulas, tables, databases; - It requires good knowledge of assessment methods.
Because of the reasons exposed above (for the procedures of API 579) is best to use graphical interfaces. In the contract [4] this method was applied to evaluate pipelines used to transport liquid petroleum products. They have been made more graphical interfaces, using Visual Basic program [1, 2] of which it was chosen for exemplifying the interface on assessing of the influence of the deviation from the geometric shape (the easiest). The article is based on the procedure, so for a complete meaning this has to be known [3, 5].
2.GRAPHIC INTERFACE FOR ASSESSING EFFECTS OF DEVIATION FROM THE GEOMETRIC SHAPE IN PIPELINES TO LEVEL 1
There are three levels of assessment in [3]. In [4] there were realized graphic interfaces for Level 1 and 2. Simple calculations based on the assessment of fault geometry (length, depth, width, average depth, position relative to other faults) are recognized as standards assessment Level 1. More nuanced assessments, which are resolved by the use of procedures, and computer programs, qualify for Level 2. Another assessment, Level 3, based on modeling the defect region using finite element method is possible, being used with good results.
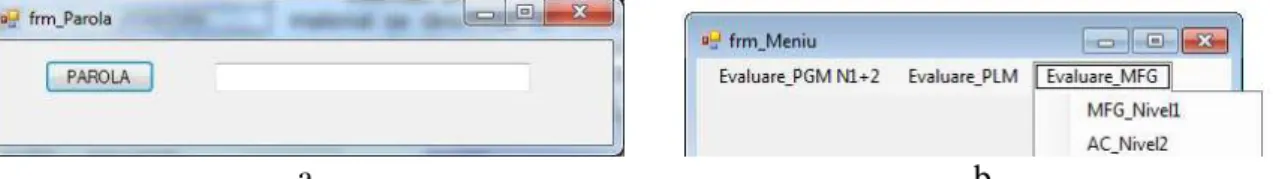
a b
Fig. 1. Launch of the project: a) the form for your password, b) the project menu.
Fiabilitate si Durabilitate - Fiability & Durability No 1/ 2012 Editura “Academica Brâncuşi” , Târgu Jiu, ISSN 1844 – 640X 9
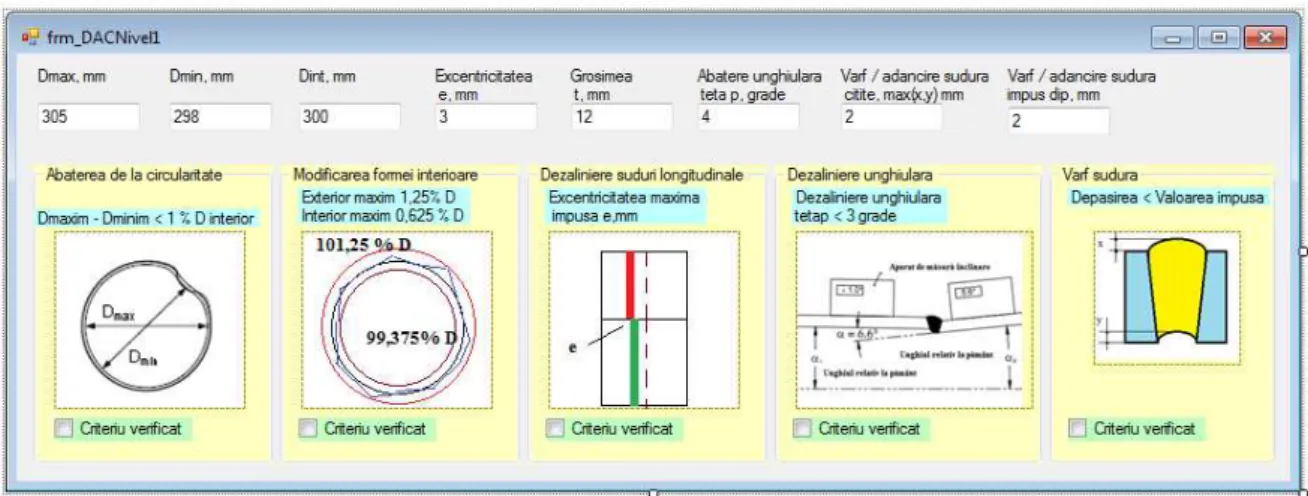
Pressing menu Evaluare MFG > MFG_Nivel1 are released the form from Fig. 2. Now we will turn to describe the graphic elements.
The interface has eight top text boxes in which are introduced the following data: - Maximum diameter of the pipe, Dmax [mm];
- Minimum inside diameter of the pipe, Dmin [mm]; - Average diameter pipe, Dint [mm];
- Eccentricity, e [mm];
- Nominal pipe thickness, t [mm]; - Pipe joint angular deviation, θp [ °];
- Top or lack of material from the weld [mm];
- Top or lack of material from the weld admitted dp[mm].
Fig. 2. Local interface material loss calculation in the two, according to API 579 / 2007.
Figures on the form suggest the checking that are made at the Level1. If this check is performed with a positive result then the checkbox next to the name Criteriu verificat
automatically tick, other else it remains blank.
3.GRAPHIC INTERFACE FOR ASSESSING EFFECTS OF DEVIATION FROM THE GEOMETRIC SHAPE IN PIPELINES TO LEVEL 2
The graphic interface to evaluate the effects of deviations from the geometric shape (Level 2) opens from the menu, Fig. 1.b. Pressing menu Evaluare MFG > MFG_Nivel2 are released the form from Fig. 3. Now we will turn to describe graphic elements.
1) The zone Caracteristici geometrice has the following tools:
• Label Diametru interior mediu, D[mm], which marks the text box that will contain the average inner diameter;
• The label Diametru interior maxim, Dmax[mm], which marks the text box that will contain maximum inside diameter;
• The label Diametru interior minim, Dmin[mm] , which marks the text box which will introduce minimum inside diameter;
Fiabilitate si Durabilitate - Fiability & Durability No 1/ 2012 Editura “Academica Brâncuşi” , Târgu Jiu, ISSN 1844 – 640X 10
• The label Abaterea de execuţie MA [mm], which marks the text box to store the deviation of execution;
• The label Factorul abaterii de la circularitate Cf [-], which marks the text box with the value of factor of deviation from circularity;
• The label Factorul de caracterizare a tensiunii AC, Hf [-], which marks text box that will characterize the amount of tensile factor.
2) The zone Pierdere material exterioară has two exclusive buttons:
The button Pierdere uniformă de metal în afara LTA , LOSS [mm], which marks the text box where we will introduce uniform loss of metal outside the LTA (Law Thick Area),
LOSS;
The button Pierdere uniformă de metal în afara LTA , LOSS [mm], which marks the text box where we will introduce the uniform thickness of metal outside the LTA, the parameter of calculation trd.
The mode of calculus of the parameter tc (calculus thickness) depends on these buttons. By
clicking Pierdere uniformă de metal în afara LTA , LOSS [mm], respectively Pierdere
uniformă de metal în afara LTA , LOSS [mm], is calculated tc with the corresponding formula
of [3] Annex A2.
Fig. 3. Local interface material loss calculation in the two, according to API 579 / 2007.
3) The zone Valori de calcul , it allows you to store: the input data used in the application and the calculated values during the evaluation by pressing the SALVARE fişier. By pressing the button DESCHIDERE fisier, it allows you to open a previously saved data set. These data are automatically placed in boxes and can be used as a set of values from previous assessment information. The files are text files and can be saved / placed into / from any file on your computer. In the list on this area can see the data entered / saved. By clicking on this zone it will empty the list of values. Zone Valori de calcul also includes a text box Comentarii date
in which data user can enter their comments, that will be stored in the data file characterizing the case study.
Fiabilitate si Durabilitate - Fiability & Durability No 1/ 2012 Editura “Academica Brâncuşi” , Târgu Jiu, ISSN 1844 – 640X 11
5) The zone Aproximarea razei interioare (Fourier) allows the calculation of Fourier coefficients for the formula used to determine the inner radius of the pipe section according to the current angle. These coefficients are used for calculating the ratio between of bending effort due the deviations from circularity on the efforts due to the pressure.
• The label Raza interioară măsurată RAD [mm] which marks the text box in which will be placed successively the values of inner radius of analyzed profile.
• The list lstValRAD, which will preserve the values of the radius of the cross section considered. For evaluation were considered 24 values. On this area is a label 24 puncte that attracts the attention of to 24 points that have to be introduced. If it will be introduced a different number of values at runtime an error message appears.
• The label Nr. valori RAD adăugate that marks the text box where it will be entered the number of the values of radius added to the list lstValRAD from the analyzed profile.
• The button ADAUGA RAD, pressing this button the value from the text box Raza interioară măsurată RAD [mm] is put on the list lstValRAD and the text box Nr. valori RAD adăugate is updated at the current number of values entered.
• The button CALCUL COEF. FOURIER, pressing this button makes the calculation of the Fourier series coefficients.
If you have a mistake, then click on the label Nr. valori RAD adăugate and the last value from the list lstValRAD will be deleted and the number of value from this list ( textbox Nr.
valori RAD adăugatewill be updated).
6) The button EVALUARE AC Nivelul2, pressing this button makes the evaluation of out of roundness. It displays the result evaluation.
4. CONCLUSIONS
Using of graphical user interfaces is a quick tool for analyzing large data sets. In a company that has as main activity the transport of petroleum products through pipelines, using such instrument reduces costs related to the use of specialized companies to analyze data, selects cases in which intervention is needed on the pipeline, makes the prescription of cases which could become critical in a given period of time.
REFERENCES
1. Petroutsos E. Mastering Microsoft Visual Basic® 2010, Wiley Publishing, Inc., Inc. Indianapolis, Indiana, 2010.
2. Willis T., Newsome B. Beginning Microsoft Visual Basic 2010, Wiley Publishing, Inc. Indianapolis, Indiana, 2010.
3. * * *. API Standard 579 – Recommended practice for Fitness–For–Service and continued operation of equipment (piping, vessels and tanks), API, Washington, 2007.
4. Minescu M., Pană I. ş.a. Realizarea unei proceduri de evaluare a conductelor prin
metoda Fitness for Service în conformitate cu standardul API 579, contract de
cercetare nr. 58/21.12.2010, executant UPG Ploieşti, beneficiar S.C. Conpet S.A. Ploieşti.
5. Pană. I. Evaluation of the Pipelines by the Method Fitness for Service, 4th Symposium