57
The drift and spreading of the Runner 4 oil spill and the ice conditions
in the Gulf of Finland, winter 2006
Keguang Wang
a, Matti Leppäranta
a, Maria Gästgifvars
b, Jouni Vainio
c, and Caixin Wang
aa
Division of Atmospheric Sciences and Geophysics, Department of Physics, University of Helsinki, P.O. Box 64, FI-00014 Helsinki, Finland; [email protected], [email protected], [email protected]
b
Finnish Environment Institute, P.O. Box 140, FI-00251 Helsinki, Finland; [email protected] c
Finnish Institute of Marine Research, P.O. Box 2, FI-00561 Helsinki, Finland; [email protected]
Received 14 May 2008, accepted 25 June 2008
Abstract. The drift and spreading of the Runner 4 oil spill in the ice-covered Gulf of Finland is analysed. The oil spill was caused by the sinking of the Dominican-registered cargo ship Runner 4 on 5 March 2006, after collision with the Malta-registered cargo ship Svjatoi Apostol Andrey. This oil spill was very difficult to detect in the first week due to severe ice conditions. Combating operations started when the wind pushed the ice floes away and the spill was observed in open sea areas. Two efforts were made to collect and control the oil spill, one during 15–19 March and the other on 9 April. A sea ice dynamics model is employed to simulate the evolution of the ice conditions. A comparison between the oil spill coverage and the sea ice movement suggests that part of the oil followed with the ice while the other part of it must have drifted together with the surface current. The observations also show that the oil was continuously leaking from the hole in the left side of the Runner 4, at least until 9 April.
Key words: Runner 4 oil spill, sea ice, drift, spreading, Gulf of Finland.
INTRODUCTION
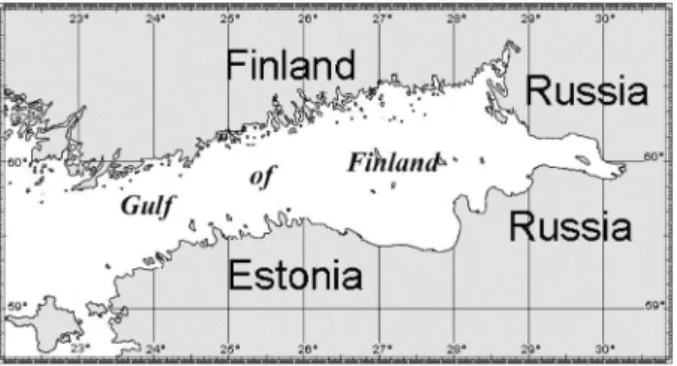
The Gulf of Finland is a brackish-water basin in the eastern part of the Baltic Sea, approximately 400 km long, 58–135 km wide, with an area of about 30 000 km2 and mean depth of 37 m. It opens to the Gotland Sea in the west, bordering Finland, Russia, and Estonia in the north, east, and south, respectively (Fig. 1). The Gulf of Finland is one of the world’s most intensive shipping areas, embracing the ports in St. Petersburg, Helsinki, and Tallinn, as well as large oil terminals such as Primorsk, Porvoo, and Muuga. In recent years oil transportation has experienced a rapid increase with the
Fig. 1. Topography of the Gulf of Finland.
opening of new oil terminals in the basin. Consequently, oil transportation, and cargo and passenger traffic are to encounter higher risks, particularly during the dark and icy winter situations.
Ice forms in the Gulf of Finland annually, and the length of the ice season is 3–5 months. In mild winters, ice mainly forms in the eastern part and along the coastal regions, while in normal and severe winters the whole basin freezes over (Leppäranta & Myrberg 2008).
57
enhancing our capability of monitoring and combating oil spills.
WEATHER AND ICE CONDITIONS IN THE GULF OF FINLAND
Climatology
The Gulf of Finland is a long and narrow basin, with a complex coastline and a large number of islands on the Finnish side but with a quite smooth and open coastline on the Estonian side (Fig. 1). Consequently, landfast ice often occupies a significant area along the northern coast in normal and severe winters, making the drift ice zone even narrower. As a result, pack ice may immediately compress against the coast or the fast ice zone. The ice thickness in normal winters is 30–80 cm, increasing towards the east.
Ice season 2005/2006
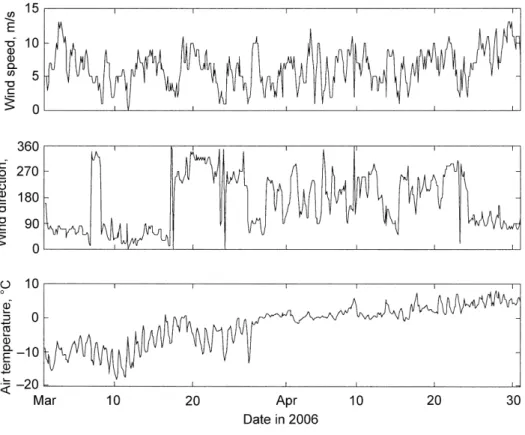
The Baltic Sea ice conditions were normal in winter 2005/2006. The wind speed, wind direction, and air temperature at Helsinki in March and April, collected by Finnish Meteorological Institute (FMI 2006), are
shown in Fig. 2. As can be seen, the wind speed varied largely; the mean wind speed was 6.4 m s–1, and the maximum speed was 13 m s–1. However, the wind direction appeared to be more persistent. An easterly wind predominated on 1–17 March, then a northwesterly wind prevailed on 17–26 March, and finally a southerly wind predominated from 27 March to 22 April. When compared with the Estonian Muuga Station (Tarmo Kõuts, pers. comm.), the wind directions were generally of little difference but the wind speeds occasionally differed by about 20%. The air temperature was below 0°C in March, but increased to above 0°C in April.
According to the ice charts from the Finnish Institute of Marine Research (FIMR 2006), ice first appeared in the eastern Gulf of Finland at the beginning of December 2005, approximately one week earlier than average. In the western part ice first appeared after mid-December, which is the average time. At the beginning of January 2006 the weather was mild and little new ice was formed in the Gulf of Finland. The weather became colder at the end of January and new ice spread soon from the eastern part to the west. The ice conditions remained similar in February, but at the beginning of March a long cold period commenced and more ice was rapidly formed. As a result, a large part of the Gulf of
Finland was soon covered by ice and this situation persisted for five weeks. In April the weather was cool and the ice melted slowly. The ice finally disappeared at the beginning of May, more than one week later than average.
DRIFT AND SPREADING OF THE RUNNER 4 OIL SPILL
The oil spill resulted from the sinking of the Dominican-registered cargo ship Runner 4 on 5 March 2006. The ship was then carrying a cargo of aluminium, travelling together with the Malta-registered cargo ship Svjatoi Apostol Andrey in the eastern basin, piloted by a Russian ice breaker. There were 102 tonnes of heavy fuel oil, 35 tonnes of light fuel oil, and 600 litres of lubricant oil on the ship. At site 26°19.84′E and 59°52.92′N, the Runner 4 was collided by the Svjatoi Apostol Andrey, and sank into the Gulf of Finland on the night of 5 March.
The Runner 4 oil spill appeared right after the sinking, however, it was very difficult to detect in the first week due to severe ice conditions. Combating operations started when the wind pushed the ice floes away and the spill was observed in the open sea areas. Two combating efforts were made to collect and mitigate the oil, one during 15–19 March, and the other on 9 April. The whole oil spill event can therefore be divided into four periods; in addition to the two combating periods, there were two free-evolution periods, namely 5–14 March and 20 March–8 April.
The Runner 4 oil spill during 5–14 March
The location of the wrecked Runner 4 is shown with the cross in Fig. 3. As can be seen, the Gulf of Finland was then almost fully covered by ice, with typical ice thickness of 40–50 cm at the wreckage site. The ship channels can be clearly seen in the image, as shown by the meandering white lines passing through the basin from west to east. During the first days the oil was either beneath the ice cover or mixed with the broken ice, making it rather difficult to detect.
On 12 March the Estonian Border Service established two oil slicks off the northern coast of the Pärispea Peninsula, possibly oil spills No. 4 and No. 5 in Fig. 4. However, no detailed observation was available.
The Runner 4 oil spill during 15–19 March
At the noon of 15 March 2006 observations of the oil spills were made by using aerial surveillance and combating vessels (HELCOM 2006). The results are shown in Fig. 4 together with the ice conditions (note that the ice data are for 13 March). Five main oil patches were identified, all in the routes of vessels sailing in an east–west direction across the Gulf of Finland. Patches No. 1 and No. 2 were rather close to the site of the wrecked Runner 4. Patch No. 1 was seen in the open water as rainbow-coloured slick, whereas the others were seen as brown oil mixed with ice. The oil-covered areas of Nos 1–4 were all around 0.01 km2, whereas that of No. 5 was about 0.09 km2.
57
It is so far unclear when patches No. 1 and No. 2 first appeared. However, due to the continuous easterly wind blowing during 5–15 March, it is likely that these two oil patches were just arising from the wrecked ship. Oil patches No. 4 and No. 5 were about 40– 50 km away from the site of the wrecked Runner 4. This means that they were drifting at an average speed of about 5 cm s–1.
In-situ observations (HELCOM 2006) show that the spills contained both light and heavy fuel oil, which stained a large area of the ice field (Fig. 5). It was also noticed that the drifting oil tended to accumulate on ice edges.
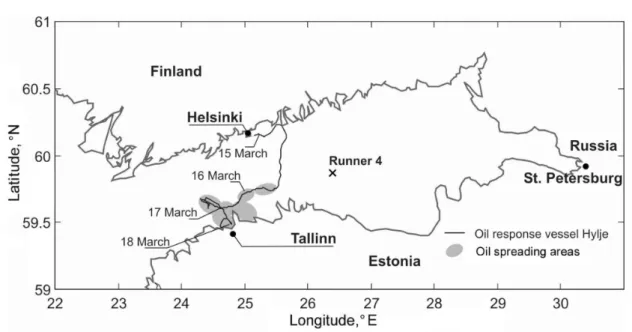
Three Finnish vessels, the Seili, Halli, and Hylje participated in the combating of the oil spill. Figure 6 shows the track of the Hylje during 15–18 March 2006. It started from Helsinki on the night of 15 March, and encountered oil patch No. 3 on the afternoon of 15 March. The ship was then operating continuously collecting oil. On 19 March the wind pushed the oily field of ice southward to the Estonian shore, and the large oil-combating vessels were unable to work near the shoreline due to the shallow water. As a result, these three vessels returned home. They managed to collect nearly 15 m3 of oil during the combating operations.
The oil spreading area was identified to be over 500 km2, as shown by the grey area in Fig. 6. It was much larger than the area covered by oil patches Nos 1–5. Earlier model studies have shown that such a large area is unlikely to have formed due to pure spreading
of the five oil patches within 5 days (Wang et al. 2007). How it was formed is still a question requiring further studies.
Fig. 5. The special oil recovery vessel Halli worked to collect oil from the icy Gulf of Finland on 16 March 2006 (photo courtesy by Hannes Heikura/Helsingin Sanomat).
Figure 7 shows the ice conditions in the Gulf of Finland on 17 and 20 March 2006. When combined with Fig. 3 we can see that the ice was drifting downwind to the west during 13–17 March (Fig. 7a), whereas it drifted towards the Estonian coast during 17–20 March (Fig. 7b). This is more clearly seen in the western part of the basin. The ice displacement agrees well with the in-situ oil spill observations (HELCOM 2006), which showed the oily ice approaching the Estonian coast and entering Tallinn Bay.
The Runner 4 oil spill during 20 March–8 April
A westerly wind dominated during 20–26 March; it then turned to an easterly direction and remained so until 29 March. As a result, the sea ice was first pushed to the Estonian coast and then drifted to the west. When comparing the ice conditions on 26 March (Fig. 8) with those on 20 March (Fig. 7b), it can be seen that the open water in the middle of the gulf was almost fully covered by ice after 6 days. In addition, the size of the drift ice area also increased, due to the formation of new ice in the north, as shown by the grey area in Fig. 8. This result is consistent with the low air temperature during 20–26 March (Fig. 2).
Figure 9 shows the ice conditions on 27 March in Tallinn Bay, which was fully covered by heavy rubble ice. There was no systematic observation of the oil spill, but it is clear that a large amount of oil was still in and under the ice.
In April the air temperature increased to above the freezing point (Fig. 2) and the sea ice melting phase commenced. The wind was predominantly from southerly directions and the ice pack drifted to the Finnish side of the basin. The ice cover on the west side had almost totally melted away.
The Runner 4 oil spill on 9 April
The second survey was made by the Finnish Coast Guard over the sinking site of the Runner 4 in the morning of 9 April 2006. It was discovered that oil was still continuously surfacing from the wreckage. The oil was in the open water, with some scattered ice floes drifting nearby (Fig. 10), while more compact ice cover was about 500–600 m away. It was also reported that the oil slick was very thin.
The Finnish vessels Merikarhu and Hylje started the oil spill collection operation at the Runner 4 site after mid-day on 9 April. Both the helicopter crew and the crew of the Merikarhu judged that the oil slick was composed of light oil. This was further confirmed when the Merikarhu crossed the thickest oil slick.
A report from an Estonian surveillance late in the afternoon showed that the situation was much better than a day before. The oil slicks were much smaller and thinner. The Merikarhu and Hylje therefore aborted the oil collection and only the Estonian oil-combating ship Kati stayed to finalize the operation.
57
(a)
(b)
Fig. 7. Ice conditions in the Gulf of Finland: (a) on 17 and (b) on 20 March 2006. Image courtesy of MODIS Rapid Response Project at NASA/GSFC.
SEA ICE MODELLING FOR THE RUNNER 4 CASE
Observations of oil spill in pack ice indicate that at low ice compactness, oil and ice tended to move in different directions and at different speeds, while at higher ice compactness they tended to move together (Deslauriers 1979; Ross & Dickins 1987; Vefsnmo & Johannessen 1994). However, these results are mainly from the cases of oil spilled onto the sea surface. For the present Runner 4 case, it is so far unclear how the oil arose to the sea surface through the complicated sea current, since it was spilling from the sea bottom. Apparently,
such cases are not uncommon in the Gulf of Finland (e.g. Hirvi 1990). Due to the complexity of the whole process, we confine our focus here on the sea ice dynamics, because the ice compactness was in most time high, which implies a united drift between the oil and the ice. In such a case, we can basically assess the drift and the spreading of the oil spill by comparing the drift of ice and the oil spill coverage. For this purpose, the period of 13–20 March is chosen for the simulation because of more observations available. A full simulation of the sea ice dynamics for the Runner 4 case is being prepared and will be published in a forthcoming paper.
Fig. 9. Ice conditions in Tallinn Bay. The oil in the ice can be clearly seen (photo courtesy by Peeter Langovits/Postimees).
57
The model used for this investigation is the three-level ice dynamics model (Wang et al. 2003, 2006). It has been successfully applied to simulate the ice dynamics in the Gulf of Riga (Wang et al. 2003) and Pärnu Bay (Wang et al. 2006). The model solves sea ice momentum balance by employing the viscous-plastic rheology of Hibler (1979). The evolution of the sea ice mass field (ice thickness and compactness) is accomplished through the advection and redistribution of level ice and deformed ice (see Wang et al. 2006 for details). The model grid is 1 nautical mile and the time step is 20 min. The wind forcing is the record at Helsinki (Fig. 2). No ocean model is applied and the water current is all set to be 0. The initial ice thickness and compactness are from the digitized ice chart of the
Finnish Institute of Marine Research (FIMR 2006). On the west open boundary it is set that sea ice can freely drift out, whereas no ice may enter the model domain. This is in general in accordance with the real ice conditions, as the water temperature there was in most time above the freezing point.
The modelled ice cover during this period is shown in Fig. 11. As can be seen, the simulation captures the main processes of the ice cover. The ice in the eastern part remains almost unchanged, agreeing very well with the ice charts (see Fig. 7). In the western part the simulated thinner ice cover, originally close to the Finnish coast on 13 March, gradually moves westward until 17 March, whereas it drifts to the Estonian coast afterwards. This process is consistent with the ice
Fig. 11. Simulated total ice thickness field from 13–20 March 2006, starting from 12:00 of 13 March. The right side of each sub-figure shows the ice thickness scale in centimetres.
Initial thickness, cm 24-hour forecast
48-hour forecast 72-hour forecast
96-hour forecast 120-hour forecast
144-hour forecast 168-hour forecast
24 26 28 30 24 26 28 30 Longitude, °E Longitude, °E
charts and the in-situ observations. When compared with a previous simulation (Wang et al. 2007), it is seen that the present simulation agrees much better with the satellite image on 17 March. The initial field of the previous simulation (covering 15–20 March) was not well updated due to the heavy cloud on 15 March.
The drift trajectories of the ice floes are calculated using the Lagrangian formulation, with the initial locations identical to oil patches Nos 1–5. Denote X as the position of an ice floe, and x as the location in the Eulerian model grid. Thus for a given continuous velocity field, u x( , ),t the new position of the ice floe can be described as
( , ) ( , ) ( ( , ), )d ,
t t
t
n t t n t n t t t
+∆
′ ′ ′
+ ∆ = +
∫
X X u X
(1)
where n denotes No. n ice floe (initially identical to No. n oil patch), t is time, and ∆t is the time step. The new position is calculated using the mid-point scheme for the integral in Eq. (1) such that
*
( ,n t+ ∆t)= ( , )n t + ( ( , ), )n t t ∆t,
X X u X (2)
where
*
( , ) ( , ) ( ( , ), ) . 2
t
n t = n t + n t t ∆
X X u X (3)
The velocity u in the above equations is determined using the bilinear interpolation from the modelled velocity field.
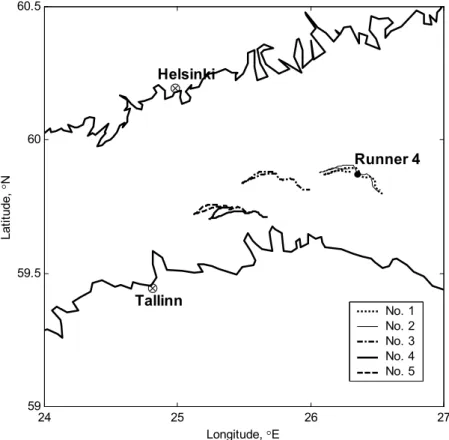
The calculated drift trajectories of the ice floes are shown in Fig. 12. Despite the different initial ice fields used, these trajectories are very close to the previous ones covering the period of 15–20 March 2006 (Wang et al. 2007). The simulated ice floes are all drifting east to Tallinn, which is markedly different from the observed oil spill which finally reached Tallinn Bay (see Fig. 6). A more detailed simulation, in particular with a coupled ice-ocean model, of the sea ice dynamics is therefore highly desirable.
The above model studies show that the drift of the five oil patches cannot reach Tallinn Bay if spreading
24 25 26 27
59 59.5 60 60.5
Longitude, °E
L
a
ti
tu
d
e
, °
N
⊗ Helsinki
⊗ Tallinn
•
Runner 4
No. 1 No. 2 No. 3 No. 4 No. 5
57
effect is excluded. This raises the question of how the oil spill patches spread to cover such a large area within a couple of days. There may be several explanations. Firstly, oil spills Nos 3–5 were mostly in the ship channel where oil could drift almost freely under the wind and currents, whereas the simulated ice drift was based only on wind forcing. Secondly, the spreading of the oil may have contributed to it finally reaching Tallinn Bay. Thirdly, the oil was continuously rising from the wrecked ship and reaching the bottom of the ice cover, which may have drifted under the ice pack due to the current. There is so far no other data capable of verifying these arguments, hence further model studies are strongly recommended to construct an overall consistent view.
CONCLUDING REMARKS
This paper concentrates on the drift and spreading of the Runner 4 oil spill in the ice-covered Gulf of Finland on 5 March–9 April 2006. The observations were from the in-situ oil-combating vessels and aerial surveillance of the oil spill. Depending on the oil spill evolution status, the whole process was separated into two combating periods, 15–19 March and 9 April, and two free-evolution periods, 5–14 March and 20 March–8 April. The oil spill was observed to be mixed light and heavy fuel oil during the first combating period, but it was seen to be pure light fuel oil during the second combating period. The oil was continuously leaking from the shipwreck and drifting with the pack ice during the whole event.
Due to the difficulties in detecting oil spill under thick ice cover, it is thus far not fully clear how the oil spread to cover such a large area of over 500 km2. In order to estimate the contribution from the drift and spreading of the oil, the evolution of the ice conditions during the first combating period was simulated, since traditionally the drift of oil spill is considered to be equivalent to the drift of sea ice when ice compactness is higher than 80%. However, the simulations showed that the drift of the sea ice during this period was mainly occurring east of Tallinn Bay, which is of considerable difference from the in-situ observed oil spill which finally entered Tallinn Bay. Further studies, in particular with an ice-ocean coupled model, are therefore highly desirable.
ACKNOWLEDGEMENTS
The authors are grateful to Jouko Pirttijärvi and Heli Haapasaari of the Finnish Environment Institute, the
crews of the Finnish Frontier Guard, Captain Ilkka Lahtinen, Pilot Jukka Peitsala, and Operators Juho Ala-Lahti and Jouko Peltoniemi for careful observation of the oil spills. Thanks are also due to Ants Erm and Meri Hietala for their useful comments. The MODIS Rapid Response System and European Space Agency are thanked for kindly providing the satellite images. The support of the Kone Foundation of Finland, the Maj and Tor Nessling Foundation of Finland, and the Estonian Academy of Sciences is gratefully acknowledged.
REFERENCES
Deslauriers, P. C. 1979. Observations of oil behaviour in ice floes and the 1977 Ethel H. Spill. In Proceedings of the Workshop on Oil, Ice and Gas, 10–11 Oct. 1979. University of Toronto, Institute of Environmental Studies, Publ. No. EE-14, pp. 87–94.
[FIMR] Finnish Institute of Marine Research. 2006. Ice Chart 2005/2006. Helsinki.
[FMI] Finnish Meteorological Institute. 2006. Weather Data. Helsinki.
[HELCOM] Helsinki Commission. 2006. Pollution Observation Log. Helsinki.
Hibler III, W. D. 1979. A dynamic and thermodynamic sea ice model. Journal of Physical Oceanography, 9, 815–846. Hirvi, J.-P. 1990. The oil spill in the Gulf of Finland in 1987.
In IAHR Ice Symposium 1990, Vol. 3, pp. 127–141. Espoo, Finland.
Leppäranta, M. & Myrberg, K. 2008. The Physical Oceano-graphy of the Baltic Sea. Springer-Praxis [in press]. Ross, S. L. & Dickins, D. F. 1987. Field Research Spills
to Investigate the Physical and Chemical Fate of Oil in Pack Ice. Environmental Studies Revolving Fund Report, No. 62. Department of Energy Mines and Resources, Ottawa, Ont., 118 pp.
Vefsnmo, S. & Johannessen, B. O. 1994. Drift and spread of oil in broken ice – field experiment. In IAHR Ice Symposium 1994, pp. 302–314. Trondheim, Norway. Wang, K., Leppäranta, M. & Kõuts, T. 2003. A sea ice
dynamics model for the Gulf of Riga. Proceedings of the Estonian Academy of Sciences, Engineering, 9, 107–125. Wang, K., Leppäranta, M. & Kõuts, T. 2006. A study of sea
ice dynamic events in a small bay. Cold Regions Science and Technology, 45, 83–94.