ISSN 11222211--11227733, E-ISSN 22006655--3344009 Article 9 no. 225522111111--669933
http://istgeorelint.uoradea.ro/Reviste/Anale/anale.htm
A
A
N
N
A
A
S
S
S
S
E
E
S
S
S
S
M
M
E
E
N
N
T
T
O
O
F
F
H
H
O
O
U
U
S
S
I
I
N
N
G
G
A
A
N
N
D
D
N
N
E
E
I
I
G
G
H
H
B
B
O
O
U
U
R
R
H
H
O
O
O
O
D
D
Q
Q
U
U
A
A
L
L
I
I
T
T
Y
Y
C
C
O
O
N
N
D
D
I
I
T
T
I
I
O
O
N
N
I
I
N
N
I
I
L
L
E
E
S
S
A
A
,
,
N
N
I
I
G
G
E
E
R
R
I
I
A
A
A
Addeewwaallee OOlluuffuunnlloollaa YYOOAADDEE
Department of Urban and Regional Planning, Wesley University of Science and Technology, P.M.B. 507 Ondo, Ondo State, Nigeria, e-mail: yoadewale@yahoo.com
O
Ollaabbiissii OOmmoowwuummii AADDEEYYEEMMII
Department of Town and Regional Planning Federal Polytechnic Ado-Ekiti, Ekiti State, Nigeria e-mail: fisusibisi@yahoo.com
B
Baabbaawwaallee AA.. AADDEEYYEEMMII
Department of Geography, Adeyemi College of Education Ondo, Ondo State, Nigeria e-mail: adeyemibabawale@yahoo.com
Abstract: Quality housing is the goal of all localities; such assurance reflects a community’s ability to respond to the needs of its citizens, as well as to accommodate growth and economic development. This paper focuses its study onhousing and neighbourhood quality condition in Ilesa, Nigeria.Data for the study were generated from both primary and secondary sources.204 households were surveyed using multi-stage sampling. Information was obtained on basic socioeconomic, housing and environmental characteristics of the respondent‘s household. The study reveals that more than half 54.3% of the respondents have open drainage in their neighbourhood, 33.8% have covered/buried drainage while the remaining 11.9% have soak away in their buildings. The finding reveals that 45.6% of the respondents are inherited occupier if their building, 34.4% of them is tenancy while the remaining 20.0% are owner occupier. However, positive and direct relationship exists between income and housing type (p = 0.000; r = 0.711), educational attainment (p = 0.000; r = 0.647) and type of toilet (p = 0.000; r = 0.556). It was recommended among others that there should be activation in the senses embraces the emergence of citizens who will be aware of their environmental problems, who will believe changes are not only possible but feasible, and who will have a keen desire to change and accept changes.The paper therefore concludes that if the trend continues sustainable development in the area will remain unattainable.
Key words: housing, neighbourhood, environment, quality and urban
* * * * * *
INTRODUCTION
The most visible and obvious consequences of urbanisation in developing countries, such as Nigeria, is often rapid deterioration of urban housing and living conditions (UNCHS, 2014). This is traceable to the fact that urbanisation leads to explosive population growth, which is
occasioned by a phenomenal leap in the quantitative housing needs of the populace (Akkufo, 2006). The housing needs are not matched by effective demand since the large majority of the populace does not have the wherewithal for adequate housing. In Nigeria, the rate of provision of new housing stock has lagged severely behind the rate of population growth resulting in staggering housing deficit (Agbola, 2006) requiring an annual production of more than 70,000 housing units to cope with the population trend (Agbola, 2006; Adedibu, 1980; Egbunjobi, 1987; Jelili et al., 2006; Mabogunje, 1990).
However, rapid increase in the population of urban centres has resulted in an increase in the cost of living because of higher demand on urban commodities. There is a dearth and high cost of urban land, and high cost of housing, which is often in short supply and out of the economic reach of the majority of the urban households (Olayiwola et al., 2006). The urban centres are populated by a large mass of people on low wage and who face irregular employment. This segment of the urban population is indeed poor, and is constrained to limited, insufficient, crowded, cold and dirty shelter and a generally degraded environment (Mabogunje, 1980; Olotuah, 2006; Onokerhoraye, 1995). These are the urban poor who are subjected to a life characterized by precarious conditions of nutrition and health, little or poor material possessions (UNHS, 2008; World Bank, 1995).
Wahab (1990) has succinctly shown that most urban centres in Nigeria are characterized by high densities of buildings, the crowding of large numbers of people into those buildings, lack of space for open air living between houses, poor health, substandard housing, and acute environmental and sanitary problems. Therefore, resulting to shortage of affordable and decent accommodation for the urban poor is thus a major housing problem in Nigeria.
Studies have shown the deplorable conditions of urban housing in Nigeria (Egunjobi, 1987; Jelili et al., 2006; Mabogunje, 1980; Olotuah, 2006; Yoade, 2012). The studies affirm that 75% of the dwelling units in urban centres in Nigeria are substandard and the dwellings are sited in slums. The inadequacy of the quality of most of urban housing stems mainly from the poor physical state of the buildings. The studies further show that the buildings are often unsafe and insecure and do not provide adequate shelter from the elements of weather.
This paper examines to what extent the level of housing and neighbourhood quality condition of anemerging but traditional city in a typical African setting is capable of bringing about sustainable development. With a specific focus on Ilesa, Nigeria; hopefully, this work will add to the general body of knowledgeand aid effective physical planning policy formulation for Nigerian and Third World cities.
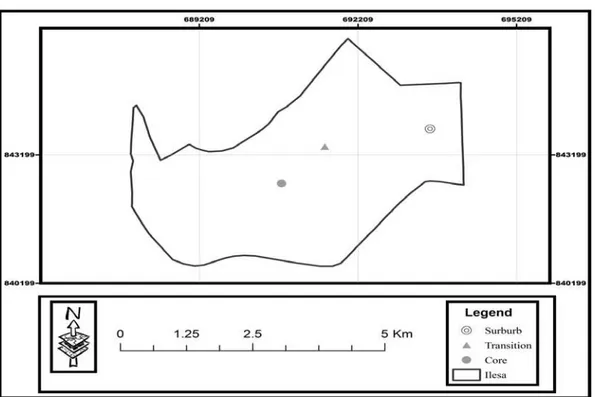
STUDY AREA
Figure 1. Map of Ilesa showing the study area (2015)
LITERATURE REVIEW
URBAN GROWTH IN NIGERIA
Urbanization is defined as the agglomeration of people in relatively large number at a particular spot of the earth surface (Onyemelukue, 1977). Conversely, another school of thought believes that urbanization is not about the population size, but must satisfy certain conditions like modernization, physical and economic development, as well as the heterogeneity in occupation (Oyeleye, 2013). The index of urbanization in Nigeria which is the population increase is mainly caused by rural-urban migration and not by natural increase. Many researchers see rural-urban migration in urbanization process as the genesis of the resultant problems of urbanization in any part of the world (Onokerhoraye, 1995; Wahab et al., 1990; Olotuah, 2006).
Urban growth is the rate of growth of an urban population. Urban growth refers to growth that makes intensive use of land for the location of buildings and impermeable surfaces to such a degree. Urbanization is mainly caused by urban growth, which could be due to natural population growth, reclassification of urban and rural system and rural-urban migration (Agbola, 2006). Studies have shown that the rapid rate of urbanization in Nigeria and the consequential explosion of urban population have not been matched by a corresponding commensurate change in social, economic and technological development (Mabogubje, 1990). Also, industrialization and modernization which are intertwined with urbanization have led to the diminished functions of the various institutions in Nigerian urban centres.
The challenges of urbanization are felt in all most all the aspects of urban centres. Two of these challenges are discussed below:
sanitary conditions, lack or inadequate basic facilities and amenities, crimes and poverty among other things. Urbanization therefore influences building collapse, as the demand for more commercial, industrial and residential activities is very high due to the population growth of urban centres (Owoeye & Omole, 2012).
- environmental problems and urbanization: The major challenge of urbanization in Nigerian Urban centres are environmental problems. Environmental problems in the urban centres have resulted to many health problems in Nigeria, and they also have a negative effect on the overall economy of the country. Improper wastes management has made the societal fabric of many urban centres in Nigeria to be very unsightly. Slums developments in urban centres also deplete the physical environment, increases crimes and violence. The environmental problems in urban centres outweigh the experience in the countryside, as the environmental problems are seen as the results of human activities which are higher in the urban centres (Owoeye & Omole, 2012).
MATERIALS AND METHODS
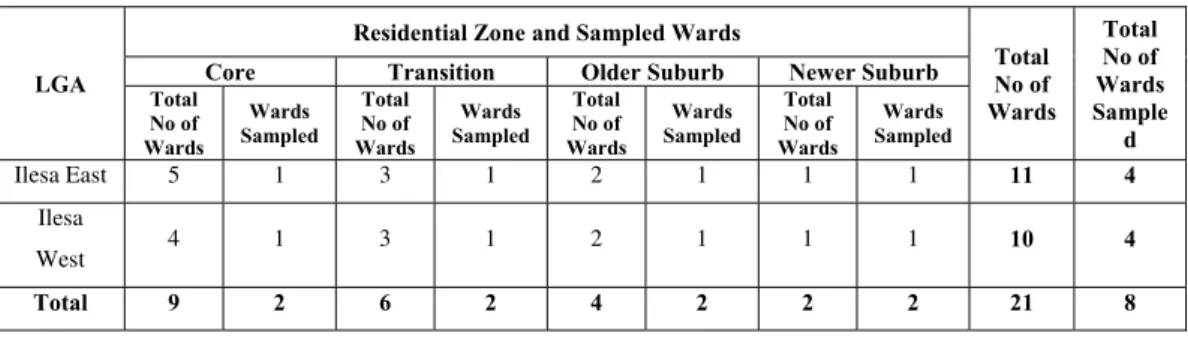
It is of great importance to discuss the socio-economic background of the residents’ of the Ilesa, Nigeria before we present the details of the study. Both primary and secondary sources were adopted for this study. For primary data, questionnaire was administered on the residents of the two local governments in the study area. Thus, Ilesa was stratified into three residential zones, namely core, transition and sub-urban. The core areaconsists of the Oba's palace, the traditional market place, referred to as "Oja Oba" andsurrounded by many residential units. Next to the core area is the transition zone, whilethe outermost part is the suburb or newly developed residential area or outskirt. For the survey, these residential areas were classified into three zones, namely; A, Band C, respectively (Jiboye, 2010). For questionnaire administration, one ward in each residential zone of all the selected local government areas was sampled randomly. Through this method, residents from six political wards cutting across the three different residential zones in the study were surveyed (figure 1). Presented in table 1 are the selected wards according to their respective residential zone and local government area. Systematic sampling technique was used in selecting residents to be sampled. The first building was chosen randomly. Subsequent unit of investigation was every 20th residential building in each ward, representing 5% of all residential buildings in the selected wards of the study area. The target person for the survey was the household head. In all, 204 households were surveyed by the aid of questionnaire. However, 160 copies of the questionnaire were successfully retrieved for analysis (table 1).
Table 1. Distribution of Political Wards into Residential Zones Source: NPC, 2012
LGA
Residential Zone and Sampled Wards
Total No of Wards
Total No of Wards Sample
d Core Transition Older Suburb Newer Suburb
Total No of Wards
Wards Sampled
Total No of Wards
Wards Sampled
Total No of Wards
Wards Sampled
Total No of Wards
Wards Sampled
Ilesa East 5 1 3 1 2 1 1 1 11 4
Ilesa
West 4 1 3 1 2 1 1 1 10 4
Total 9 2 6 2 4 2 2 2 21 8
RESULTS AND DISCUSSION
SOCIO-ECONOMIC BACKGROUND OF THE RESIDENTS IN THE STUDY AREA
(95.0%) of the respondents were married while few (5.0%) were single. This implies that most dwellers in the study area were married and only minority of them are unmarried.
It was revealed from the finding that majority (56.9%) of the respondents were male while few (43.1%) were female. This implies that information supplied for this research was gender balance by the respondents.
Table 2. Source: Field Survey, 2014
Marital Status
Frequency Percentage
Single 08 5.0
Married 152 95.0
Total 160 100.0
Gender
Male 123 76.9
Female 37 23.1
Total 160 100.0
Education Attainment
Primary 80 50.0
Secondary 69 43.1
Tertiary 11 6.9
Total 160 100.0
Monthly Incomes
Less than 10,000 50 31.3
10,000 t0 19,999 71 44.4
20,000 & above 39 24.3
Total 160 100.0
Age
Less than 21yrs 14 8.8
21 t0 40yrs 22 13.8
41 to 60yrs 37 23.1
61 & above 87 54.3
Total 160 100.0
Occupation
Schooling 03 1.9
Artisan/craft 57 35.6
Public servant 10 6.3
Private/self-employed 73 45.6
Retiree 17 10.6
Total 160 100.0
Years of living in this area
Below 10years 20 12.5
10 – 20 years 44 27.5
20 years & above 96 60.0
Total 160 100.0
Household size
1 – 3 23 14.3
4 – 6 34 21.3
7 & above 103 64.4
The study reveals that half 50.0% of the respondents have primary education while 43.1% had secondary education. The remaining 6.9% had tertiary education. This implies that majority of the respondents in the study area had either primary or secondary education. The proportion of respondents with tertiary education was few and this can be attributed to their level of education to reside somewhere else.The fact that many of these residents’ were illiterates could mean that the people in the study area may have serious attachment to the area. This could also have serious implication on the house they live as well as their environment.
The study reveals that 44.4% of the respondents earned between 10,000 to 19,999 on a monthly basis, 31.3% earned less than 10,000 and remaining 24.3% earned 20,00 and above in a month.
The finding reveals that majority 54.3% of the respondents are 60 years of age and above, 23.1% are between 41 to 60 years, 13.8% are between 21 to 40 years and just 8.8% of the respondents are less than 21years.This showed the extent to which the aged predominantly dominate the study area.
The study reveals that 45.6% of the respondents are private/self-employed, 35.6% are artisan/craft, 10.6% are retiree while the remaining 6.3% are public servant. This implies that majority of the respondents are self-employed and artisan while few proportion are public servant and retiree. Information revealed on the occupational pattern may have serious implication on the houses they live and the entire environment in which they inhabits.
The finding reveals that most 60.0% of the respondents have been living in the area 20 year and above, 27.5% of the respondents have been living between 10 to 20 years while 12.5% of the respondents have been living in the area less than 10 years ago. This implies that majority of the respondents have been residing in the study area more than 20 years ago and they are familiar with the whole environment.
Household with 7 and above member have higher percentage (64.4%), household between 4 to 6 members have 21.3% while household between 1 to 3 members have 14.3 (table 2).
HOUSING AND ENVIRONMENTAL CHARACTERISTICS
The variables of the physical and environmental characteristics of the traditional core area that were discussed include the land-use type, type of dwelling units, age of the building, building usage, among others. In specific terms, details of these are detailed below.
It is evident from the finding that Brazilian house have higher percentage of 51.2%, compound house have 35.6%, flat have 11.3% while duplex have just 1.9%.
Residential land-use is paramount in the study area; this was because 68.8% of the land was used for residential activities alone, while 20.6% of the land is dedicated for commercial activities, 8.1% of the housing use is for mixed-uses i.e. they are for mixture of residential and commercial activities while just 2.5% is for institutional use.
The finding reveals that 38.8% of the wall is mud, 29.3% is made by burnt brick, 25.6% is made by concrete brick while just 6.3% is made of normal brick. This can be attributed for the fact that most of the buildings have been built many years ago before the era of modern day civilization and low-income some of the respondents might also be reason.
The finding reveals that majority 67.6% of the respondents have pit latrine with slab in their house, 16.3% have no toilet at all, 9.2% make use of bucket system (short-put) and remaining 6.9% make use of water closet in their buildings. This can be attributed for the fact that many of the buildings have been built many years ago and their owner did not built in compliance to planning standard. Majority 83.1% of the respondents locate their toilet outside their building while the remaining 16.9% have their toilet inside their buildings. This implies that most residents does not make room for toilet facilities at the initial stage but later deem it necessary and site it at the back of their building. Also, oral interview conducted shows that some even use dump site as their toilet.
outside the building and some did not make room for that thereby engage in early hour or late hour bathing especially at the core area of the study area.
The study reveals that more than half 54.3% of the respondents have open drainage in their neighbourhood, 33.8% have covered/buried drainage while the remaining 11.9% have soak away in their buildings. This implies that majority of the respondents in the study area have open drainage in their environment. The finding reveals that 45.6% of the respondents are inherited occupier if their building, 34.4% of them is tenancy while the remaining 20.0% are owner occupier. This implies that most of the respondents in the study area are either inherited occupier or tenancy which cannot afford to build their own building except for residents’ at the newly developed area.
Close to four-fifth 74.4% of the respondents depend on water from well while 19.3% depend on bore hole. Also, 5.0% depend on water supply from vendor while remaining 1.3% depends on pipe-borne-water. This implies that majority of the respondents in the study area did not have access to drinkable water because they did not have pipe-born-water in most part of the study area.
Majority 91.9% of the respondents depend solely on power supply from Power Holding Company of Nigeria (PHCN) while the remaining 8.1% depend on power from generator. It can be deduced from the study that there is epileptic power supply from the PHCH and many respondents did not afford to buy their own generator set for personal use.
Findings on the road network reveal that 25.0% of the respondents stated that the road network of the study is very bad while 31.2% of them stated that the road is bad. Also, 21.3% of the respondents’ stated that the road network is fairly good, 14.4% stated that is good while the remaining 8.1% of the respondent stated that the road is very good. This implies that majority of the respondents in the study area stated that the access road in their neighbourhood is bad which need urgent attention of the concerned authority (table 3).
Table 3. Source: Field Survey, 2014
Housing type
Compound house 57 35.6
Brazilian house 82 51.2
Flat 18 11.3
Duplex 03 1.9
Total 160 100.0
Housing use
Residential 110 68.8
Commercial 33 20.6
Institutional 04 2.5
Mixed-uses 13 8.1
Total 160 100.0
Housing wall
Mud 62 38.8
Burnt l brick 47 29.3
Concrete block 41 25.6
Normal brick 10 6.3
Total 160 100.0
Type of toilet
Pit latrine with slab 108 67.6
Water closet 11 6.9
No toilet 26 16.3
Bucket system (short-put) 15 9.2
Location of toilet
Inside building 27 16.9
Outside building 133 83.1
Total 160 100.0
Location of bathroom
Inside 50 31.2
Outside 106 66.3
No bathroom 04 2.5
Total 160 100.0
Type of drainage
Open drainage 54 54.3
Covered/buried drainage 19 33.8
Soak away 87 11.9
Total 160 100.0
Household status
Owner occupier 32 20.0
Inherited occupier 73 45.6
Tenancy 55 34.4
Total 160 100.0
Sources of water supply
Bore hole 31 19.3
Well 119 74.4
Pipe-borne-water 02 1.3
Vendor 08 5.0
Total 160 100.0
Electricity
PHCN 147 91.9
Generator 13 8.1
Total 160 100.0
Road network
Very good 13 8.1
Good 23 14.4
Fairly good 34 21.3
Bad 50 31.2
Very bad 40 25.0
Total 160 100.0
CORRELATION OF THE EFFECTS OF SOCIO-ECONOMIC CHARACTERISTICS OF RESIDENTS’ ON HOUSING AND ENVIRONMENTAL CONDITION IN ILESA, NIGERIA
The result of the relationship between socio-economic and housing condition of the residents’ was conducted using Pearson correlation with P<0.01 significant level.
The study also showed that number of people who claimed to have tertiary education was said to have significantly influenced on the type of building the live. They either live in few flat apartments or duplex we have in the study area (0.789).
The study revealed that age has significant impact on the type of houses they inhabits (0.482). Those respondent that area older live in Brazilian house while those that are still younger can be found in other type of the houses in the study area (see table 4).
Table 4. Correlation matrixes the effect of socio-economic characteristics of Residents’ on Housing and Environmental Condition in Ilesa West Local Government
Source: Author’s field report, 2014
Average monthly income of CBO Education attainment
Age Housing type Housing use Housing wall Type of toilet Location of bathroom Average monthly income of CBO
1.00
Education attainment .647** 1.00
Age .-523 .610** 1.00
Housing type .711** .658** .482** 1.00
Housing use .556** -.031 -.059 .000 1.00
Housing wall .373** .430** .150 .454** .025 1.00
Type of toilet .047 .179 -.073 .082 .078 .475** 1.00
Location of bathroom .007 .184 -.048 .140 .153 .565** .838** 1.00
THE PATTERNOF HOUSINGQUALITY ILESA
Table 5 explains the variation in the pattern of housing quality among the three residential areas in Ilesa. From the ANOVA test result, the sums of square betweenand within groups for the zones are 4512.78 and 40112.29 respectively. Also the meansquare between and within groups are 1450.63 and 14.35 respectively. These valuesyielded an "F". ratio of 38.623, which is significant at 0.01 probability level. These valuesthus implied that there is a significant difference in the pattern of housing quality amongthe three residential zones in the study area.
Table 5. Analysis of variance (ANOVA) Test for Housing quality in Ilesa Source: Computer Output P (*) Significant at 0.01
Sources of variation Sum of Square
Mean Squares
Df F Sig Between Groups Within Groups Total 4512.78 40112.29 48134.86 1450.63 14.35 2601.09 1 459 460 3 505 507 38.623 .000*
Table 6. Multiple comparisons of mean values for housing quality in Ilesa Source: Computer Output P (*) Significant at 0.01
Hosing Zones Mean SD Mean Diff P
Core Zone A 65.11 Zone B 60.23
2.79 .000*
.679 .000* Transition Zone A 67.89
Zone C 61.18
2.79 - 6 .123*
.679 .000* Sub-urb Zone A 63.10
Zone B 62.36
7.29 6 .123*
By comparing the overall housing quality among the zones in order to determine thezone with the highest or superior housing quality, a multiple comparison (post-hoc) test ofmean values was carried out using the Scheffe formula (Jiboye, 2010). The result in "Table 5" shows thatZone C has a greater mean value than the other zones. The mean difference of 7.29 and 6.123, significant at 0.01 probability levels were obtained between Zone C and Zones A andB respectively. This indicates a significant difference in the mean values of the differentzones, with Zone C having a superior or higher level of quality, followed by Zone B, whileZone A had the lowest level of residential quality. This finding suggests that the pattern of housing quality in Ilesa varies from one residential area to another (table 5 and 6).
CONCLUSION AND RECOMMENDATION
This study has examined housing and neighbourhood quality condition in Ilesa, South-West, Nigeria. In doing this, it has examined housing and environmental characteristic of the study area and also the state of existing infrastructure in the study area. It has been established in this study that most of the buildings in the study area are in deplorable state which needs urgent attention and the whole environment are not good enough for human habitation.
The immediate task, then, is the activation of these inhabitants. Activation in the senses embraces the emergence of citizens who will be aware of their environmental problems, who will believe changes are not only possible but feasible, and who will have a keen desire to change and accept changes.Also, environmental responsibility is comparably low among the people as they do not consciously take steps or actions to protect the environment.With a view to ensuring these, it is pertinent that the access of the people to social amenities and infrastructural facilities be enhanced.
REFERENCES
Abumere S.I. (1987), Urbanization and Urban Decay in Nigeria, In: P Onibokun, F Olokesusi and L Egunjobi (eds) Urban Renewal in Nigeria. NISER, Ibadan.
Akuffo S. (2006), Saving African Metropolises: Case Study of Accra: – Growing By Chance or By Design? Cd-rom: Proceeding of the Africa Union of Architects XXXIst Council Meeting and West African Regional Congress, GIMPA, Accra, Ghana.
Agbola T. (2006), Sustainable Approach to Slum Prevention in Nigeria: Opportunities, Challenges and Strategies, Key Note Paper Presented at the Second House of Representatives’ Committee on Habitat on Sustainable Slum Upgrading in Urban Areas and Held at the ShehuYar’adua Center, Abuja, 25-27 October.
Adedibu A.A. (1980), Spatial pattern of housing modernization in the traditional residential areas of Ilorin, The Nigerian Geographical Journal, 23: 147-161.
Ayoola A., Amole D. (2014), The Value of Housing among the Poor in Ilesa, OsunState Nigeria; Architecture Research, p-ISSN: 2168-507X, e-p-ISSN: 2168-5088; 2014; 4(1A), 45-54 doi:10.5923/s.arch.201401.06.
Egunjobi Layi (1987), Urban renewal: Issues, policies, strategies and planning, pp. 33- 43, in Urban Renewal in Nigeria.P. G. Onibokun, F. Olokesusi and Layi Egunjobi (Eds.), NISER, Ibadan.
Jelilil M.O., Adedibu A.A, Ayinla A.K. (2006), Planning Implications of Housing Redevelopment in Density Areas of Ogbomoso, Nigeria: a pilot study”. Journal of Human Ecology, Kamla-Raj Enterprises, Delhi, India, Vol. 20, No. 3, pp273- 277.
Jiboye A.D. (2010), Evaluating the Pattern of Residential Quality Innigeria: The Case of Osogbo Township; Facta Universitatis, Series: Architecture and Civil Engineering Vol. 8, No 3, 2010, pp. 307 – 316 DOI: 10.2298/FUACE1003307J, UDC 728.1:711.4 112(669A/Z)(045)=111.
Mabogunje, Akin L. (1990), Perspective on Urban Land and Urban Management Policies in the Sub Saharan Africa,
World Bank Technical Paper No. 196, The World Bank, Washington DC, pg 33.
Olayiwola L., Adeleye A. and Jiboye A.D. (2006): Effect of Socio-cultural factors on HousingQuality in Osogbo, Nigeria. International Symposium on Construction in Developing Economies: New Issues and Challenges. Santiago, Chile. January 18-29.
Olotuah A.O. (2006), The State of Repair of Buildings in Akure, Nigeria, Proceedings of CIB W107 Construction in Developing Economies International Symposium, “Construction in Developing Economies: New Issues and Challenges”, 18-20 January, Santiago, Chile, paper 3.1 CD ROM.
Onokerhoraye A.G. (1995), Urbanization and Environment in Nigeria – implications for sustainable development; Benin City, Nigeria, The Benin Social Science Series for Africa, University of Benin, Benin City.
Oyeleye O.I. (2013), Challenges of Urbanization and Urban Growth in Nigeria, American Journal of Sustainable Cities and Society Issue 2, Vol. 1 Jan- Dec 2013 Available online on http://www.rspublication.com/ajscs/ajsas.html ISSN 2319 – 7277 Page 79.
Onibokun A.G. (1987), Public Utilities and Social Services in Nigerian urban Centres: Problemsand Guides for Africa, IDRC, Canada and NISER, Ibadan, Oyo State, Nigeria.
Owoeye J.O., Omole F.K. (2012), Built Environment Decay and HealthSituation of Slum Dwellers in Residential Cores of Akure, Nigeria, American Journal of Human Ecology Vol. 1, No. 2, 2012, 33-39, ISSN 2167-9622 Print/ ISSN 2167-9630 Online © 2012 World Scholars.
UNHSP (2008), The State of AFRICA Cities 2008, A Framework for Addressing Urban Challenges in Africa (UN-HABITAT); Michael Jones Software, Nairobi Kenya.
United Nations Centre for Human Settlements (UNCHS) (2014), An Urbanizing World: Global Report on Human Settlements, Oxford University Press.
Wahab K.A., Adedokun L.A., Onibokun A.G. (1990), Urban Housing Conditions, Urban Housing in Nigeria. A. G. Onibokun (Ed) NISER, Ibadan, 144-173.
World Bank (1995), Restoring Urban Nigeria A Strategy for restoring Urban Infrastructure and Services in Nigeria, World Bank, Washington.
Yoade A.O. (2012), A Study of Socio-Cultural Challenges to Urban Renewal in Ile-Ife, Nigeri, Thesis for the master of Urban and Regional Planning, Obafemi Awolowo University, Ile-Ife, Nigeria
Submitted: Revised: Accepted and published online