www.biogeosciences.net/11/6791/2014/ doi:10.5194/bg-11-6791-2014
© Author(s) 2014. CC Attribution 3.0 License.
Modeling the impediment of methane ebullition bubbles
by seasonal lake ice
S. Greene1, K. M. Walter Anthony2, D. Archer3, A. Sepulveda-Jauregui2, and K. Martinez-Cruz2,4
1Department of Chemistry, the University of Chicago, Chicago, Illinois, USA 2Water and Environmental Research Center, Institute of Northern Engineering,
University of Alaska Fairbanks, Fairbanks, Alaska, USA
3Department of the Geophysical Sciences, the University of Chicago, Chicago, Illinois, USA 4Biotechnology and Bioengineering Department, Cinvestav, Mexico City, D. F., Mexico Correspondence to:K. M. Walter Anthony ([email protected])
Received: 13 June 2014 – Published in Biogeosciences Discuss.: 15 July 2014
Revised: 23 September 2014 – Accepted: 19 October 2014 – Published: 8 December 2014
Abstract. Microbial methane (CH4) ebullition (bubbling)
from anoxic lake sediments comprises a globally significant flux to the atmosphere, but ebullition bubbles in temperate and polar lakes can be trapped by winter ice cover and later released during spring thaw. This “ice-bubble storage” (IBS) constitutes a novel mode of CH4 emission. Before bubbles
are encapsulated by downward-growing ice, some of their CH4 dissolves into the lake water, where it may be subject
to oxidation. We present field characterization and a model of the annual CH4cycle in Goldstream Lake, a thermokarst
(thaw) lake in interior Alaska. We find that summertime ebul-lition dominates annual CH4 emissions to the atmosphere.
Eighty percent of CH4in bubbles trapped by ice dissolves
into the lake water column in winter, and about half of that is oxidized. The ice growth rate and the magnitude of the CH4
ebullition flux are important controlling factors of bubble dis-solution. Seven percent of annual ebullition CH4is trapped
as IBS and later emitted as ice melts. In a future warmer cli-mate, there will likely be less seasonal ice cover, less IBS, less CH4dissolution from trapped bubbles, and greater CH4
emissions from northern lakes.
1 Introduction
Globally, the magnitude of methane (CH4) emissions from
freshwater lakes (72 Tg CH4 yr−1; Bastviken et al., 2011)
constitutes an estimated 30 % of all natural emissions (217 Tg CH4yr−1; IPCC, 2013). Methane is typically
pro-duced in anoxic bottom sediments by methanogenic mi-crobes and can be released to the atmosphere by diffusion, vascular transport through aquatic plants, or ebullition (bub-bling) (Rudd and Hamilton, 1978; Bastviken et al., 2004; Whalen, 2005). Methanogenesis in the oxic water column has been proposed as an additional CH4source in some lakes
(Tang et al., 2014). In many lakes, ebullition from bottom sediments is the dominant mode of emission because gas-phase CH4 in bubbles is not subject to oxidation, whereas
a significant proportion of dissolved CH4 is typically
ox-idized by methanotrophic bacteria, including in the plant rhizosphere (Keller and Stallard, 1994; Casper et al., 2000; Bastviken et al., 2008).
Most ebullition CH4in shallow lakes is released directly
to the atmosphere in the summer, but in cold-climate regions bubbles are trapped beneath and encapsulated by downward-growing lake ice in the winter (Walter et al., 2006). Methane involved in this “ice-bubble storage” (IBS) is later released during spring thaw. The CH4 content of bubbles decreases
as they are encapsulated, which suggests CH4 dissolution
into the water column (Walter et al., 2008). Dissolved CH4
accumulates in many lakes during the ice-cover period due to the slowdown or inactivity of methanotrophs in the cold, often anoxic water column (Michmerhuizen et al., 1996; Phelps et al., 1998; Boereboom et al., 2012), so dissolved CH4 from bubbles may not be immediately subject to
oxi-dation. However, it can potentially be oxidized when oxygen is reintroduced during spring ice melt. The fraction of CH4
lakes depends on these biogeochemical processes. Previ-ously, Sasaki et al. (2009) measured the CH4 concentration
of bubbles trapped within lake ice in Antarctica and used aerial imaging to estimate the total volume of gas trapped before the ice melts. Elsewhere, others have measured dis-solved CH4 concentrations beneath winter lake ice or the
CH4 diffusion rate following ice-off to estimate net
spring-time emissions (e.g., Michmerhuizen et al., 1996; Phelps et al., 1998; Smith and Lewis, 1992).
In northern Siberian thermokarst (thaw) lakes, ebullition occurs mainly at discrete locations (“seeps”) on the lake bot-tom (Walter et al., 2006). Bubbles trapped within the ice above seeps (at “seep sites”) are easily visible in early-winter lake ice (Fig. 1a). Walter et al. (2006) defined four classes of seeps: A, B, C, and Hotspot (Fig. 1b). A-type seeps ex-hibit lower ebullition rates and a greater degree of separa-tion among ice-trapped bubbles; B- and C-type seeps exhibit progressively higher ebullition rates and greater degrees of bubble coalescence in ice. Ebullition rates are highest for Hotspots, where frequent bubbling brings warmer water from the lake bottom to the surface, maintaining open water dur-ing a portion of the ice-cover period. When air temperatures are sufficiently cold, a thin layer of ice covers Hotspot seep sites, beneath which gas accumulates in a cavity open to the water column. Using submerged bubble traps placed above seeps to measure short- and long-term (year-round) seep-class ebullition rates and counts of ebullition seep sites in lake-ice transects, Walter Anthony and Anthony (2013) esti-mated whole-lake seep ebullition. Translating seep ebullition to atmospheric CH4 emission from seeps was not possible
due to a lack of knowledge about the degree to which sea-sonal lake ice reduces ebullition emissions.
This manuscript describes the formulation of a model, informed by field measurements, of CH4 dissolution from
trapped ebullition bubbles in Goldstream Lake, a thermokarst lake in interior Alaska. This study has three goals: (1) to gain insight into how some physical and biogeochemical pro-cesses within a thermokarst lake interact to determine sea-sonal and annual CH4emissions via diffusion, ebullition, and
IBS; (2) to determine the extent to which lake ice reduces net annual emissions; and (3) to gain insight into how changes in climate will influence emissions by different modes in the future.
2 Methods 2.1 Study site
Goldstream Lake (informal name; 64.92◦N, 147.85◦W; area 10 030 m2; volume 15 700 m3; mean depth 1.6 m; max depth 2.9 m) is located near the bottom of Goldstream Valley in the discontinuous permafrost zone of interior Alaska. The lake formed by the melting of permafrost ground ice in retransported late-Quaternary loess common on many hill
a)
b)
A B C Hotspot
c)
Figure 1. (a)Photograph showing CH4-rich bubbles trapped by ice at Goldstream Lake in mid-October 2007.(b)Photographs of repre-sentative A-, B-, C-, and Hotspot-type seep sites as seen from above in early-winter lake ice. Note the open water at the Hotspot seep site. The black and red markings on the rulers shown are 10 cm apart.(c) Side-view photographs of blocks of ice harvested from above seep sites in spring. Note the hollow cavity in the block harvested from above the Hotspot seep site (at right).
Figure 2.Map of Goldstream Lake showing the location of the LI-7700 Open Path Methane Analyzer used to measure atmospheric CH4concentrations, locations of depth measurements, 0.5 m bathy-metric isolines, shoreline locations in 2012 and l950, and the thermokarst zone, characterized by eastward thermokarst expansion and high ebullition activity.
Hotspot seeps) than in the remainder of the lake (the “non-thermokarst zone”).
2.2 Field observations 2.2.1 Lake bathymetry
During the winter of 2011–2012, we mapped the bathymetry of Goldstream Lake using sonar point measurements (Vexi-lar LPS-1 Handheld Depth sounder, Minneapolis, Minnesota, USA) through ice or in ice-augered holes combined with centimeter-accuracy RTK differential GPS (Leica Geosys-tems AG, Heerbrugg, Switzerland) at 99 distributed locations on the lake. In late October 2011, depth measurements were obtained using sonar through ice at 347 points within two rectangular plots in the lake center and northeast thermokarst zone at a density of approximately 0.22 measurements per square meter. We produced an interpolated bathymetric map using kriging in ArcGIS (Esri, Redlands, California, USA). The resulting map was used to create a three-dimensional model of the lake in ArcScene (Esri), from which we esti-mated the water volume in 0.5 m depth intervals relative to the water level on 30 October 2011, the date of >95 % of bathymetry measurements.
2.2.2 Water level
Measurements of hydrostatic pressure at the bottom of Gold-stream Lake (Global Water WL 16 vented submersible
pres-sure transducer with a Global Logger v2.1.4 data logger, Col-lege Station, Texas, USA) were used to estimate changes in the lake’s water level and volume throughout the study pe-riod. We define the water level during the ice-cover period as the height of the water column at the measurement site if, hypothetically, all of the snow and ice on the lake sur-face melted. Hydrostatic pressure measurements were not available from 21 May 2011 to 14 February 2012 and on several dates in the fall of 2012. From 12 October 2011 to 14 February 2012, we used daily precipitation measurements (Sect. 2.2.8) to extrapolate the water level backward from 14 February 2012. The water level from 21 May 2011 to 11 Oc-tober 2011 and on dates in the fall of 2012 was linearly inter-polated between adjacent values (Appendix Fig. B1). 2.2.3 Water temperature
Temperature–depth profiles were obtained within Gold-stream Lake between 19 October 2010 and 2 July 2012 using a handheld Hach DS5 Multiprobe Sonde (Hach Hydromet, Loveland, Colorado, USA). Measurements were obtained at approximately five depths at each of two sites on each sam-pling day. Additionally, we measured water column tempera-tures at depth intervals of 0.5 m from the lake surface hourly from 10 April 2009 through 8 December 2013 using HOBO Water Temperature/Light pendant loggers (Onset, Bourne, Massachusetts, USA). One logger was located near the cen-ter of Goldstream Lake and another in the thermokarst zone. 2.2.4 Lake ice types and phenology
Congelation (black) ice is formed when water freezes at the bottom of the ice layer and therefore appears clear. In con-trast, snow (white) ice is opaque and is formed when the weight of snow depresses the ice surface beneath the water level, causing lake water to flood snow on top of the ice layer and freeze. During the ice-cover seasons from October 2010 to May 2012, we obtained the thicknesses of each type of ice, as well as that of snow, by augering a hole in the ice (20 cm diameter) near the lake center, measuring the total ice and snow thicknesses around the auger hole, and look-ing through the hole for differences in ice color to estimate white and black ice thicknesses with a measuring tape. In the winter of 2010–2011, measurements were made where snow was occasionally compacted by foot traffic; measurements in 2011–2012 were made in undisturbed locations. Using a time-lapse camera (Game Spy I-60, Moultrie, Alabaster, Al-abama, USA), we acquired images of the lake surface every 4 h from 16 April 2010 to 14 May 2010 to constrain the tim-ing of freeze-up and ice-off (the first and last days of any observed ice cover, respectively).
2.2.5 Water column dissolved gases
Dissolved CH4concentration–depth profiles were measured
eastern shore on 34 days between 27 October 2010 and 22 September 2012. Duplicate water samples were collected from a boat in summer or from the lake ice surface through an auger hole in winter. Water samples (10 mL) collected with a Van Dorn bottle (Wildco, Yulee, Florida, USA) were gently transferred into 25 mL glass serum bottles and immediately sealed with butyl rubber stoppers and aluminum crimp caps. Bottles were stored upside down and frozen in the dark un-til laboratory analysis. We thawed samples overnight in the refrigerator, brought them to room temperature for 10 min, and shook them for 15 s to equilibrate headspace and water. We then measured the CH4 concentration in the headspace
using a GC-2014 gas chromatograph (Shimadzu, Addison, Illinois, USA) equipped with a flame ionization detector and a PLOT (porous layer open tubular) alumina column (detec-tor temperature 250◦C, oven 40◦C, high-purity helium as carrier gas). Dissolved CH4concentrations were calculated
from headspace CH4 concentrations using a
temperature-dependent Henry’s law constant (Wilhelm et al., 1977). Dissolved oxygen (O2) concentrations were measured
si-multaneously with water temperature using a Clark-type mi-croelectrode on the calibrated Hach DS5 Multiprobe Sonde (Sect. 2.2.3).
Measured concentrations were used to estimate total amounts of CH4and O2dissolved in Goldstream Lake. To
facilitate comparison with our model, interpolated concen-tration profiles were integrated with respect to depth using bathymetry measurements to calculate total quantities of dis-solved gas separately in the upper 1.25 m of the water col-umn and in the lower layer (below 1.25 m). The volume of the upper layer was adjusted to account for changes in the ice/snow layer thickness, calculated using our ice growth model (Sect. 2.3.2).
2.2.6 Ebullition
Seep ebullition in Goldstream Lake was characterized us-ing methods described previously by Walter Anthony et al. (2010). We used average areal densities (seeps m−2) for each class measured by Walter Anthony and Anthony (2013) in transects covering 11 % of Goldstream Lake, plus another, subsequent 428 m2survey plot that increased the total area of the lake surveyed for A-, B-, and C-type seeps to 15 %. The entire lake surface was surveyed for Hotspot seeps. The re-sulting seep densities (A: 0.31 seeps m−2; B: 0.08 seeps m−2;
C: 0.03 seeps m−2; and Hotspot: 0.01 seeps m−2) were used
as inputs to the model.
Seep-class-specific smoothed ebullition rates (mL gas seep−1d−1), indexed by Julian day, were applied to all seeps in the model. These were calculated from long-term (up to 700 days) measurements of daily ebullition rates for 31 seeps in four Arctic thermokarst lakes (Walter Anthony et al., 2010). Twelve of these seeps were located in Gold-stream Lake, and average bubbling rates for each class of seeps in Goldstream Lake were not significantly different
from the Arctic averages. We calculated the mean ebullition rate on each Julian day for each class from our measurements of individual seeps. Because ebullition from individual seeps is often highly episodic, and because there were significant data collection gaps for many seeps, resulting in certain Ju-lian days on which only a few seeps were represented in the average, the resulting annual flux cycle represented by Ju-lian day averages was highly irregular. We smoothed JuJu-lian day averages three times by taking 30-day running averages of daily averages in order to remove these irregularities, as we wanted these smoothed data to represent the annual ebul-lition cycle rather than the ebulebul-lition dynamics of individ-ual seeps. This smoothing did not change the total calculated yearly amount of CH4released from seeps by ebullition.
For comparison with smoothed fluxes in a sensitivity anal-ysis of the model, we also used measured fluxes from indi-vidual seeps with relatively few data gaps, which were scaled and applied to the 2010–2012 study period. In the sensitivity analysis, we included measurements of nine A-type seeps, seven B-type seeps, five C-type seeps, and seven Hotspots in Goldstream Lake, Cranberry Lake (interior Alaska), Shuchi Lake (Siberia), and Grass Lake (Siberia) year-round during 1 or more years between 2003 and 2014. All of these lakes are thermokarst lakes that formed in yedoma-type permafrost deposits. Smoothed and individual seep fluxes are presented in Fig. 3.
During the period of decreasing ice thickness in the spring (the “ice-melt period”), when standing water was present on the ice surface, we observed gas escaping from bubbles trapped by the ice. On 18 April 2010 and 21 April 2011, we collected such gas from eight ice-trapped bubbles in Gold-stream Lake, four of which were located above the same ebullition seep. Gas was collected by displacement into in-verted, water-filled glass serum bottles, which were then sealed with butyl rubber stoppers and aluminum crimp caps until later analysis. Additionally, bubbles from 246 ebullition events in Goldstream Lake were collected from submerged bubble traps above ebullition seeps from 2008 to 2011 fol-lowing methods described by Walter et al. (2008). These “fresh” samples enabled us to calculate the CH4
composi-tion of bubbles after they ascend through the water column but before they interact with lake ice, allowing for the con-version of measured volumetric fluxes (ml gas seep−1d−1) to molar fluxes (mol CH4seep−1d−1). All samples were
trans-ported to the lab and stored under refrigeration, in the dark. The CH4concentrations of samples were analyzed using the
Shimadzu GC-2014 gas chromatograph.
0" 10" 20" 30" 40" a)
0 100 200 300 400 500 b)
0.1 1 10 100 1000 10000
0.1 1 10 100 1000 10000
01-Jan 14-Mar 26-May 07-Aug 19-Oct 31-Dec c)
d) Ebullition Rate (
mmol
gas seep
-1 d -1)
Individual
Smoothed
Figure 3.Time-smoothed daily ebullition rates, and rates for indi-vidually measured seeps as applied in the model, for A-, B-, C-, and Hotspot-type seeps (panelsa,b,c,d). Note the difference in scales onyaxes, including the log scale in panelscandd.
2.2.7 Ice-bubble mesocosms
Measurements of the rate of CH4diffusion from submerged,
gas-filled mesocosm chambers constrained our model of diffusion from trapped bubbles. During each of two trials (spring and fall, 19–24 April 2011 and 30 October–6 Novem-ber 2011), we suspended 24 chamNovem-bers approximately 14 cm below the water surface in random positions within two 1 m by 3 m holes opened in the ice near the center of Gold-stream Lake. The observation of relatively few ice-trapped bubbles in bubble transect surveys in the lake’s center sug-gests that rates of natural ebullition from the sediments are relatively low there. Mesocosm chambers consisted of in-verted containers (14 cm by 14 cm by 25 cm tall; Tupper-ware, Orlando, Florida, USA) filled with lake water and fit-ted with a three-way stopcock to release gas. A gas standard (140 mL) with a composition similar to that of natural seep ebullition bubbles (80 % CH4, 20 % N2) was then injected
such that its height within each chamber (ca. 10 mm) approx-imated the measured thickness of small bubbles trapped be-neath ice (5.7±1.0 mm, mean±standard deviation). Cham-bers were open to lake water but fitted with deflectors be-neath to deter natural ebullition bubbles from entering. At 1-day intervals (including a time zero control), we recovered gas from triplicate chambers and measured its volume and CH4composition. Regrowth of lake ice above the chambers
did not reach 14 cm, so no chambers became surrounded by ice.
The following equation, which is based on Fick’s first law in one dimension, gives the CH4 dissolution flux, J, from
chambers (Holocher et al., 2003):
J=DCH4
[CH4]eq−[CH4] δeff
, (1)
where DCH4 is the diffusivity of CH4 in water
(0.98×10⁻⁹m2s−1; Broecker and Peng, 1974), and [CH4]eq and [CH4] are the equilibrium and bulk
concen-trations of dissolved CH4 in lake water. δeff represents an
effective diffusively controlled layer thickness, calibrated such that the gradient calculated from [CH4]eq, [CH4],
and δeff equals the true gradient at the bubble’s surface.
The CH4 mole fraction determines [CH4]eq, based on the
hydrostatic pressure in the chamber and a Henry’s law constant of 2.533×10⁻⁵mol L−1kPa−1for CH
4in water at
0◦C (Yamamoto et al., 1976). The bulk CH
4 concentration
was taken to be the average concentration in the upper 1.25 m of the water column, calculated from measurements (Sect. 2.2.5).
A simple model based on Eq. (1) with a 1 h time step was used to simulate CH4 dissolution from chambers. For each
trial,δeffwas calibrated to optimize the fit between the
mod-eled and measured CH4 composition and volume. The
ex-change of other gases between chambers and the water col-umn was neglected, as we estimated that including N2
ex-change has a negligible (ca. 7 %) effect on the magnitude of CH4dissolution. This model exhibited close fits to
measure-ments at the optimum values ofδeff (0.25 and 0.27 mm for
the spring and fall trials, respectively, Fig. 4). Becauseδeff
values were fairly consistent between trials, which were con-ducted in conditions with substantially different upper-layer CH4 concentrations (290 and 2 µM in spring and fall trials,
respectively), we applied this formula with aδeffof 0.26 mm
in our model of CH4diffusion from trapped ebullition
bub-bles (Sect. 2.3.3).
2.2.8 Meteorological observations
0 50 100 150
V
o
lu
m
e
(m
L
)
0 20 40 60 80
0 40 80 120
Time (h)
0 40 80 120 160 Time (h)
b) a)
δeff = 0.15 mm δeff = 0.35 mm Best Fit Measured
CH
4
Mo
le
F
ra
c
ti
o
n
(%
)
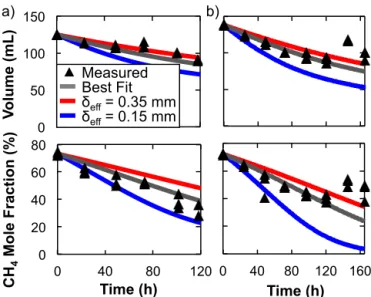
Figure 4.Modeled and measured volume and CH4mole fraction of gas inside ice-bubble mesocosm chambers in the spring 2011 (a)and fall 2011(b)trials. Values ofδeff=0.25 and 0.27 mm were found to give the best fits to volume and composition measurements for the spring and fall trials, respectively. Values ofδeff=0.35 and 0.15 mm encompassed the range of uncertainty in these measure-ments, so they were used in sensitivity analyses (Sect. A3).
Minimum and maximum temperatures were averaged to cal-culate daily mean temperatures.
2.2.9 Atmospheric CH4concentrations
We monitored the concentration of atmospheric CH450 cm
above the lake surface from 12 April 2010 to 9 May 2011 using a LI-7700 Open Path Methane Analyzer (LI-COR Bio-sciences, Lincoln, Nebraska, USA) mounted on a stationary raft. The radius of its concentration measurement footprint was approximately 60 m (area 10,600 m2; Gash, 1986). The lake surface occupied the majority of the footprint; however, littoral vegetation and black spruce forest-tundra occupied approximately 30 % of the footprint, primarily in the south-eastern quadrant (Fig. 2). The prevailing wind direction in Goldstream Valley from 2008 to 2013 was from the N in summer and from the NNE the remainder of the year; thus the terrestrial contribution to the LI-7700 signal should have been minimal. Measurements of atmospheric CH4
concen-tration were obtained five times per second and converted to daily averages.
2.2.10 Methane diffusion from sediments
We calculated the rate of CH4 diffusion into the water
col-umn from CH4-rich lake bottom sediments using
measure-ments of CH4 concentrations in the surface sediments of
Vault Lake, a thermokarst lake near Goldstream Lake, be-cause measurements from Goldstream Lake were unavail-able. Since Vault Lake formed in similar yedoma-type
per-mafrost deposits, we assumed that sediment concentrations from Vault Lake were representative of Goldstream Lake. We obtained two sediment cores in March 2013 from a lo-cation in between the center and active thermokarst margin of Vault Lake and kept the cores under refrigeration at 2◦C prior to laboratory analysis. Triplicate samples (5 mL each) were obtained with a syringe at multiple depths within the top 5 cm of the cores and transferred to 20 mL serum vials con-taining 10 mL of CH4-free water. Vials were sealed with
rub-ber caps. The CH4concentration in the water was determined
using methods described previously in Sect. 2.2.5 and con-verted to a CH4concentration per unit sediment volume. This
was converted to a concentration per unit water volume using measurements of sediment density in Vault Lake (K. M. Wal-ter Anthony, unpublished data). The resulting concentration gradient between the topmost two measurements was mul-tiplied by the molecular diffusivity of CH4 to calculate the
diffusive flux according to Fick’s first law.
The methanogenic rate in lake sediments varies with tem-perature (Schulz et al., 1997; Sepulveda-Jauregui et al., 2014a). In order to quantify this effect on sediment diffu-sion rates in the model, we monitored the temperature of surface sediments in Goldstream Lake from 3 July 2008 to 23 March 2012 using the HOBO temperature loggers (Sect. 2.2.3). On days during the study period when temper-ature measurements were available, we applied the average temperature from both measurement locations in the model; when temperature measurements were unavailable, we used Julian day temperature averages calculated from data from the entire measurement period. We used a Q10 value for
methanogenesis of 2.4 from Kelly and Chynoweth (1981) to scale the average diffusive flux calculated from both sedi-ment cores from Vault Lake on each day of the study period, depending on the sediment temperature in Goldstream Lake. We assumed that the diffusive flux calculated from measure-ments was representative of the in situ diffusive flux at 2◦C, the temperature of the cores before analysis. Calculated daily fluxes are shown in Fig. B2. We acknowledge that there is un-certainty in our calculated sediment diffusion rate for the fol-lowing reasons: (1) in reality, a greater rate of methanogene-sis in surface sediments may correspond to a greater propor-tion of CH4escaping via ebullition instead of diffusion; the
rate of methanogenesis may scale differently than the rate of diffusion as temperature varies. (2) The diffusive flux of CH4
is usually very variable across the lake bottom, and our cal-culations for Goldstream Lake are based on the average flux calculated from only two cores from Vault Lake.
2.3 Modeling 2.3.1 Overview
Our model simulates the processes that influence CH4
released from seeps as observed (Sect. 2.2.6), are either trapped beneath lake ice or released to the atmosphere. Some CH4dissolves out of bubbles before they are encapsulated by
growing ice. The model water column is resolved into two layers (“upper” and “lower”), divided at 1.25 m below the lake surface, because measured CH4 concentrations varied
independently in these layers during spring ice-melt periods. Changes in the amount of dissolved CH4in the lake’s water
column were driven by dissolution from bubbles trapped be-neath ice, aerobic methanotrophy, atmospheric CH4emission
from freezing water on the ice surface during winter “flood-ing events” (Sect. 2.3.2), dissolved CH4 diffusion to the
at-mosphere in spring and summer, and lake overturn events. CH4diffused into the lower layer of the water column from
sediments at a constant rate determined from measurements (Sect. 2.2.10).
2.3.2 Ice growth
The rate of black ice growth, which determines how quickly bubbles become encapsulated, is calculated based on a diffu-sive energy balance model from the steady-state temperature profile through snow and ice on the lake surface. Setting the surface temperature to the observed air temperature and the temperature at the ice–water interface to 0◦C yields the fol-lowing formula for the daily change in black ice thickness: 1zb=α2
1t ρi 1Hfus
× 0 ◦C−T
air
zb
ki +
zw
ki +
zs
ks
, (2)
where1t is 1 d;ρi is the ice density (913 kg m−3; Duguay et al., 2003); 1Hfus is the enthalpy of fusion for water
(334 J g−1); Tair is the mean daily air temperature; zb, zw,
andzs are the thicknesses of black ice, white ice, and snow,
respectively; andkiandksare the thermal conductivities of
ice (2.034 W m−1K−1; Duguay et al., 2003) and of snow, respectively. αis a parameter included to account for other processes, such as wind and solar irradiation, following Ash-ton (1986).
Equation (2) is inaccurate when the snow/ice layer is thin, so Eq. (3) was used to calculatezbwhen snow and white ice
are absent:
zb=α s
2ki ρi1Hfus
Z
0◦C−Tairdt , (3)
whereTairis integrated over time since freeze-up. This
for-mula represents an analytical solution to the differential equation describing black ice growth (of which Eq. (2) is the discretized form) and was applied before the first date of ob-served snowfall.
The assumptions underlying Eqs. (2) and (3) are invalid for Tair >0, which was the case on 4 consecutive days in
October 2010 after freeze-up, but we applied this model as an approximation. Previous studies of melting ice found the formation of channels within lake ice instead of decreasing
thickness (e.g., Browman, 1974; Nye, 1989; Jakkila et al., 2009), so we assume zero ice growth around trapped bubbles during this period.
The snow’s thermal conductivity was calculated from its density (Sturm et al., 1997), which was estimated from mea-surements of precipitation and snow depth (Sect. 2.2.8). We assumed that decreases in measured snow depth resulted only from compaction and not sublimation, which resulted in our underestimating the maximum black ice thickness by at most 9 cm (Liston and Sturm, 2002).
Occasionally, the weight of snow depresses the ice surface beneath the water level, causing lake water to flood the ice surface and form white ice (i.e., a flooding event). The white ice thickness was increased during such events according to the thickness of water required to balance the weight of the snow/ice layer:
1zw= ρi ρwρs
(zsρs−ziρi−ziρw) (4)
whereρsandρware the densities of snow and water,
respec-tively. The volume,Vflood, and CH4 concentration of water
involved in each flooding event determined the amount of CH4released to the atmosphere:
Vflood=1zwA
1−ρs ρi
, (5)
whereAis the lake area (10 030 m2).
The daily change in lake snow depth was calculated as the change in the measured snow depth on land minus1zw. An αvalue of 0.95 yielded the best fit to the measured total ice thickness during the winter of 2011–2012 (Fig. 5d). A sec-ond model was constructed for 2010–2011 in which the snow density was set to 450 kg m−3 (Bohren and Beschta, 1979; Fancy and White, 1985) on days when the measurement site was visited so that modeled thicknesses could be compared to measured ice thicknesses at the disturbed (artificially com-pacted) site. Anαvalue of 0.94 yielded the best fit to these data (Fig. 6). Due to the similarity ofαvalues during both winter periods and the greater number of measurements in 2011–2012, anαvalue of 0.95 was used to calculate undis-turbed ice thicknesses in the model.
2.3.3 Methane dissolution from bubbles
The model uses Eq. (1) with 60 s time steps to simulate CH4 diffusion from trapped bubbles into the upper layer
of the water column. We calculated that typical ebullition bubbles in Goldstream Lake (6.3±0.2 mm bubble diame-ter measured at the lake surface, mean±standard devia-tion,n=433) lose<1 % of their CH4during their ascent
through the≤2.9 m water column (Woolf and Thorpe, 1991; Holocher et al., 2003), which is significantly less than the dif-ference in CH4 contents of fresh and encapsulated bubbles
0 10 20 30 40 50 Black Ice T h ic k n e s s (c m ) 0 20 40 60 W h ite I c e T h ic k n e s s (c m ) 0 10 20 30 40 50 Sn o w T h ic k n e s s (c m ) 0 20 40 60 80
12-Oct-11 22-Nov-11 2-Jan-12 12-Feb-12 24-Mar-12
T o ta l Ic e T h ic k n e s s (c m ) Modeled Measured a) b) c) d)
Figure 5.Modeled and measured thicknesses of(a)black ice,(b) white ice,(c)lake surface snow, and(d)the ice layer (white and black ice) during the winter of 2011–2012. A value ofα=0.95 was used in the ice growth model (Sect. 2.3.2) for this period.
therefore neglected, an approximation similarly employed by Stepanenko et al. (2011).
The shapes of trapped bubbles at each seep site determine the area over which CH4dissolves out. All ebullition bubbles
at each site are modeled as a single gas pocket. We tested this approximation by modeling multiple pockets at each site (20 at A seep sites and 10 at B seep sites, representative of the number of bubbles found at typical sites in these seep classes), and found that this had a negligible (<0.5 %) ef-fect on the total amount of CH4that dissolved into the water
column during the ice-cover periods.
At each seep site, the model tracks the growth of a cav-ity within the ice layer, caused by the localized inhibition of ice growth. If the total volume of gas exceeds the cavity’s volume, the gas beneath the ice–water interface is modeled as a cylinder. At A, B, and C seep sites, the height of this cylinder is 5.7 mm, as informed by measurements of air bub-bles of known volume that we artificially introduced beneath the ice in Goldstream Lake. The cylinder’s radius determines
0 20 40 60 80 100 120
28-Sep-10 20-Nov-10 12-Jan-11 6-Mar-11
T o ta l Ic e T h ic k n e s s (c m ) Modeled Measured
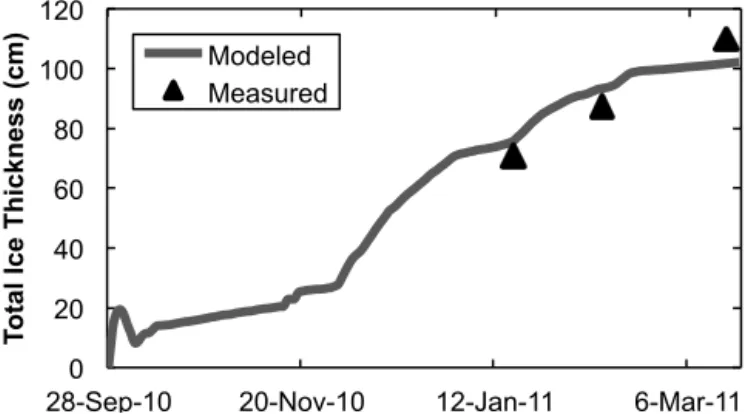
Figure 6.Modeled and measured total thicknesses of the ice layer (white and black ice) during the winter of 2010–2011. Measure-ments were obtained in areas where snow was occasionally com-pacted by foot traffic, an effect accounted for in the modeled thick-ness. A value ofα=0.94 was used in the ice growth model for this period.
that of the cavity as the ice grows downward. The cylinder’s volume and radius decrease as CH4diffuses out and the ice
grows downward, causing cavities to taper at the bottom. At the beginning of each day, a bubble is added to the site, with a CH4 composition and volume determined from
measure-ments (Sect. 2.2.6). When no gas remains beneath the ice– water interface, the site’s bubbles are considered encapsu-lated. Since the rate of gas diffusion in ice is typically neg-ligible compared to that in water (Hemmingsen, 1958), we assumed that the CH4content of bubbles remained constant
after encapsulation. Figure 7a summarizes this component of the model.
At Hotspot seep sites, warmer water brought to the sur-face by frequent ebullition events inhibits ice growth and af-fects the shapes of cavities. Following Zimov et al. (2001), Hotspot sites were opened to the atmosphere when the daily maximum air temperature exceeded−15◦C. The shape of Hotspot cavities was determined by averaging measurements of three cavities in Goldstream L. The bottom radius of the cavity determined the radius of the cylinder beneath the ice-water interface. Bubbles were added to Hotspot seep sites ev-ery 8 min, according to our field observations. We found that changing this interval to 1 and 20 min, both within the range of variability of our observations, affected the total amount of CH4that dissolves annually from Hotspot bubbles by no
more than 0.05 %. Hotspot cavities never closed at the bot-tom, and when the total volume of gas was less than the cav-ity volume, the cavcav-ity’s interior shape determined the area of gas exposed to lake water (Fig. 7b).
2.3.4 Release of ice-trapped bubbles
ice layer form between black ice crystals with horizontal c axes and tend to grow larger as melt progresses, facilitat-ing the transport of water and trapped gas (Browman, 1974). The absorption of solar radiation within the ice layer accel-erates this process, particularly after the high-albedo snow cover has melted completely (Williams, 1969; Ashton, 1986; Jakkila et al., 2009), as does the presence of ice-trapped bub-bles (our observation when harvesting ice blocks; A. Bon-durant, personal communication, 2014). Time-lapse photos indicate significant spatial and temporal variability in the sur-face albedo of Goldstream Lake during the spring melt pe-riod, suggesting that ice permeability was also highly vari-able.
Ebullition seeps can open prior to ice-off when water pressure breaks the ice separating encapsulated bubbles (Zi-mov et al., 2001). In agreement with the findings of Sasaki et al. (2009), we observed the opening of ebullition seeps throughout the thaw period, indicated by (1) open holes in ice at the locations of former ice-trapped bubbles, (2) rapid but short-lived (usually<1 min, but occasionally>10 min) streams of bubbles escaping from ice through puddles of wa-ter on the ice surface, and (3) the lack of gas escape from gas pockets in ice when punctured with an ice spear. We observed that seep sites with higher ebullition flux opened earlier, pre-sumably due to thinner ice between encapsulated bubbles. On each day, the number of open seep sites in each class was increased according to a release rate function informed by these field observations (Fig. B3). Bubble dissolution at closed sites during this period was simulated assuming a zero ice growth rate.
2.3.5 Water column dissolved gases
During the winter ice-cover periods of the model, we assume that dissolved CH4is excluded from water as it freezes. This
is consistent with observations of CH4concentrations in
bo-real lake ice 10 to 100 times lower than in the underlying water column (Phelps et al., 1998). In some cases, the ex-clusion of dissolved CH4from downward-growing ice leads
to the formation of millimeter-scale-diameter tubular bub-bles within ice (Adams et al., 2013; Boereboom et al., 2012). Such bubbles were not obvious to us in ice blocks from Gold-stream Lake, so the model did not include this process. We assume no gas exchange between the water column and the atmosphere during the winter ice-cover periods except for the release of dissolved CH4from water on the ice surface
during flooding events (Sect. 2.3.2).
The rate of CH4 consumption by methanotrophy,r, was
calculated according to a double Monod equation (Van Bode-gom et al., 2001):
r=rmax
[CH4] KS,CH4+[CH4]
[O2] KS,O2+[O2]
, (6)
where [CH4] and [O2] denote the concentrations of dissolved
CH4 and O2, respectively;rmax is the potential maximum
a)
White Ice
Encapsulated bubble
Black Ice
5.7 mm Water
Gas
b)
50 cm Gas
Water Black Ice White Ice
Figure 7. (a) A cross section of the model’s representation of trapped gas at A, B, and C seep sites. The dashed line indicates the area over which CH4dissolves into the water column. Gas be-neath the ice–water interface is modeled as a cylinder with constant height (5.7 mm). The volume and radius of this cylinder decrease (indicated by arrows) as the ice grows downward and CH4diffuses out, giving rise to the tapering shape of encapsulated bubbles.(b) Schematic of a closed Hotspot seep site. The cavity’s shape is deter-mined by field measurements, and its bottom radius determines that of the cylinder of gas beneath the ice–water interface. The height of this cylinder decreases as CH4diffuses out and the ice grows down-ward (indicated by arrows). Note the different scales in(a)and(b).
methanotrophic rate; andKS,CH4 andKS,O2 are the affinity
constants for CH4and O2, respectively. We used aKS,CH4 of
0.110 mg L−1 (Liikanen et al., 2002; Lofton et al., 2014), a KS,O2of 0.672 mg L
−1(Lidstrom and Somers, 1984), and an
estimatedrmaxof 0.48 mg L−1d−1based on measurements
in Goldstream Lake by Martinez-Cruz et al. (2014). In both years of the model, dissolved O2was depleted within 60 days
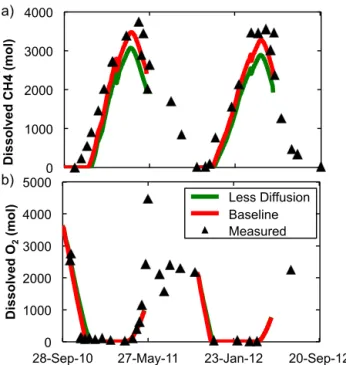
of freeze-up, after which the methanotrophic rate was es-sentially 0 until the spring ice-melt period (Fig. 8b). Mea-sured O2 concentrations followed a similar trend as
mod-eled O2concentrations during the ice-cover periods. We
as-sumed uniform water column CH4and O2concentrations in
the winter before the spring ice-melt periods, as we found that imposing the vertical gradients observed in our field measurements would have minor effects on the magnitude of CH4dissolution from bubbles and the magnitude of CH4
0 1000 2000 3000 4000
D
is
s
o
lv
e
d
C
H
4
(m
o
l)
a)
0 1000 2000 3000 4000 5000
28-Sep-10 27-May-11 23-Jan-12 20-Sep-12
Dissolved O
2
(
mol
) Less Diffusion
Baseline Measured b)
Less Diffusion
Figure 8.The measured amounts of(a)CH4and(b)O2dissolved in the water column of Goldstream Lake during the study period, and those calculated in the baseline and “less diffusion” versions of the model (Sect. A1).
underestimating the magnitude of CH4emissions from
flood-ing events durflood-ing the study period by ca. 5 %.
The rate of water–atmosphere gas exchange during ice melt depends on the extent of ice permeability and the ad-vection of water through ice, both of which are poorly con-strained. The methanotrophic rate depends on the availabil-ity of dissolved O2, which is spatially irregular. Furthermore,
methanotrophy sometimes does not resume until after an “in-duction period” following the reintro“in-duction of O2. Induction
periods of 0 to 20 d have been observed in soils and in Arc-tic lakes (Bender and Conrad, 1995; Dunfield et al., 1999; Martinez-Cruz et al., 2014).
To account for these uncertainties, the model includes two parameters adjusted to fit modeled amounts of dissolved CH4
and O2during the spring ice-melt periods to measurements
(Fig. 8). The amount in moles of CH4, R, released to the
atmosphere on each day by diffusion from the upper 1.25 m of the water column was calculated as follows:
R=s p1DCH4 [CH4]−[CH4]eq
, (7)
wheresis the total number of seep sites open to the atmo-sphere,p1is an adjustable parameter (with units m s site−1),
and [CH4] represents the average modeled CH4
concentra-tion in the upper layer. The amount of O2diffusing into the
upper layer from the atmosphere was calculated with the samep1 andsparameters. As suggested by field
measure-ments, O2did not diffuse into the lower layer (deeper than
1.25 m). The rate of CH4 consumption was calculated
ac-0 300 600
0 200 400
14 May 2 Jun 1 Jul 17 Jul 22 Sep 26 May 28 Jun 11 Jul 27 Jul 24 Aug 6 Oct
0 10 20
0
1
2 0
1
2
a) b) c)
D
e
p
th
(m
)
D
e
p
th
(m
)
d) e) f)
O2 Concentration (mM) CH4 (µM)
Temperature (˚C)
2011
2012
Figure 9.Measured depth profiles of(a, d)temperature,(b, e) dis-solved CH4concentration, and(c, f)dissolved O2concentration in the water column of Goldstream Lake during the summers of 2011 and 2012. 2011 profiles indicate that fall overturn had occurred by 6 October 2011.
cording to Eq. (6) and scaled by the second adjustable pa-rameter.
We did not observe a decrease in dissolved CH4or an
in-crease in O2in the hypolimnion of Goldstream Lake
imme-diately following ice-off, suggesting that the water column remained stratified as surface temperatures increased. Oth-ers have similarly observed water column stability in Arc-tic lakes during and after spring melt, which they attributed to intense solar radiation and the inflow of meltwater from surrounding areas (Bergmann and Welch, 1985; Burn, 2002; Bastviken et al., 2004). Measured CH4concentrations in the
upper 1 m of the water column increased significantly during a period of ca. 12 days in early May 2012 spanning the date of observed ice-off, suggesting significant upper-layer mix-ing durmix-ing that time. Measured temperature profiles indicate a similar phenomenon in May 2011. As an approximation, all CH4in the upper layer of the water column was released
to the atmosphere over a period of 5 days following ice-off. The rate of dissolved CH4 diffusion to the atmosphere
during the ice-free period was calculated by multiplying the difference between the measured surface CH4concentration
and the equilibrium CH4 concentration on each day by a
“gas-transfer coefficient”,k. We used akdetermined empir-ically by Cole and Caraco (1998), representing an averagek for the open-water period at Mirror Lake, a low-wind tem-perate lake. We converted it appropriately using a Schmidt number for CH4at 10◦C of 1052 (Wania et al., 2010), which
gave a k for CH4 of 1.82 cm h−1. As we did not measure
believe this did not significantly affect our results for two rea-sons: (1) Goldstream Lake is surrounded by trees, suggesting that wind speeds there are similar to those at the low-wind lake measured by Cole and Caraco, and (2) Cole and Caraco noted thatk is relatively independent of wind speed at low wind speeds, suggesting that any difference in average wind speed between Mirror Lake and Goldstream Lake would not have appreciably affected the value ofk. The value ofkwe used differed by 2 % from that applied by Kling et al. (1992) to lakes on the northern coastal plain of Alaska, which are presumably windier than Goldstream Lake. Kling et al. noted that they likely underestimated the rate of gas diffusion from these lakes, suggesting that applying this value ofkfor Gold-stream Lake is justified.
Measured concentrations from 2012 were used during the summer of 2011 because surface CH4 concentrations
were not measured in 2011. The similarities between CH4
concentration–depth profiles obtained during both open-water periods (Fig. 9) suggest that surface CH4
concentra-tions were also similar. The mean daily rate of CH4
dif-fusion to the atmosphere during both open-water periods (1.2 mmol m−2d−1) was within the range of observations for other boreal lakes (Phelps et al., 1998; Huttunen et al., 2003; Walter et al., 2006). We assumed that CH4not
emit-ted to the atmosphere during this period was consumed by methanotrophy.
During the summer of 2011, our measurements of wa-ter temperature, dissolved CH4, and dissolved O2indicated
a gradual deepening of the epilimnion in Goldstream Lake (Fig. 9). On 6 October 2011, we observed uniform depth profiles for all of these variables, low (<3 µM) dissolved CH4concentrations, and high (156 mM) O2concentrations,
suggesting that fall overturn had occurred by then. Similar trends in temperature and dissolved O2concentrations were
observed during the open-water period in 2012. Surface O2
concentrations remained high throughout this period in 2011, while surface CH4concentrations remained low, suggesting
that methanotrophy in the upper layer of the water column prevented the significant release of CH4 dissolved in the
hypolimnion to the atmosphere before and during overturn. Kankaala et al. (2007) similarly estimated that the majority (83–88 %) of dissolved CH4in the hypolimnion of a lake in
Finland was consumed by methanotrophy during fall over-turn. The amount of dissolved CH4before freeze-up was set
to 0, as suggested by our measurements, and the amount of dissolved O2was determined from measurements.
2.4 Statistical analysis
Heteroscedastic t tests were performed using Excel (Mi-crosoft, Redmond, Washington, USA).
0 1000 2000 3000 4000 5000 6000 7000
Winter Spring Open-Water Annual
C
H
4
(m
o
l)
Sediments Hotspot Seeps C Seeps B Seeps A Seeps
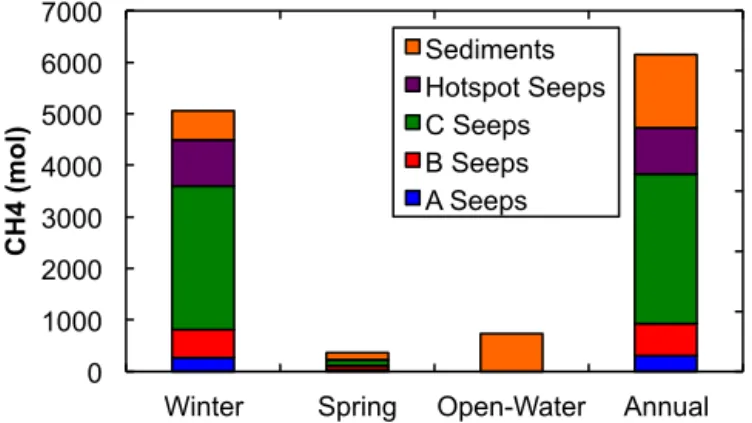
Figure 10.Seasonal and annual quantities of CH4dissolving into the water column from ebullition seeps and sediments in the base-line version of the model. Annually, 77 % of dissolved CH4 in Goldstream Lake originates from ebullition bubbles trapped be-neath winter ice, and 23 % from CH4diffusion from bottom sed-iments.
3 Results and discussion
3.1 Evidence of bubble dissolution
Our model of CH4 dissolution from submerged, gas-filled
mesocosm chambers (Sect. 2.2.7) suggests that a significant amount of CH4dissolves out of bubbles on the timescale of
bubble encapsulation (days to months). This model agrees with measured volumes and CH4 compositions of gas in
chambers, except at 145 and 165 h in the fall trial (Fig. 4). We observed defects in the ebullition deflectors on those cham-bers, and our weather observations indicate a decrease in barometric pressure prior to 145 h, which is known to induce ebullition events (Mattson and Likens, 1990). We therefore attribute these discrepancies to the addition of natural ebulli-tion bubbles.
Measurements of CH4concentrations in bubbles trapped
within the ice layer also indicate significant dissolution. At C seep sites, fresh bubbles collected immediately after their as-cent through the water column (Sect. 2.2.6) had significantly greater CH4concentrations than encapsulated bubbles (85 %
vs. 72 %,t test,p <0.05). However, we did not find signifi-cant differences between the concentrations of encapsulated vs. fresh A- and B-type bubbles due to a paucity of field mea-surements (zero and two encapsulated A- and B-type bubbles were sampled, respectively).
3.2 Baseline results
Both the model as described in Sect. 2.3 (the baseline ver-sion) and our measurements indicate that dissolved CH4
0 100 200 300
28/09/10 06/04/11 13/10/11 20/04/12
0 2 4 6 8
0 100 200 300
12/04/10 10/08/10 08/12/10 07/04/11
a)
Direct ebull. (75%) Overturn (3%)
Diffusion (11%) Flooding (2%)
IBS (8%)
CH4 concentration
b) ice-off freeze-up
Emi
ssi
o
n
s
(mo
l CH
4
d
-1)
CH
4
C
o
n
ce
n
trt
a
tio
n
(p
p
m)
Figure 11. (a)Modeled daily CH4emissions to the atmosphere by each of the five mechanisms discussed in Sect. 3.2 in the baseline version of the model. Percentages in the legend denote the fraction of total annual emissions from each emissions mode.(b)Measured atmospheric CH4concentrations over Goldstream Lake shown with modeled emissions during a portion of the study period. In 2011 ice-off occurred on 15 May, after the period shown.
al., 1998). Figure 10 shows the relative contributions of all sources of dissolved CH4in the model.
We calculated annual atmospheric CH4emissions by five
distinct mechanisms: (1) the direct release of bubbles from open ebullition seep sites (“direct ebullition”), (2) the release of free-phase gas trapped by the ice layer (“IBS”), (3) emis-sion during winter flooding events (“flooding”, Sect. 2.3.2), (4) diffusion of dissolved CH4from the water column
(“dif-fusion”), and (5) emission during partial lake overturn events (“overturn”). Bastviken et al. (2004) referred to the fifth mechanism as “storage flux”, but we termed it “overturn” to distinguish it from the release of “stored” CH4 by
dif-fusion through open ebullition seep sites during the spring melt period prior to lake overturn. Figure 11 shows emis-sions from the entire surface of Goldstream Lake by each of these modes.
Periods of zero emissions correspond to periods of atmo-spheric temperatures below –15◦C, when Hotspot seeps in the model were closed. When Hotspot seeps reopened, IBS emissions peaked due to the sudden release of gas within cavities. In reality, other factors, including ebullition rates and ice morphology, govern the opening and closing of Hotspot seep sites, so Hotspot IBS emissions may actually be distributed more evenly throughout the ice-cover period. This is a potential reason why peaks in the measured at-mospheric CH4concentration occurred more frequently than
peaks in Hotspot IBS emissions during the winter of 2010– 2011 (Fig. 11b). For this reason, and because there are no
field observations to validate our representation of the geom-etry of gas beneath the ice–water interface at Hotspot seep sites, our estimates of the magnitude and timing of Hotspot IBS emissions are likely uncertain. The average daily rate of atmospheric CH4emissions was highest during the spring
ice-melt periods (70 mol CH4d−1) due to emission of
dis-solved and trapped free-phase CH4, and lowest during the
winter ice-cover periods (24 mol CH4d−1) due to the
imped-iment of ebullition bubbles by lake ice. The atmospheric CH4
concentration measured above Goldstream Lake peaked sig-nificantly in early April 2011, when modeled IBS emissions also peaked (Fig. 11b). This supports our representation of bubble release prior to ice-off in the model (Sect. 2.3.4). A period of elevated atmospheric concentrations prior to ice-off was also observed in 2010. On average, 75 and 8 % of annual atmospheric CH4emissions occurred via direct
ebul-lition and IBS, respectively, during the 2-year study period (Fig. 11). IBS emissions constituted 6 and 9 % of annual emissions from Goldstream Lake in each year (2010–2011 and 2011–2012, respectively).
The majority (67 %) of CH4 released annually from the
bottom sediments of Goldstream Lake by ebullition seeps in the model was emitted directly to the atmosphere, unim-peded by lake ice (Fig. 12a). This proportion is determined primarily by the ebullition flux from Hotspot seeps, which remain open to the atmosphere throughout much of the ice-cover period. Ebullition from Hotspot seeps constitutes 48 % of the total annual seep ebullition flux from sediments in Goldstream Lake. Efforts to improve estimates of CH4
emis-sions from Goldstream Lake should therefore focus first on direct ebullition emissions, particularly those from Hotspots. Our estimate of direct ebullition is conservative because it does not include ebullition from non-seep “background” lo-cations. Walter et al. (2006) found that background ebulli-tion comprises 25 % of total annual CH4emissions from two
Siberian thermokarst lakes and was highest in the summer, when microbes in warm surface sediments produce CH4that
is released from non-seep locations. Our preliminary data from bubble traps over non-seep locations, as identified by bubble-free ice in the early winter, suggest that background ebullition also occurs in Goldstream Lake.
The model indicates that seasonal ice cover effectively im-pedes the release of ebullition CH4to the atmosphere. During
the ice-cover period, 44 % of CH4bubbling from sediments
dissolved into the water column when bubbles were trapped by ice. Conversely, 45 % was released by direct ebullition from Hotspots and A, B, and C seep sites open during spring melt, and 11 % was trapped as free-phase gas by ice. On an annual basis, 7 % of the total seep ebullition flux was trapped as IBS and later released to the atmosphere when ice melted. The majority of IBS emissions was associated with Hotspots reopening in the winter (Fig. 12a).
Of the CH4 in seep ebullition bubbles impeded by lake
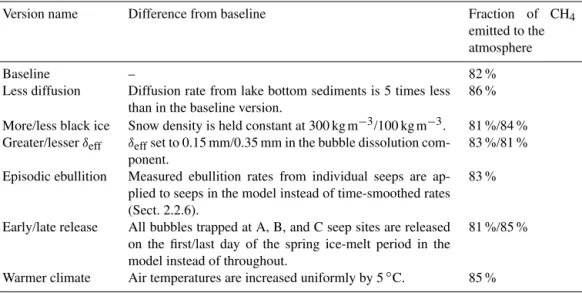
Table 1.Names of the versions of the model discussed as sensitivity analyses in Sects. 3.4 and 3.5 and Appendix A, and descriptions of how they differ from the baseline version, described in Sect. 2.3. At right, the fraction of CH4in each version released annually from the sediments of Goldstream Lake, either by diffusion or ebullition, that is emitted to the atmosphere without being consumed by methanotrophy.
Version name Difference from baseline Fraction of CH4
emitted to the atmosphere
Baseline – 82 %
Less diffusion Diffusion rate from lake bottom sediments is 5 times less than in the baseline version.
86 %
More/less black ice Snow density is held constant at 300 kg m−3/100 kg m−3. 81 %/84 % Greater/lesserδeff δeffset to 0.15 mm/0.35 mm in the bubble dissolution
com-ponent.
83 %/81 %
Episodic ebullition Measured ebullition rates from individual seeps are ap-plied to seeps in the model instead of time-smoothed rates (Sect. 2.2.6).
83 %
Early/late release All bubbles trapped at A, B, and C seep sites are released on the first/last day of the spring ice-melt period in the model instead of throughout.
81 %/85 %
Warmer climate Air temperatures are increased uniformly by 5◦C. 85 %
(Fig. 12b). In the model, the extent of winter methanotro-phy is determined entirely by the amount of O2dissolved in
the water column at the time of freeze-up. Eighty-two per-cent of the total amount of CH4 emitted annually from the
sediments of Goldstream Lake by seep ebullition and diffu-sion reached the atmosphere without being oxidized (Table 1). Because the amount of CH4that dissolves out of bubbles
during the ice-cover period is much greater than the amount that diffuses out of sediments (Fig. 10), ice cover facilitates substantially greater CH4 dissolution into the water column
and therefore increased methanotrophy.
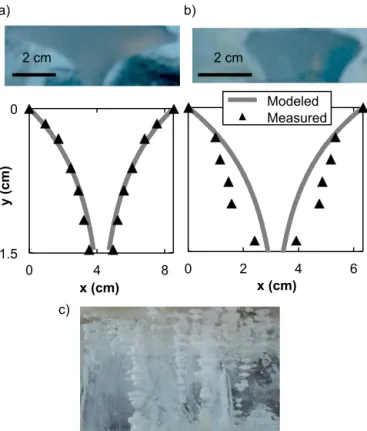
The shapes of ebullition bubbles in harvested ice blocks (Sect. 2.2.6) varied greatly, depending on the seep type, ice growth rates, and the degree of bubble coalescence. Individ-ual bubbles often tapered at the bottom, but vertically joined bubbles sometimes had tapering tops (Fig. 13c). For com-parison with observations, the bubble dissolution component of the model was executed in isolation to simulate CH4
dis-solution from a single trapped bubble, assuming a constant ice growth rate and zero dissolved CH4 concentration. We
fit the shapes of modeled bubbles to measurements by ad-justing the ice growth rate and initial volume. Results agreed reasonably with measurements of bubbles that tapered at the bottom, and fits were better for bubbles with more concave sides (Fig. 13a). Bubble radii calculated assuming a constant dissolved CH4concentration of 387 µM, the maximum
con-centration observed during the study period, differed from those in our original results by no more than 1 mm, suggest-ing that bubble shapes are more strongly influenced by the ice growth rate than the rate of CH4 dissolution.
Discrep-ancies between calculated and measured shapes likely arose from fluctuations in the ice growth rate and the error
associ-ated with modeling gas beneath the ice–water interface as a cylinder with constant height.
In the model, the decrease in bubble volume due to CH4
dissolution gives rise to the shape of bubbles that taper at the bottom, so no bubbles had flat bottoms or tapering tops. We attribute observations in lake ice blocks of the occasional formation of bubbles with this opposite orientation to the in-sulating effect of gas frozen within the ice layer (Engram et al., 2013), which causes ice around trapped bubbles to grow faster than ice directly beneath, giving rise to dome-shaped or conical cavities at ebullition seep sites. This effect may compete with the effect of volume loss to determine bubble shapes, therefore causing a distribution of both orientations. Further investigation is needed to determine the effect of lo-calized ice growth inhibition on bubble shapes and CH4
dis-solution.
Modeled CH4concentrations of encapsulated bubbles did
not differ significantly from measurements for bubbles at B and C seep sites (ttests,p >0.05); however, only two encap-sulated B-type bubbles and four C-type bubbles were sam-pled from Goldstream Lake. To increase the sample size, we also compared modeled concentrations to measurements of 30 encapsulated bubbles from four other thermokarst lakes in interior Alaska, the northern Seward Peninsula in Alaska, and northern Siberia (Walter et al., 2008; Sepulveda-Jauregui et al., 2014b). It was often impossible to classify ebullition sites beneath white ice during the spring ice-melt period as A, B, or C, so measurements from all ebullition classes were pooled and adjusted to account for observed differences in fresh bubble CH4 concentrations among lakes
28%
39% 21%
5% 2%
5% Direct Ebullition (A, B, C)
Direct Ebullition (Hotspot) Dissolved (A, B, C) Dissolved (Hotspot) IBS (A, B, C) IBS (Hotspot) a)
24%
11%
21% 6%
6%
9%
23%
Winter Methanotrophy Spring Methanotrophy Summer Methanotrophy Overflow
Spring Diffusion Overturn
Summer Diffusion b)
Figure 12. The fates of seep ebullition bubbles(a)and dissolved CH4(b)during the 2-year study period, as calculated in the base-line version of the model. The names of the various modes of CH4 emission are discussed in Sect. 3.2.
(68 %;ttest,p >0.05), but the mean adjusted concentration for all five lakes (60 %) was significantly lower than modeled concentrations (69 %;ttest,p <0.05).
As a sensitivity analysis, we also constructed a version of the model, “episodic ebullition”, in which individual seep fluxes, rather than smoothed fluxes, were applied during the ice-cover periods in the model. We found that encapsulated bubbles in the episodic ebullition version had a mean CH4
concentration (32 %) significantly less than both the mean measured concentration for all five lakes and the mean mod-eled concentration when smoothed fluxes were applied (t tests, p <0.001). The larger surface area, on average, of trapped gas pockets at non-Hotspot seep sites in the episodic ebullition version allowed more CH4to dissolve out after
in-dividual ebullition events, despite the fact that gas pockets were encapsulated faster by ice (due to extended periods of no ebullition). Consequently, IBS emission from A, B, and C seep sites was 28 % less than in the baseline version. The episodic ebullition version appeared to underestimate encap-sulated bubble CH4concentrations in comparison to
observa-tions from the five thermokarst lakes. One likely reason for this is that we assume the 5.7 mm bubble height measured on 20–40 mL gas pockets applies to all bubbles, but a 5000 mL ebullition event, which can occur in the episodic ebullition version, produces larger gas pockets with possibly different bubble heights. Secondly, we did not account for lateral mi-gration of bubbles beneath ice in the model.
a)
2 cm 2 cm
b)
0 4 8
0
1.5
y
(c
m
)
x (cm)
0 2 4 6
x (cm)
Modeled Measured
c)
Figure 13.The shapes of bubbles encapsulated by lake ice above an A-type ebullition seep. Field measurements of bubbles(a)and(b) are compared to shapes calculated in the bubble dissolution com-ponent of the model (Sect. 2.3.3). Plots represent a side profile of bubbles, with theyaxis representing depth within the ice layer. Note the different scales on both axes.(c)Encapsulated bubbles oriented in both directions, either with flat bottoms and tapering tops or vice-versa. Photos courtesy of Melanie Engram.
Results suggest that our slight overestimation of encap-sulated bubble CH4 concentrations in the baseline version
of the model arises from our applying smoothed ebullition fluxes. However, applying smoothed ebullition fluxes is jus-tified for three reasons: (1) the magnitude of CH4
dissolu-tion into the water column in the model was more sensi-tive to the magnitude of the CH4ebullition flux during the
ice-cover period than the timing of this release. This mag-nitude is more accurately represented by the larger sample size of measured seep fluxes that informed our calculation of smoothed fluxes. (2) The majority of CH4in bubbles
im-peded by lake ice dissolves into the water column (Fig. 12), so major discrepancies in the mean CH4concentration of
en-capsulated bubbles (69 % baseline vs. 32 % episodic ebulli-tion) result in only minor discrepancies in the magnitude of CH4 dissolution into the water column and therefore in the
magnitude of annual CH4 emissions. In the episodic
ebul-lition version, the total magnitude of CH4dissolution from
bubbles trapped at A, B, and C seep sites and the total annual CH4emissions from Goldstream Lake were, respectively, 2.5
(3) It is more computationally efficient to execute the model using smoothed fluxes than with a large number of individual seeps.
3.3 Additional “tinies” ebullition seeps
Our field observations indicate a previously undefined class of ebullition seeps, “tinies”, in Goldstream Lake. Bubbles released from tinies seeps are trapped beneath lake ice typ-ically without lateral merging (similar to A-type bubbles). However, unlike individual A, B, C, and Hotspot seeps, which have a more focused point of release and sites with tightly clustered and/or coalesced ice bubbles (usually less than 0.8 m2 in area), tinies bubbles are typically found in patches that span several square meters. Most tinies seeps re-lease bubbles throughout the winter (K. M. Walter Anthony, unpublished data). Preliminary measurements indicate that tinies seeps occupy approximately 1.4 % of the area of Gold-stream Lake and that including ebullition from tinies seeps would increase our estimate of total seep ebullition in Gold-stream Lake by 2 to 9 %. We estimate that including these seeps in the model would result in a 2 % increase in the amount of dissolved CH4 in Goldstream Lake during the
ice-cover periods, although this estimate is uncertain due to a lack of constraints on our representation of tinies in the model. These results warrant further investigation and char-acterization of tinies seeps.
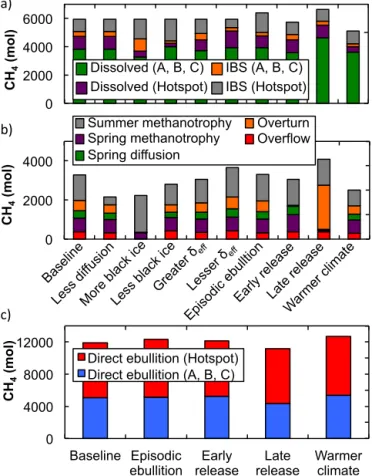
3.4 Sensitivity analysis
Because of the many approximations in the formulation of the model, its output often differed from measurements. These discrepancies informed the construction of additional modified versions of the model used to estimate uncertainties in our results arising from these approximations. The modifi-cations in these versions are summarized in Table 1, and their results are discussed in detail in Appendix A. Our findings imply two key conclusions. (1) Secondary processes that in-fluence the dissolved CH4concentration in Goldstream Lake
during the ice-cover periods, such as CH4diffusion from
bot-tom sediments and methanotrophy, do not appreciably affect the magnitudes of IBS emissions. (2) The magnitudes of CH4
emission and oxidation during spring ice-melt and summer open-water periods are not well constrained in the model, and further investigation of these processes is therefore nec-essary.
3.5 Future climate change
We constructed a “warmer climate” version of the model, in which air temperatures were increased uniformly by 5◦C, to simulate future climate change. The only processes in the model affected were ice growth and the closing of Hotspot seep sites to the atmosphere. In this version, freeze-up was delayed by 15 and 8 days in 2010 and 2011, respectively, and the average yearly maximum ice thickness was 12 %
less than in the baseline version. The resulting increase in total atmospheric emissions was driven primarily by a 7 % increase in direct ebullition emissions arising from shorter ice-cover periods and fewer days on which Hotspots were closed (Fig. A1c). Less CH4dissolved into the water column
from ebullition seep sites despite slower ice growth, resulting in decreased diffusion and IBS emissions during the spring ice-melt periods (Fig. A1b). A greater proportion (85 % vs. 82 %) of CH4released annually from sediments reached the
atmosphere than in the baseline version (Table 1). As we did not account for the temperature dependence of methanogen-esis, our estimates of the increase in CH4emissions due to
warming are likely conservative.
4 Conclusions
We present a model of CH4transport and emission processes
in seasonally ice-covered lakes, focusing primarily on CH4
dissolution from bubbles trapped beneath lake ice and IBS emissions. Close agreement between the model’s output and our field measurements suggests that our model accurately represents many of these processes in Goldstream Lake and other thermokarst lakes.
IBS emissions constituted 8 % of total annual emissions from Goldstream Lake during the 2-year study period. This quantity is primarily determined by ebullition and lake ice growth; it is insensitive to the amount of dissolved CH4
be-cause the water column CH4 concentration is typically
un-dersaturated relative to concentrations in bubbles. On an an-nual basis, a majority of CH4 in ebullition bubbles in the
model is released directly to the atmosphere, unimpeded by lake ice. Methanotrophy determines the extent to which lake ice reduces net atmospheric CH4 emissions. In the model,
the magnitudes of methanotrophy during the winter and sum-mer periods are constrained by measurements of dissolved gases. The magnitude of spring methanotrophy was not well constrained due to uncertainties in the timing of CH4
re-lease from trapped ebullition seep sites, the rate of water– atmosphere gas exchange, and the possible induction period of methanotrophy. The amount of dissolved CH4subject to
methanotrophy during spring ice melt is significant (21 % of CH4 released annually by diffusion and ebullition from
the sediments of Goldstream Lake), so further investigation is needed to reduce this source of uncertainty in calculated CH4 emissions. Our model indicates that seasonal lake ice
increases the amount of CH4consumed by methanotrophs by
facilitating CH4dissolution from ice-trapped bubbles prior to
encapsulation. Therefore, shorter ice-cover seasons and less black ice growth simulated in a warmer climate will likely increase CH4 emissions from northern lakes. The model’s