Replication of the Shrimp Virus WSSV
Depends on Glutamate-Driven Anaplerosis
Chun-Yuan Li1, Yi-Jan Wang1, Shiao-Wei Huang2, Cheng-Shun Cheng1, Han-Ching Wang1*
1Institute of Biotechnology, College of Bioscience and Biotechnology, National Cheng Kung University, Tainan, Taiwan,2Department of Life Science, College of Life Science, National Taiwan University, Taipei, Taiwan
Abstract
Infection with the white spot syndrome virus (WSSV) induces a metabolic shift in shrimp that resembles the“Warburg effect”in mammalian cells. This effect is triggered via activa-tion of the PI3K-Akt-mTOR pathway, and it is usually accompanied by the activaactiva-tion of other metabolic pathways that provide energy and direct the flow of carbon and nitrogen. Here we show that unlike the glutamine metabolism (glutaminolysis) seen in most cancer cells to double deaminate glutamine to produce glutamate and the TCA cycle intermediate
α-ketoglutarate (α-KG), at the WSSV genome replication stage (12 hpi), although
glutamin-ase (GLS) expression was upregulated, only glutamate was taken up by the hemocytes of WSSV-infected shrimp. At the same time, we observed an increase in the activity of the two enzymes that convert glutamate toα-KG, glutamate dehydrogenase (GDH) and aspartate
aminotransferase (ASAT).α-ketoglutarate concentration was also increased. A series of
inhibition experiments suggested that the up-regulation of GDH is regulated by mTORC2, and that the PI3K-mTORC1 pathway is not involved. Suppression of GDH and ASAT by dsRNA silencing showed that both of these enzymes are important for WSSV replication. In GDH-silenced shrimp, direct replenishment ofα-KG rescued both ATP production and
WSSV replication. From these results, we propose a model of glutamate-driven anaplerosis that fuels the TCA cycle viaα-KG and ultimately supports WSSV replication.
Introduction
Since the early 1990s, white spot disease (WSD) has continued to infect cultured shrimp, and this has led to enormous economic losses [1]. Globally these losses approach $10 billion [2]. Because WSD is considered the most serious shrimp viral disease, and because it has had such a devastating impact on the shrimp aquaculture industry, the World Animal Health Organisa-tion (OIE) has listed WSD as a notifiable crustacean disease. The causative agent of WSD is a novel, large dsDNA virus known as white spot syndrome virus (WSSV) [3]. In order to develop effective anti-WSSV strategies, it is essential to understand the pathogenesis of this unique virus as well as the ways in which it interacts with the host. Recently, by using a systems biology OPEN ACCESS
Citation:Li C-Y, Wang Y-J, Huang S-W, Cheng C-S, Wang H-C (2016) Replication of the Shrimp Virus WSSV Depends on Glutamate-Driven Anaplerosis. PLoS ONE 11(1): e0146902. doi:10.1371/journal. pone.0146902
Editor:Irene Söderhäll, Uppsala University, SWEDEN
Received:August 12, 2015
Accepted:December 23, 2015
Published:January 11, 2016
Copyright:© 2016 Li et al. This is an open access article distributed under the terms of theCreative Commons Attribution License, which permits unrestricted use, distribution, and reproduction in any medium, provided the original author and source are credited.
Data Availability Statement:All relevant data are within the paper and its Supporting Information files.
Funding:HCW received the funding (MOST 104-2321-B-006-027; MOST 104-2622-B-006-009 -CC1) from the Ministry of Science and Technology (https:// www.most.gov.tw/). This study was supported financially by these funds. The funders had no role in study design, data collection and analysis, decision to publish, or preparation of the manuscript.
approach, WSSV became the first invertebrate virus known to induce the Warburg effect in infected cells [4,5].
The Warburg effect, also known as aerobic glycolysis, is the name given to the abnormal glucose consumption and lactate accumulation that occurs under conditions of sufficient oxy-gen in cancer cells [6]. This effect is also produced by several vertebrate viruses during replica-tion, such as the human cytomegalovirus (HCMV) [7] and human papillomavirus (HPV) [8]. In vertebrates, the metabolic shifts associated with the Warburg effect are accompanied by acti-vation of several biosynthesis pathways, including the pentose phosphate pathway, nucleotide biosynthesis, lipid synthesis and glutaminolysis [9,10]. Global proteomics and metabolomics studies have shown that the special Warburg effect-like metabolic changes that are seen in WSSV-infected cells during the first WSSV replication cycle (22–24 hpi), are likewise associ-ated with changes that lead to the production of both energy and the precursors of macromo-lecular biosynthesis [5]. It has also been established that the WSSV-induced Warburg effect is required for completing WSSV replication [4,5,11].
Two of the most important carbon sources used by mammalian cells are glucose and glu-tamine. Under the Warburg effect, glucose is converted to pyruvate and is then diverted into lactate production, rather than entering the tricarboxylic acid (TCA) cycle [12,13,14]. In cancer cells, however, the TCA cycle is maintained by exogenous glutamine, which is used as an alternative carbon source that replenishes TCA cycle intermediates (anaplerosis) via gluta-mine metabolism (glutaminolysis or glutagluta-mine-driven anaplerosis) [13,15,16]. The key intermediate in this process isα-ketoglutarate (α-KG): glutaminase (GLS) converts gluta-mine into glutamate, which in turn is converted intoα-KG by glutamate dehydrogenase (GDH) and/or aspartate aminotransferase (ASAT) (Fig 1A; [17]). Anaplerotic fill of the TCA cycle byα-KG allows the cycle to keep functioning even under conditions of aerobic glycoly-sis, and this provides NADH for oxidative phosphorylation as well as intermediates that serve as precursors for biosynthesis [15], such as aspartate for nucleotide synthesis and citrate forde novolipid synthesis [18,19,20]. The importance of the TCA cycle and the need for it to keep functioning explains why most cancer cells undergoing the Warburg effect show a dramatic increase in glutaminolysis [15,18]. In the present paper, we investigate whether similar changes in glutaminolysis also occur during the Warburg-like effect that is induced by WSSV in infected shrimp cells and if so how these metabolic alterations might benefit WSSV genome replication.
Fig 1. The glutaminolysis pathway is driven by the uptake of glutamate at 12 hpi.(A) Simplified schematic of the glutaminolysis metabolic pathway. Abbreviations: GLS, glutaminase; GLNA, glutamine synthetase; GDH, glutamate dehydrogenase; ASAT, aspartate aminotransferase;α-KG,α-ketoglutarate;
Materials and Methods
Experimental animals and virus inoculum
Batches ofLitopenaeus vannameishrimp (~3g of body weight) were purchased from the Aquatic Animal Center, National Taiwan Ocean University (NTOU), and maintained for 1~3 days in water tank systems containing sterilized seawater (30 ppt at 25~27°C). White spot syn-drome virus (WSSV) (Taiwan isolate, GenBank accession no. AF440570) was used for all the challenge experiments. For the preparation of WSSV stock, hemolymph was collected from WSSV-infected moribund shrimp and centrifuged at 4°C at 10,000 g for 10 min. The superna-tant containing the WSSV was collected and diluted by using 1x phosphate-buffered saline (PBS) (137 mM NaCl, 2.7 mM KCl, 10 mM Na2HPO4,2 mM KH2PO4) at a ratio 1:4 and then
stored at−80°C before use. The final inoculums were prepared from the virus stock by 10,000x
dilution with 1x PBS before being used. An IQ REAL kit was sued to analyze aliquots of the diluted inoculum, and the viral copy number was found to be 2.2 copies/μl. Each shrimp received a 100μl WSSV inoculum (i.e. 220 WSSV copies), a dosage which caused approxi-mately 50% mortality at 72h post injection.
Using a previously compiled database of liquid chromatography
electrospray ionization mass spectrometry (LC-ESI-MS) data to identify
the changes of glutamine and glutamate in hemocytes and hemolymph
collected from WSSV-infected shrimp
In a previous study, we used LC-ESI-MS to measure the metabolic changes induced by WSSV in hemocytes and hemolymph collected from WSSV-infected shrimp that had been pretreated with the mTOR inhibitor Torin1 or with PEG solvent (0.25% polyethylene glycol, 0.25% Tween 20 and 0.15 M NaCl) [5]. These results were subsequently compiled into a metabolomic database that we used here to analyze changes in the levels of glutamine and glutamate during WSSV replication. Two hours after pretreatment with Torin1 or PEG solvent, the shrimp in this experiment were challenged with WSSV or PBS by intramuscular injection, and at 12 and 24 hpi, hemocytes and hemolymph were collected using an anticoagulant (450 mM NaCl, 10 mM KCl, 10 mM EDTA, 10 mM Tris-HCl, pH 7.5). From each experimental group, 4–5 shrimp samples were then prepared (10 shrimp in each sample) and used for LC-ESI-MS meta-bolic analysis as described in our previous study [5].
Effect of the inhibitors Torin1, LY294002 and Rapamycin on the mRNA
expression of glutaminolysis-related genes
Since all of the hemocyte and hemolymph samples taken from the above Torin1 and PEG only (control) groups were used for metabolomics analysis, pleopod samples (4–5 samples from each group; 10 pleopods in each sample) were also collected from these groups.
To evaluate the involvement of the PI3K-mTORC1 pathway, 10 individual hemocyte sam-ples were collected from other groups of WSSV-infected shrimp that had been pretreated by injection with 100μl of the inhibitor LY294002 (dissolved in 10% DMSO and diluted with PBS; 0.625μg/g shrimp) or with vehicle only (0.01% DMSO; diluted with PBS). WSSV has not been previously published.) Asterisks indicate statistically significant differences between the PBS control and WSSV infection groups (Student’s t test,*p<0.05,**p<0.01).
challenge by injection with 100μl of virus inoculum was performed 2 hours after this pretreat-ment, and the hemocyte samples were collected at 12 and 24 hpi.
Lastly, to investigate the effect of inhibiting mTORC1, groups of shrimp were pretreated with Rapamycin (0.02μg/g shrimp) or PEG solvent by injection 2 h before being challenged with WSSV. At 12 and 24 h after WSSV challenge, four hemocyte samples were collected from the shrimp in each group, with each sample being taken from 3 shrimp.
For all of the above samples, the mRNA expression levels of the enzymes GDH, ASAT and GLS were determined by real-time PCR as described below.
Measurement of GDH activity after WSSV infection
Hemocytes from shrimp injected with WSSV or PBS (5 samples from each group, with hemo-cytes from 3 shrimp in each sample) were collected at 12 and 24 hpi. The hemocyte samples were homogenized by using plastic sticks in microtubes in 200μl of the ice-cold GDH assay buffer supplied with a commercial glutamate dehydrogenase activity colorimetric assay kit (Biovision) and then centrifuged at 4°C (13,000 g for 10 min) to remove the cell debris. Protein concentrations in each sample were measured using a Bio-Rad protein assay, and approxi-mately 20μg of protein from each sample was placed in the wells of a 96-well plate with the final volume adjusted to 50μl/well by adding GDH assay buffer. These 50μl lysate samples as well as the standards supplied with the GDH activity kit (50μl/well) were then mixed with a 100μl reaction mixture containing 82μl GDH assay buffer, 8μl GDH developer and 10μl 2M glutamate. The samples were incubated at 37°C for 95 min (T1), and the absorbance of each sample was then measured at 450 nm to give the Anvalue. After incubating for another 30 min
(for a total of 125 min [T2] of incubation), the absorbance of each sample was measured again at 450 nm to give the An+1value. After the difference in absorbance (An+1–An) was converted
to the NADH amount (B) by using an NADH standard curve, the GDH activity was then cal-culated as follows: GDH activity (mU/mg) = B / ([T2-T1] × 20μg). Statistically significant dif-ferences between groups were analyzed by Student'st-test.
Measurement of ASAT activity after WSSV infection
Hemocytes from shrimp injected with WSSV or PBS (4 samples from each group, with hemo-cytes from 4 shrimp in each sample) were collected at 12 and 24 hpi. The hemocyte samples were homogenized by using plastic sticks in a microtubes in 200μl of the ice-cold AST assay buffer supplied with a commercial aspartate aminotransferase (AST, ASAT or SGOT) activity colorimetric assay kit (Biovision) and then centrifuged at 4°C (13,000 g for 10 min) to remove the cell debris. Protein concentrations in each sample were measured using a Bio-Rad protein assay, and approximately 1μg of protein from each sample was placed in the wells of a 96-well plate with the final volume adjusted to 50μl/well by adding AST assay buffer. These 50μl lysate samples as well as the standards and positive control supplied with the AST activity kit (50μl/ well) were then mixed with a 100μl reaction mixture containing 80μl AST assay buffer, 2μl AST enzyme mix, 8μl developer and 10μl AST substrate. The samples were incubated at 37°C for 140 min (T1), and the absorbance of each sample was then measured at 450 nm to give the Anvalue. After incubating for another 60 min (for a total of 12 hr [T2] of incubation), the
absorbance of each sample was measured again at 450 nm to give the An+1value. After the
dif-ference in absorbance (An+1–An) was converted to the glutamate amount (B) by using an
Determination of the concentration of
α
-ketoglutarate levels after WSSV
infection
At 12 and 24 h after injection with WSSV or PBS, shrimp stomachs were collected (5 samples from each group at each time point, with 10 shrimp stomachs in each sample), and an Alpha-Ketoglutarate Colorimetric/Fluorometric Assay Kit (Biovision) was used to measure the ketoglutarate levels according to the manufacturer’s instructions. Samples of approximately 30 mg were placed in 150μl ofα-KG assay buffer and homogenized by using plastic sticks in microtubes. Proteins and insoluble debris were then removed by using 10 kDa molecular weights cut off spin columns. Using a 96-well plate system, lysate samples (40μl per well) were added into duplicate wells (one forα-KG measurement and another one for background control) and brought to a final volume of 50μl withα-KG assay buffer. For theα-KG mea-surement, each well was mixed with a reaction mixture (50μl) consisting of 44μlα-KG assay buffer, 2μlα-KG converting enzyme, 2μl enzyme mix and 2μl probe. For the background control, in order to subtract the signal due to the pyruvate that was already present, 50μl of the reaction mixture without theα-KG converting enzyme (and with two additionalμl ofα -KG assay buffer) was used instead. Incubation proceeded at 37°C for 30 min in the dark, and the absorbance of each sample was measured at 570 nm. After subtraction of the background value, the corrected OD570values were applied to the standard curve to get the amount ofα
-KG (xnmol). Theα-KG concentrations were then calculated as follows:α-KG concentration (mM) =x/40μl. Statistically significant differences between groups were analyzed by Stu-dent'st-test.
In vivo
silencing of LvGDH and LvASAT expression by dsRNA mediated
RNA interference
The dsRNAs were prepared as described in our previous study [11]. As is common practice in shrimp silencing studies, EGFP dsRNA was used as the non-specific control. Briefly, partial sequences of GDH, ASAT and the EGFP control were amplified by PCR with the following primer sets, respectively: GDH-F/GDH-R, ASAT-F/ASAT-R and EGFP-F/EGFP-R (Table 1). T7 promoter sequence was then added to the 5’and 3’ends of these PCR amplicons by per-forming PCR with the following primer sets: GDH: T7-GDH-F/GDH-R and GDH-F/T7-GDH-R; ASAT: T7-ASAT-F/ASAT-R and ASAT-F/T7-ASAT-R; EGFP control: T7-EGFP-F/ EGFP-R and EGFP-F/ T7-EGFP-R (Table 1). After the ssRNAs were synthesized by using the T7 RiboMAX Express large-scale RNA production system (Promega), the corresponding pairs of ssRNAs were mixed gently, incubated at 70°C for 20 min and cooled down to room temper-ature for 30 min to form the dsRNAs. Next, each dsRNA was purified by the phenol/chloro-form/isoamyl alcohol method. The quantity and quality of each dsRNA was measure by UV spectrophotometer and agarose gel electrophoresis, respectively. The specific silencing ability of the GDH dsRNA was confirmed by Western blotting (S1 Fig). (Unfortunately this method could not be used for ASAT dsRNA because a suitable antibody is not available.) The dsRNA products were stored at -80°C until used for the followingin vivosilencing experiment.
Replenishment of
α
-ketoglutarate
Three days after LvGDH dsRNA injection and 2 h after WSSV challenge, shrimp (~3g) were injected with dimethyl-α-oxoglutarate (α-KG; Sigma-Aldrich; 531μgα-KG/g shrimp). At 24 hpi, four samples of hemocytes and pleopods (3 shrimp per sample) were collected. The ATP/ ADP ratio in the hemocyte samples was measured as described below, and the gene expression Table 1. PCR primers used in this study.
Gene Primer name Primer sequence (5’-3’) Usage
LvGDH
GDH-F 5’-GATTGGTATCACTCCGGGAT-3’ Cloning of the partial cDNA
GDH-R 5’-GACACAGTTACACCACCAG-3’ Cloning of the partial cDNA
T7-GDH-F 5’-TAATACGACTCACTATAGGGAGAGATTGGTATCACTCCGGGAT-3’ dsRNA synthesis T7-GDH-R 5’-TAATACGACTCACTATAGGGAGAGACACAGTTACACCACCAG-3’ dsRNA synthesis
GDH-real-F 5’-TGAGGAGAAGCGCAACAAGA-3’ Real-time PCR
GDH-real-R 5’-TGGCAGGGCTCCATGATC-3’ Real-time PCR
LvASAT
LvASAT-2-real F 5’- CGCTTCGCTCTGCCAACT -3’ Real-time PCR
LvASAT-2-real R 5’- CGACGGCCATTTCGAAAA -3’ Real-time PCR
ASAT-F 5’- CGCGGAAGGAATACGCTTC-3’ Cloning of the partial cDNA
ASAT-R 5’- CGCCAAGTNCCAGAAAAACC -3’ Cloning of the partial cDNA
T7-ASAT-F 5’- TAATACGACTCACTATAGGGAGACGCGGAAGGAATACGCTTCG -3’ dsRNA synthesis T7-ASAT-R 5’- TAATACGACTCACTATAGGGAGACGCCAAGTNCCAGAAAAACC -3’ dsRNA synthesis
PmSLC7A1
SLC7A1-real-F 5’- GGTGCCCGTGTACCAAAGG -3’ Real-time PCR
SLC7A1-real-R 5’- TCGCCAACGCATACATAGCT -3’ Real-time PCR
PmSLC1A2
SLC1A2-real-F 5’- GGGCTCCTCAGGCAAGATG -3’ Real-time PCR
SLC1A2-real-R 5’- AGCCAGAATAGTGGTGGAGAAGTAA -3’ Real-time PCR
PmGLS
GLS-real-F 5’- CGTCAGGGACGTCCTCT -3’ Real-time PCR
GLS-real-R 5’- CGAGTAGTCGTACATGC -3’ Real-time PCR
EGFP
EGFP-F 5’-GTTCAGCGTGTCCGGCGAG-3’ dsRNA synthesis
EGFP-R 5’-GTTCTTCTGCTTGTCGGCC-3’ dsRNA synthesis
T7-EGFP-F 5’-TAATACGACTCACTATAGGGAGAGTTCAGCGTGTCCGGCGAG -3’ dsRNA synthesis T7-EGFP-R 5’-TAATACGACTCACTATAGGGAGAGTTCTTCTGCTTGTCGGCC -3’ dsRNA synthesis
EF1α
EF1α-real-F 5’-ACGTGTCCGTGAAGGATCTGAA-3’ Real-time PCR
EF1α-real-R 5’-TCCTTGGCAGGGTCGTTCTT-3’ Real-time PCR
WSSV VP28
VP28-real-F 5’-AGTTGGCACCTTTGTGTGTGGTA-3’ Real-time PCR
VP28-real-R 5’-TTTCCACCGGCGGTAGCT-3’ Real-time PCR
Others
Anchor-dTv 5’-GACCACGCGTATCGATGTCGACTTTTTTTTTTTTTTTTV-3’ cDNA synthesis
M13F 5’- GTTTTCCCAGTCACGAC -3’ colony PCR check
M13R 5’-TCACACAGGAAACAGCTATGAC-3’ colony PCR check
The added T7 promoter sequence is underlined.
of GDH and WSSV VP28 was measured by using real-time PCR. The IQ Real™WSSV quanti-tative system (GeneReach Biotechnology Corp.) was used to measure the WSSV genome copy number in the pleopod samples. Statistically significant differences between the LvGDH exper-imental group and the EGFP non-specific control group were analyzed by Student'st-test.
Quantification of host genes and the WSSV viral gene VP28 by real-time
PCR
Total RNA was extracted from the shrimp samples and subjected to cDNA synthesis using Superscriptase II Reverse Transcriptase (Invitrogen) with Anchor-dTv primer (Table 1). The cDNA samples were then stored at -20°C until used to determine the mRNA expression of the respective target genes by real-time PCR.
The stored samples of cDNA were subjected to real-time PCR using the Bio-Rad detection system with KAPA SYBR1FAST Master Mix (KAPA) to measure the relative expression levels of the host genes GDH, ASAT, GLS, SCL7A1, SLC1A2 and EF1αas well as the highly expressed WSSV structural gene VP28. Specific primer sets used in this study are listed in
Table 1. As EF1αwas used as an internal control [22], data values were normalized to EF1α cDNA and calculated by the 2-ΔΔCTmethod. Statistically significant differences between groups were analyzed either by Student'st-test, or else, if the distribution of the samples was non-nor-mal, by the Mann-Whitney U test.
Quantification of the WSSV genome copy number
The pleopod samples from the silencing experiment were subjected to genomic DNA extrac-tion using a DTAB/CTAB DNA extracextrac-tion kit (GeneReach Biotechnology Corp.), and the copy numbers of WSSV genomic DNA were quantified by the IQ Real™WSSV quantitative system (GeneReach Biotechnology Corp.). Statistically significant differences between groups were analyzed by Student'st-test.
Determination of ATP/ADP ratio
The ATP/ADP ratio in the hemocyte samples collected from theα-KG replenishment experi-ment was determined with an ApoSENSOR™ADP/ATP Ratio Bioluminescent Assay Kit (Bio-vision) using a slightly modified protocol as described in a previous study [4]. For each sample in a 96-well plate, 10μl of hemocytes were mixed with 100μl Nucleotide Releasing Buffer and shaken for 5 min. After adding 1μl ATP Monitoring Enzyme to each well and allowing the reaction to proceed for 2 min, the luminescence (B) was determined by using a luminometer. After 10 min, the luminescence was recorded again to provide another data point (C). Next, to measure the ADP level in the cell, 1μl ADP Converting Enzyme was added into each well and the luminescence (D) was measured again 2 min later. For the background control, 10μl PBS was subjected to the same procedure to get the corresponding data point B’, C’and D’. The ATP/ADP ratio was then calculated as: (B–B’)/([D–D’]–[C–C’]).
Results
Metabolomic analysis of glutamine and glutamate in shrimp hemocytes
and hemolymph during the WSSV replication cycle
hemocytes [5]. Although the levels of glutamine in the hemocytes and plasma were not affected at either the WSSV genome replication stage (12 hpi) or the late stage (24 hpi) of the WSSV replication cycle (Fig 1B), at the WSSV genome replication stage (12 hpi), the level of glutamate was increased in hemocytes and decreased in plasma (Fig 1C). These results suggest that WSSV infection may induce the uptake of glutamate from the hemolymph into the hemocytes, which may in turn help to drive glutamate-driven anaplerosis, as opposed to glutamine-driven anaplerosis (glutaminolysis).
Additional evidence that WSSV infection activates glutamate-driven
anaplerosis at the genome replication stage of the WSSV replication
cycle (12 hpi)
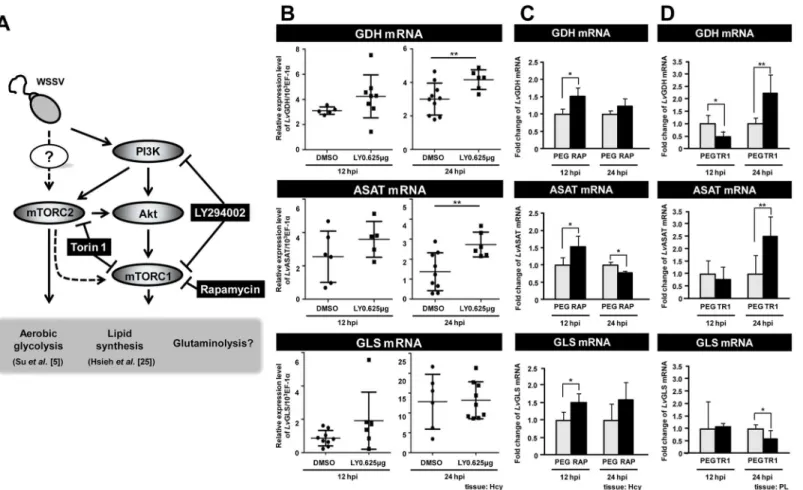
To further elucidate how WSSV infection impacts glutaminolysis, we next investigated WSSV-induced changes in the gene expression of 5 glutaminolysis-related genes in the hemocyte of infected shrimp. For the glutamine transporter SLC7A1 [23], mRNA levels were unaffected by WSSV, while for the glutamate transporter SLC1A2 [24], WSSV induced significant mRNA upregulation only at 24 hpi (Fig 2A). The mRNA levels of the enzyme GDH were significantly increased at both 12 and 24 hpi (Fig 2B), and GDH activity was also increased at 12 hpi (Fig 2C). Although GDH activity was subsequently reduced, the 12 hpi data is consistent with our previous finding that WSSV infection induced increased protein levels of GDH in hemocytes [5].Fig 2Balso shows that ASAT mRNA levels were unchanged and that GLS mRNA levels were significantly increased only at 12 hpi. However, the enzyme activity of ASAT was signifi-cantly enhanced in shrimp hemocytes at the WSSV genome replication stage (Fig 2C), and we further note that ASAT protein levels were also elevated in WSSV-infected shrimp (unpub-lished data). In stomach cells, production of a key intermediate in glutaminolysis,α-KG, was also significantly increased at the WSSV genome replication stage (Fig 2D). (Stomach tissue, which is another main target organ of WSSV and also shows the WSSV-induced Warburg effect, was used instead of hemocytes in this assay because it is difficult to obtain a sufficient quantity of hemocytes for anα-KG determination.)
mTORC2 is a positive regulator of GDH gene expression at 12 hpi
In vertebrates, activation of the PI3K-Akt-mTOR pathway has been shown to trigger the War-burg effect and the metabolic events associated with the WarWar-burg effect [9,17]. During WSSV infection, activation of this pathway has likewise been shown to be important for triggering the Warburg effect at 12 hpi [5] and for lipogenesis at 24 hpi [25] (Fig 3A). However, it remains unknown if the PI3K-Akt-mTOR pathway also acts to regulate glutamate-driven anaplerosis.To examine this possibility, we first treated shrimp with LY294002, which inhibits PI3K and one of the mTOR complexes (mTORC1). As shown inFig 3B, at the WSSV genome replication stage, compared to the group treated with adjuvant only (0.01% DMSO in PBS), LY294002 had no significant effect on the mRNA expression of GDH, ASAT or GLS. However, at 24 hpi, sup-pression of the PI3K- mTORC1 pathway led to up-regulation of GDH and ASAT mRNA, which suggests that this pathway might suppress the expression of these molecules at the late stage of WSSV infection.
To investigate this possibility, we therefore used Torin 1 to suppress both of these mTOR complexes. At 12 hpi, Torin 1 treatment led to a significant decrease of GDH, but had no effect on the levels of ASAT or GLS (Fig 3D). Taken together, these data suggest that, at 12 hpi, the WSSV-induced expression of GDH is predominantly regulated by mTORC2, and not by the PI3K-mTORC1 pathway. Conversely, at 24 hpi, PI3K and mTORC2 seem to act as negative regulators that suppresses the expression of at least two glutaminolysis-related genes (GDH Fig 2. WSSV induces glutamate dehydrogenase (GDH) expression at the WSSV replication stage (12 hpi).(A) The mRNA level of SLC7A1 and SLC1A2 during WSSV infection. Gene expression in hemocyte samples (4 samples for each group at each time point; 4 shrimp in each sample) was analyzed by real-time PCR (qPCR). (B) The mRNA level of GDH, ASAT and GLS during WSSV infection. Gene expression in hemocyte samples (4 samples for each group at each time point; 4 shrimp in each sample) was analyzed by real-time PCR (qPCR). (C) Analysis of lysates from hemocytes collected at 12 and 24 hpi showed that the activities of GDH and ASAT, the key enzymes involved in the conversion of glutamate toα-ketoglutarate (α-KG), were
upregulated at the WSSV genome replication stage (12 hpi). The values are shown as fold change compared to the PBS group. (D) Analysis of lysates from stomachs collected at 12 and 24 hpi showed that the level ofα-KG was increased at 12 hpi. (Stomachs were used for this analysis because lysates from
hemocytes did not contain detectable levels ofα-KG.) Each bar represents the mean±SD. Asterisks indicate statistically significant differences between WSSV infection groups and the corresponding PBS control (Student’s t test,*p<0.05,**p<0.01,***p<0.001).
and ASAT). However, this suppression is evidently not mediated via the PI3K-mTORC1 path-way. Lastly we note that the treatments with LY294002 (Fig 3B) and Rapamycin (Fig 3C) both lead to an increase in GLS expression at 12 hpi. Although the increase was statistically signifi-cant only in the Rapamycin group, taken together, these results suggest that the
PI3K-mTORC1 pathway may be acting to suppress GLS expression at this time. (We note that, pleo-pod samples were used inFig 3Dis because pleopods and hemocytes are all WSSV-target tis-sues and both cell types show a similar WSSV replication cycle [4]. However, we can not exclude the any possibility that some of gene responses in pleopods we observed may be differ with hemocytes. The further investigation may be needed).
Fig 3. WSSV-induced expression of GDH is regulated by mTORC2.(A) Schematic of the PI3K-Akt-mTOR pathway and the three inhibitors used in this experiment (black boxes). All of the results shown in this Figure are from WSSV-infected shrimp, i.e. the controls were not treated with the various inhibitors, but they were infected. (B) Real-time PCR (qPCR) analysis shows that the PI3K/mTORC1 inhibitor LY294002 had no significant effect on WSSV-induced GDH expression at 12 hpi. Gene expression was measured in 10 individual hemocyte samples for each group at each time point. (The number of data points shown may be less than 10 because any sample that failed to produce a sufficiently specific Bio-Rad amplification plot was rejected.) Bars represent the mean±SD. Asterisks indicate statistically significant differences in WSSV-infected shrimp between the drug treatment groups and the corresponding vehicle-only control. The Mann-Whitney U test was used to test the non-normal LY294002 12 hpi GLS group data against the DMSO control. Student’st-test was used for all other comparisons (**p<0.01). (C) Inhibition of mTORC1 by Rapamycin significantly up-regulated the expression of GDH, ASAT and GLS
mRNA at 12 hpi. Gene expression in hemocyte samples (4 samples for each group at each time point; 3 shrimp in each sample) was analyzed by real-time PCR (qPCR). Asterisks indicate statistically significant differences in WSSV-infected shrimp between the drug treatment groups and the corresponding vehicle-only control (Student’s t test,*p<0.05,**p<0.01). (D) Inhibition of mTORC1/C2 by Torin 1 significantly suppressed the expression of GDH, but no effect on ASAT and GLS at 12 hpi. Gene expression in pleopod samples (5–6 samples for each group at each time point; 10 shrimp in each sample) was analyzed by real-time PCR (qPCR). Each bar represents the mean±SD. Asterisks indicate statistically significant differences in WSSV-infected shrimp
between the drug treatment groups and the corresponding vehicle-only control (Student’s t test,*p<0.05,**p<0.01).
GDH and ASAT are both important for WSSV replication
To investigate the importance of GDH and ASAT for WSSV replication, shrimp were treated with the corresponding dsRNAs to silence the expression of these two enzymes. Shrimp were challenged with WSSV 3 days post dsRNA injection and hemocytes and pleopods were col-lected at 24 h post WSSV injection. Relative to the non-specific dsRNA injection group, both GDH and ASAT mRNA were significantly decreased by their corresponding dsRNAs (Fig 4A & 4B).Fig 4C and 4Dfurther show that in the groups of shrimp pretreated with GDH dsRNA and ASAT dsRNA, the WSSV VP28 expression levels and WSSV viral copy numbers were sig-nificantly inhibited compared to the EGFP dsRNA-treated group. Together, these data suggest that both GDH and ASAT are important for WSSV replication.
The effect of GDH silencing in WSSV-infected shrimp can be rescued by
injection of the TCA cycle intermediate
α
-KG
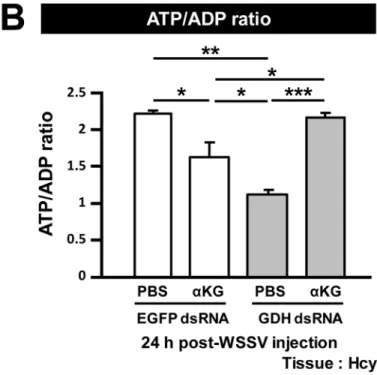
The above results suggest that in WSSV-infected shrimp, glutamate replenishes the TCA cycle via conversion toα-KG through GDH and ASAT. If so, then after GDH silencing, it should be possible to rescue virus replication by directly supplying the infected shrimp with an additional amount of the TCA cycle intermediateα-KG. To assess this possibility, GDH silenced shrimp were treated withα-KG (531μg/g) or PBS only 2 h after WSSV injection. Since any difference in WSSV mRNA and virus copy number would only be apparent at the late stage of the infec-tion cycle (i.e. 24 hpi), samples of hemocytes and pleopods were collected at 24 h post WSSV injection.
Fig 5Ashows that GDH mRNA was significantly reduced in both of the GDH dsRNA treated groups compared to the EGFP dsRNA groups. We note too that in the GDH silenced groups, injection ofα-KG led to a small but significant increase in GDH mRNA levels (Fig 5A). The reason for this is not clear. InFig 5B, if glutamate is converted intoα-KG and enters the TCA cycle, then we could expect GDH silencing to result in a loss of ATP production. As expected, at 24 h post WSSV injection, there was a lower ATP/ADP ratio in the hemocytes collected from the GDH dsRNA group. Further, as predicted, the addition ofα-KG indeed res-cued the ATP/ADP ratio in the GDH-silenced shrimp after WSSV infection (Fig 5B). More-over, WSSV mRNA expression and viral genome copy number in the GDH- silenced shrimp were both significantly increased afterα-KG supplementation (Fig 5C). The ability ofα-KG to rescue the effects produced by GDH silencing suggests that, after WSSV infection, glutamate is indeed converted toα-KG via GDH, and that theα-KG is used to replenish the TCA cycle to benefit WSSV replication.
Discussion
Fig 4. GDH and ASAT are involved in WSSV replication.Three days after injection of the indicated dsRNA, shrimp were challenged with WSSV by injection, and 24h later, 4 hemocyte and pleopod samples (3 shrimp in each sample) were collected from each group. The hemocyte samples were used to measure mRNA expression while the pleopod samples were used to measure the viral copy number.In vivogene silencing of (A) GDH and (B) ASAT by injection of corresponding dsRNA induced a significantly stronger decrease in the respective target mRNA expressions compared to the groups treated with non-specific EGFP dsRNA.In vivogene silencing of GDH and ASAT decreased both (C) WSSV gene VP28 expression and (D) WSSV genome copy numbers at 24 h post WSSV injection. Asterisks indicate statistically significant differences between EGFP dsRNA control, GDH dsRNA and ASAT dsRNA groups (Student’s t test,*p<0.05,**p<0.01,***p<0.001).
Fig 5. Glutamate-driven anaplerosis producesα-KG, which is an essential anaplerotic TCA cycle metabolite during WSSV infection.(A) GDH dsRNA treatment significantly decreased GDH expression. Three days after treatment with EGFP dsRNA and GDH dsRNA, shrimp were challenged with WSSV and then subjected toα-KG replenishment (531μg/g shrimp) 2h post WSSV injection. At 24 h post WSSV injection, 4 hemocyte and pleopod samples
(3 shrimp in each sample) were collected from each group. The hemocyte samples were used to measure mRNA expression and ATP/ADP ratio, while the pleopod samples were used to measure the viral copy number. Asterisks indicate significant differences between each group (Student’s t test,*p<0.05,**
p<0.01,***p<0.001). (B)α-KG replenishment rescued the ATP/ADP ratio in the GDH dsRNA treated groups. Asterisks indicate significant differences
between groups (Student’s t test,*p<0.05,**p<0.01,***p<0.001). (C)α-KG replenishment rescued both WSSV mRNA expression and WSSV genome
copy number in the GDH dsRNA treated groups. Asterisks indicate statistically significant differences between each group (Student’s t test,*p<0.05,**
p<0.01,***p<0.001).
WSSV-induced glutamate-driven anaplerosis is unusual because unlike most cancer cells and virus-infected vertebrate cells, which boost glutaminolysis by increasing their uptake of glutamine [10,13,16,27,28], our data suggests that WSSV prefers to uptake glutamate as the carbon source (Fig 1B and 1C). At present, the lack of a shrimp cell line means that it is not possible to confirm this by amino acid limitation experiments (ie. by using medium that is free of either glutamine or glutamate), but we are currently developing a stable isotope labeling plat-form which will allow us to perplat-formin vivometabolic flux analysis in shrimp during WSSV infection. Meanwhile, we note that glutamate uptake commonly occurs in astrocytes to trigger glutamate signaling in neurometabolic coupling [29], and interestingly, as a consequence of this uptake, glutamate-stimulated aerobic glycolysis is subsequently triggered [30].
Glutamate is normally metabolized intoα-KG via one of two pathways: (1) Direct reaction, in which glutamate is converted directly intoα-KG in a reaction catalyzed by GDH; (2) Indi-rect reaction, in which theαamino group of glutamate is transferred to oxaloacetate to gener-ate aspartgener-ate andα-KG in a reaction catalyzed by ASAT [16]. At the WSSV genome replication stage, our data shows an increase in the mRNA level of GDH (Fig 2B), an increase in the enzyme activities of both GDH and ASAT (Fig 2C), and also that GDH was up-regulated by the mTORC2 signaling pathway (Fig 3C and 3D). In addition, silencing of these two enzymes also led to significant decreases in the WSSV viral copy number (Fig 4). Because the conversion of glutamate by GDH and ASAT respectively produces different downstream metabolites, acti-vation of one or both of these two enzymes will usually depend on the biological requirements of the cell [31,32]. In the case of WSSV-triggered glutamate-driven anaplerosis, although only GDH mRNA was significantly upregulated at 12 hpi (Fig 2B), the importance and relative con-tribution of these two pathways still needs to be determined.
In cancer cells and virus-infected vertebrate cells, when anaplerosis of the TCA cycle is inhibited, cell growth and replication of the virus, respectively, are suppressed [15,16,27,28,
33,34]. Viral replication was also suppressed when the WSSV-induced anaplerosis was blocked by dsRNA silencing of GDH and ASAT: silencing led to significant decreases in WSSV mRNA expression and the number of WSSV genome copies (Fig 4), suggesting that the anaplerosis is crucial for WSSV replication. Anaplerosis allows the TCA cycle to continue to provide not only energy but also the intermediates for biosynthetic precursors, such as nucleic acids, amino acids and lipids [13,18,35]. It is known for instance that glutamine-derivedα-KG is mainly used for lipogenesis during cell proliferation [18,19]. However, although we have shown here that the ATP/ADP ratio was rescued in GDH-silenced shrimp by direct injection of the TCA cycle intermediateα-KG (Fig 5B), we have not yet been able to confirm that this anaplerosis is also important for the biosynthetic pathways that are necessary for WSSV to complete its repli-cation cycle. Even so, we speculate that WSSV-induced glutamate-driven anaplerosis at the WSSV genome replication stage may generate the materials that are subsequently needed for lipogenesis at the late stage of WSSV replication (24 hpi; [25]). In particular, it will be interest-ing to investigate the role that WSSV-triggered glutamate-driven anaplerosis plays in the syn-thesis of the lipids that are used for the envelope fraction of the WSSV virion particles.
in some cases, glutaminolysis can be triggered independently of the PI3K-Akt-mTORC1 path-way [12,39].
As noted above, when mTORC1 is suppressed, this can lead to the activation of mTORC2. mTORC2 can either compensate directly for the suppression of mTORC1 [26], or it can trigger other downstream responses independently of the PI3K-Akt-mTORC1 pathway [40], and these independent responses are now increasingly being recognized as important in cancer metabolic reprogramming [41]. Bearing these possibilities in mind, based on the Rapamycin and Torin 1 results for GDH (Fig 3C and 3D), while the exact role of mTORC1 is unclear–it may inhibit GDH expression, or it may not be involved at all–we infer that mTORC2 is in fact acting independently and that it somehow activates glutamate-driven anaplerosis at least at the
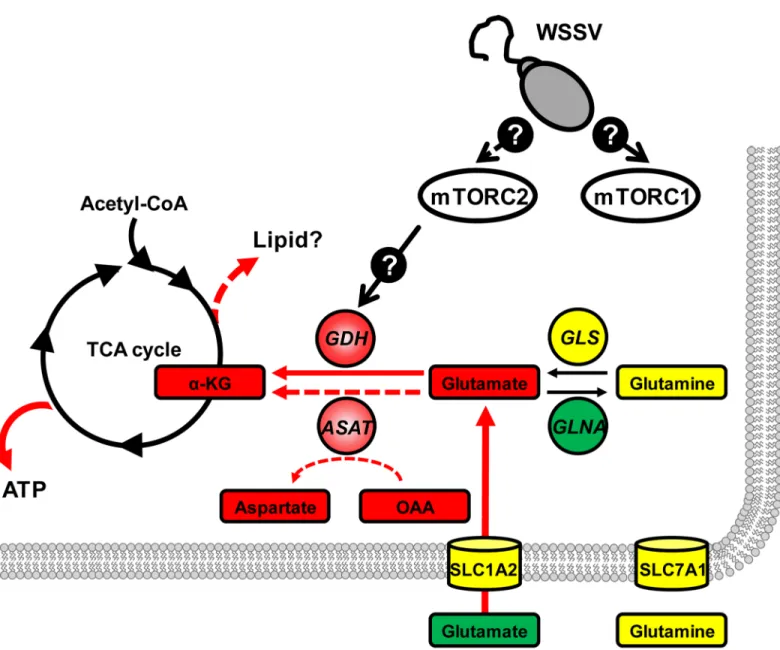
Fig 6. Proposed model of how WSSV-induced glutamate-driven anaplerosis is regulated by the mTORC2 at 12 hpi.Gene expression and/or protein levels of enzymes (circle) and the mRNA levels of transporters (cylinders) were either increased (red), decreased (green) or remained unchanged (yellow). Expression and protein data are compiled from the present study and from Suet al. [5]. The same color code is used for metabolites, which are shown in boxes. Except forα-KG, all metabolite data is from Suet al[5]. Details of the mTORC2 regulatory pathways are currently unknown. In addition to increasing energy levels (ATP), we speculate that replenishment ofα-KG may also drive the production of lipid precursors (dashed red arrow).
transcriptional level. Thus in addition to our previous findings that mTORC2 was involved in the WSSV-induced Warburg effect and essential for successful WSSV genome replication [5], our present results now suggest that mTORC2 signaling is essential for WSSV-induced gluta-mate-driven anaplerosis. We further propose that mTORC2’s importance in WSSV replication is probably mediated by its regulation of this part of the glutaminolysis pathway. (Unfortu-nately, our attempts to confirm the respective roles that mTORC1 and mTORC2 play in WSSV replicationin vivohave so far been unsuccessful because treatment with the appropriate dsRNAs have failed to silence the expression of raptor and rictor, which are key subunits of mTORC1 and mTORC2, respectively.)
Our proposed model of how WSSV triggers glutamate-driven anaplerosis at 12 hpi is shown inFig 6. In this model, mTORC2 is activated after WSSV infection, and at the WSSV genome replication stage, mTORC2 signaling acts via unknown regulators to trigger the expression of GDH. At the same time, the excess of glutamate“pulled”from the hemolymph also serves to drive the conversion of glutamate toα-KG. This in turn provides anaplerotic replenishment of the TCA cycle, which ultimately supports virus replication.
Supporting Information
S1 Fig. GDH dsRNA has a specific, statistically significant silencing effect on GDH protein levels in WSSV-infected shrimp.(A)Western blotting results at 24 hpi for 3–4 samples of gill tissue taken from WSSV-infected shrimp that were treated with the indicated dsRNA (or PBS vehicle only control) 3 days prior to challenge. A commercial GDH antibody (Proteintech) was used as the probe. Signal strength was quantified using ImageJ software, normalized relative to β-actin, and then expressed relative to the positive control, which was set to 1. (B) Aggregated data and statistical analysis of the results shown in (A).
(DOCX)
Acknowledgments
Metabolomic analysis was performed by the Technology Commons (TechComm) in the Col-lege of Life Science and Center for Systems Biology, National Taiwan University. We are indebted to Paul Barlow, National Cheng Kung University, for his helpful criticism.
Author Contributions
Conceived and designed the experiments: HCW. Performed the experiments: CYL YJW SWH CSC. Analyzed the data: CYL HCW. Contributed reagents/materials/analysis tools: SWH. Wrote the paper: CYL HCW.
References
1. Lo CF, Ho CH, Peng SE, Chen CH, Hsu HC, Chiu YL, et al. White spot syndrome baculovirus (WSBV) detected in cultured and captured shrimp, crabs and other arthropods. Dis Aquat Org. 1996; 27:215–
25.
2. Lightner DV. Virus diseases of farmed shrimp in the Western Hemisphere (the Americas):a review. J Invertebr Pathol. 2011; 106:110−130. doi:10.1016/j.jip.2010.09.012PMID:21215359
3. Wang CH, Lo CF, Leu JH, Chou CM, Yeh PY, Chou HY, et al. Purification and genomic analysis of baculovirus associated with white spot syndrome (WSBV) of Penaeus monodon. Dis Aquat Org. 1995; 23:239–242.
5. Su MA, Huang YT, Chen IT, Lee DY, Hsieh YC, Li CY, et al. An Invertebrate Warburg Effect: A Shrimp Virus Achieves Successful Replication by Altering the Host Metabolome via the PI3K-Akt-mTOR Path-way. PLoS Pathog. 2014; 10:e1004196. PMID:24945378. doi:10.1371/journal.ppat.1004196 6. Warburg O. On the origin of cancer cells. Science. 1956; 123:309–14. PMID:13298683.
7. Munger J, Bajad SU, Coller HA, Shenk T, Rabinowitz JD. Dynamics of the Cellular Metabolome during Human Cytomegalovirus Infection. PLoS Pathog. 2006; 2:e132. PMID:17173481.
8. Zwerschke W, Mazurek S, Massimi P, Banks L, Eigenbrodt E, Jansen-Dürr P. Modulation of type M2 pyruvate kinase activity by the human papillomavirus type 16 E7 oncoprotein. Proc. Natl. Acad. Sci. U. S.A. 1999; 96:1291–96. PMID:9990017.
9. Jones RG, Thompson CB. Tumor suppressors and cell metabolism: a recipe for cancer growth. Genes Dev. 2009; 235:537–48. PMID:19270154.
10. Wise DR, Thompson CB. Glutamine addiction: a new therapeutic target in cancer. Trends Biochem Sci. 2010; 35:427–33. PMID:20570523. doi:10.1016/j.tibs.2010.05.003
11. Wang HC, Kondo H, Hirono I, Aoki T. The Marsupenaeus japonicas voltage- dependent anion channel (MjVDAC) protein is involved in white spot syndrome virus (WSSV) pathogenesis. Fish Shellfish Immu-nol. 2010; 29:94–103. PMID:20202479. doi:10.1016/j.fsi.2010.02.020
12. Wise DR, DeBerardinis RJ, Mancuso A, Sayed N, Zhang XY, Pfeiffer HK, et al. Myc regulates a tran-scriptional program that stimulates mitochondrial glutaminolysis and leads to glutamine addiction. Natl. Acad. Sci. U.S.A. 2008; 105:18782–87. PMID:19033189.
13. Yu Y, Clippinger AJ, Alwine JC. Viral effects on metabolism: changes in glucose and glutamine utiliza-tion during human cytomegalovirus infecutiliza-tion. Trends Microbiol. 2011; 19:360–67. PMID:21570293. doi:10.1016/j.tim.2011.04.002
14. Cairns RA, Harris IS, Mak TW. Regulation of cancer cell metabolism. Nat Rev Cancer. 2011; 11:85–
95. PMID:21258394. doi:10.1038/nrc2981
15. Chambers JW, Maguire TG, Alwine JC. Glutamine Metabolism Is Essential for Human Cytomegalovi-rus Infection. J Virol. 2010; 84:1867–73. PMID:19939921. doi:10.1128/JVI.02123-09
16. Son J, Lyssiotis CA, Ying H, Wang X, Hua S, Ligorio M, et al. Glutamine supports pancreatic cancer growth through a KRAS-regulated metabolic pathway. Nature. 2013; 496:101–5. PMID:23535601. doi:10.1038/nature12040
17. Csibi A, Fendt SM, Li C, Poulogiannis G, Choo AY, Chapski DJ, et al. The mTORC1 Pathway Stimu-lates Glutamine Metabolism and Cell Proliferation by Repressing SIRT4. Cell. 2013; 153:840–54. PMID:23663782. doi:10.1016/j.cell.2013.04.023
18. DeBerardinis RJ, Mancuso A, Daikhin E, Nissim I, Yudkoff M, Wehrli S, et al. Beyond aerobic glycoly-sis: Transformed cells can engage in glutamine metabolism that exceeds the requirement for protein and nucleotide synthesis. Natl. Acad. Sci. U.S.A. 2007; 104:19345–50. PMID:18032601.
19. Metallo CM, Gameiro PA, Bell EL, Mattaini KR, Yang J, Hiller K, et al. Reductive glutamine metabolism by IDH1 mediates lipogenesis under hypoxia. Nature. 2011; 481:380–84. PMID:22101433. doi:10. 1038/nature10602
20. Durán RV, Oppliger W, Robitaille AM, Heiserich L, Skendaj R, Gottlieb E, et al. Glutaminolysis activates Rag-mTORC1 signaling. Mol Cell. 2012; 47:349–58. PMID:22749528. doi:10.1016/j.molcel.2012.05. 043
21. Robey RB, Hay N. Is Akt the“Warburg kinase”?-Akt-energy metabolism interactions and oncogenesis. Semin Cancer Biol. 2009; 19:25–31.doi:10.1016/j.semcancer.2008.11.010
22. Dhar AK, Bowers RM, Licon KS, Veazey G, Read B. Validation of reference genes for quantitative mea-surement of immune gene expression in shrimp. Mol Immunol. 2009; 46:1688–1695. PMID:
19297025. doi:10.1016/j.molimm.2009.02.020
23. Dang CV. Rethinking the Warburg effect with Myc micromanaging glutamine metabolism. Cancer Res. 2010; 70:859–62. PMID:20086171. doi:10.1158/0008-5472.CAN-09-3556
24. Pavlides S, Tsirigos A, Vera I, Flomenberg N, Frank PG, Casimiro MC, et al. Transcriptional evidence for the "Reverse Warburg Effect" in human breast cancer tumor stroma and metastasis: Similarities with oxidative stress, inflammation, Alzheimer's disease, and "Neuron-Glia Metabolic Coupling". Aging (Albany NY). 2010; 2:185–99. PMID:20442453.
25. Hsieh YC, Chen YM, Li CY, Chang YH, Liang SY, Lin SY, et al. To complete its replication cycle, a shrimp virus changes the population of long chain fatty acids during infection via the PI3K-Akt-mTOR-HIF1αpathway. Dev Comp Immunol. 2015; In press.
27. Fontaine KA, Camarda R, Lagunoff M. Vaccinia Virus requires glutamine but not glucose for efficient replication. J Virol. 2014; 88:4366–74. PMID:24501408. doi:10.1128/JVI.03134-13
28. Sanchez EL, Lagunoff M. Viral activation of cellular metabolism. Virology. 2015; pii: S0042-6822(15) 00084-7. PMID:25812764.
29. Magistretti PJ. Role of glutamate in neuron-glia metabolic coupling. Am J Clin Nutr. 2009; 90:875S–
880S. PMID:19571222. doi:10.3945/ajcn.2009.27462CC
30. Pellerin L, Magistretti PJ. Glutamate uptake into astrocytes stimulates aerobic glycolysis: a mechanism coupling neuronal activity to glucose utilization. Natl. Acad. Sci. U.S.A. 1994; 91:10625–29. PMID:
7938003.
31. Smith TJ, Stanley CA. Untangling the glutamate dehydrogenase allosteric nightmare. Trends Biochem Sci. 2008; 33:557–64. PMID:18819805. doi:10.1016/j.tibs.2008.07.007
32. Kimmich GA, Roussie JA, Randles J. Aspartate aminotransferase isotope exchange reactions:implica-tions for glutamate/glutamine shuttle hypothesis. Am J Physiol Cell Physiol. 2002; 282:C1404–13. PMID:11997255.
33. Vander Heiden MG, Cantley LC, Thompson CB. Understanding the Warburg effect: the metabolic requirements of cell proliferation. Science. 2009; 324:1029–33. PMID:19460998. doi:10.1126/ science.1160809
34. Shanware NP, Mullen AR, DeBerardinis RJ, Abraham RT. Glutamine: pleiotropic roles in tumor growth and stress resistance. J Mol Med (Berl). 2011; 89:229–36. PMID:21301794.
35. Dang CV. Glutaminolysis: supplying carbon or nitrogen or both for cancer cells? Cell Cycle. 2010; 9:3884–86. PMID:20948290.
36. Bhatt AP, Jacobs SR, Freemerman AJ, Makowski L, Rathmell JC, Dittmer DP, et al. Dysregulation of fatty acid synthesis and glycolysis in non-Hodgkin lymphoma. Natl. Acad. Sci. U.S.A. 2012; 109:11818–23. PMID:22752304.
37. Noch E, Khalili K. Oncogenic viruses and tumor glucose metabolism: like kids in a candy store. Mol Cancer Ther. 2012; 11:14–23. PMID:22234809. doi:10.1158/1535-7163.MCT-11-0517
38. Courtnay R, Ngo DC, Malik N, Ververis K, Tortorella SM, Karagiannis TC. Cancer metabolism and the Warburg effect: the role of HIF-1 and PI3K. Mol Biol Rep. 2015; 42:841–51. PMID:25689954. doi:10. 1007/s11033-015-3858-x
39. Yang C, Sudderth J, Dang T, Bachoo RM, McDonald JG, DeBerardinis RJ. Glioblastoma cells require glutamate dehydrogenase to survive impairments of glucose metabolism or Akt signaling. Cancer Res. 2009; 69:7986–93. PMID:19826036. doi:10.1158/0008-5472.CAN-09-2266
40. Read RD, Cavenee WK, Furnari FB, Thomas JB. A drosophila model for EGFR-Ras and PI3K-depen-dent human glioma. PLoS Genet. 2009; 5:e1000374. PMID:19214224. doi:10.1371/journal.pgen. 1000374