*Corresponding author:Tel: +98-481-2266070, Fax: +98-481-2245725, Email: [email protected]
Assessments of applicability of Q and RMi systems in
binary tunnels of Bakhtiari dam_ Iran
Nejadshahmohamad
1*Hossaini
21
Higher education center of Shahid Bakeri Miandoab, University of Urmia, Iran
2
School of Mining Engineering, University College of Engineering, University of Tehran,
Iran
Received 24 August 2012; Received in revised form 3 December 2012; accepted 1 February 2013
Abstract
The main rock mass classification systems make use of similar rock mass parameters. Due to lack of comprehensive estimation systems, determining the real specifications of jointed rocks faces some difficulties. A vast number of parameters with various degrees of impact are involved in such definitions. Combination impact of all the effective parameters is to be figured out in order to come up with an acceptable value. Different classification systems have some well-known drawbacks and limitations mainly due to their empirical base. However, they are still very useful in practice. Therefore, there is a need to improve their efficiency. Two of these classification systems are the RMi and the Q-system. Bakhtiari dam site is located in the southwest of Iran. The project area consists of the sedimentary bedrocks of Sarvak and Garau formations. The Sarvak Formation is divided into 7 units from Sv1 (oldest) to Sv7 (youngest). Deviation system of Bakhtiari dam includes two tunnels, namely upper and lower tunnels. In this paper, the result of geological scanning of rock masses in seven geological zones hosting binary tunnels of Bakhtiari dam have been utilized. This information along with data produced from many different laboratory tests have been used to estimate the values of Q and RMi for each of the geological zones. The pros and cons of both systems are revealed and relationships are driven between the two systems through statistical analysis. The paper also shows that there are good correlations between the two systems. Finally, the support details suggested by each system are determined.
Keywords:
rock mass classification, Q system, RMi system, support system.1. Introduction
The importance of rock engineering classification systems is steadily on the rise in rock engineering and design. Rock mass characterization is normally carried out through the application of empirical classification systems which use a set of geotechnical data and provide an overall description of the rock properties. Moreover, they allow obtaining other important information like support needs, stand-up time, geotechnical parameters among others [1].
Based on a large database of tunnel projects, Barton et al. (1974) of worked out the Q system for estimating rock support in tunnels the Norwegian Geotechnical Institute (NGI). The rock mass index, RMi, was first presented by Palmström in 1995 and has been further developed and presented in several studies [2].
It is a volumetric parameter indicating the approximate uniaxial compressive strength of a rock mass, and it can thus be compared with the GSI value [3]. The RMi value is applied as input for estimating rock support and input also to other rock engineering methods [4]. Numerous researchers have established empirical models to estimate mechanical properties from RQD [5,6], RMR [7–10], or Q [11,12]. Although it is more sensible to estimate mechanical properties from RMR and Q due to the fact that RQD is only one of the components that affect mechanical properties of rock masses, RQD is still widely employed because, in many cases, RQD rather than RMR or Q is available [6].
This paper outlines a method to combine the input parameters used in two of the systems into one set. Therefore, the ground quality values in the two systems can be independently.
Computer spreadsheet is very useful in the process of calculating the values. However, the rating values of each of the input parameters must be closely evaluated from the site geological conditions.
2. Project description
Deviation system of Bakhtiyari dam includes two tunnels: upper and lower tunnels. The lower tunnel is with circular cross section with 13.7m in diameter and 1181m of length. The upper tunnel is 1151m of long with D shape cross section of 13.2m width and 13.7m height. These tunnels are approximated with a diagonal pattern that is excavated with heading and benching method.
Bakhtiari dam site is in the southwest of Iran, almost 70 km northeast of Andimeshk (Khuzestan Province) and almost 65km southwest of Dorud (Lorestan Province). The dam axis lays at 290725 E and 3648729 N points [13].
These tunnels consist of a series of asymmetric folding and faults. The project area is covered by sedimentary bedrocks of the Sarvak and Garau formations. The Sarvak Formation is divided in to 7 units: SV1 (oldest) to SV7 (youngest). At project site the Garau Formation is younger than the Sarvak Formation and is divided into two units [14]. Figure 1 shows longitudinal geological section of right diversion tunnel.
3. Methodology
The purpose of this study was to obtain quantitative and qualitative geotechnical information. Nine boreholes were drilled with 5 boreholes at the upstream and downstream cofferdams and four boreholes were drilled along the diversion tunnel paths. The total drilling length is 811.08m with 7.30m in overburden material and 811.78m in the bedrock. Table 1 provides the characteristics of each borehole [14].
Figure 1. Longitudinal geological section of diversion tunnels [14]
Table 1. Summary of specifications of boreholes in diversion system [6]
No. Location Borehole Number Coordinates Depth (m)
X Y Z Soil Rock Total
1
C
o
ff
er
d
am
s B210 290888.55 3648937.69 659.41 3.00 133.10 136.10
2 B211 290895.06 3648860.00 535.00 0.00 55.00 55.00
3 B409 290935.84 3649020.24 573.89 0.00 50.00 50.00
4 B435 290984.18 3648909.87 543.40 0.00 60.00 60.00
5 B436 290694.63 3647768.63 538.78 3.00 37.00 40.00
6
Div
er
sio
n
-tu
n
n
el
B301 290981.78 3648542.28 874.22 0.00 100.00 100.00
7 B302 290827.85 3648116.82 856.61 0.00 308.00 308.00
8 B414 290801.79 3647805.39 598.48 1.30 73.70 75.00
9 B413 290974.06 3648825.80 606.07 0.00 80.00 80.00
3.1. Evaluation of the rock mass quality in the Boreholes
The first information taken from the freshly recovered drill cores is the rock mass quality by means of the RQD parameter. It is defined as the ratio of the total length of intact, sound core pieces longer than 10cm to the length of the core run.
Thus, the RQD is a direct measurement of the degree of the bedrocks fracturing and, as a result, also an indirect account of the grade of weathering. Technical fractures, produced during drilling and recovery of the cores from the core barrel, therefore, have to be disregarded.
The RQD value is significantly dependent on the relationship between orientation of the discontinuities and the borehole axis. In the
project area, tectonic structures such as faults, the kink bands, the joint sets, and in some cases the litho logical bedding planes have a remarkable effect on the RQD value.
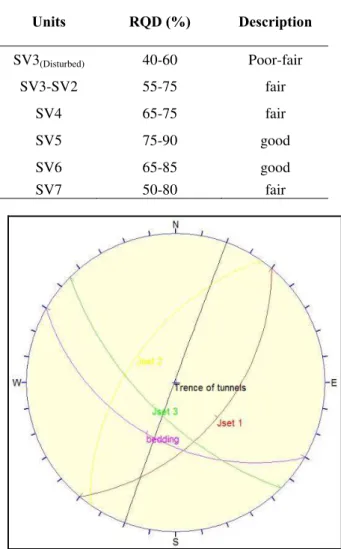
Generally with study the all boreholes, RQD values in the seven zones have been calculated, the results of which are presented in the Table 2.
3.2. Discontinuitiessystem
Rock mass in the Bakhtiary diversion system, including four sets of discontinuity, the characterization of these discontinuities have been considered in the galleries and boreholes that located in the dam site. Stereo plot of discontinuities, along with the Diversion Tunnel, is shown in the Figure 2. Also, Table 3 provides the Discontinuity Characteristics.
Table 2.RQD values in diversion system
Units RQD (%) Description
SV3(Disturbed) 40-60 Poor-fair
SV3-SV2 55-75 fair
SV4 65-75 fair
SV5 75-90 good
SV6 65-85 good
SV7 50-80 fair
Table 3.Discontinuity characteristics, along the diversion tunnels [13] Bedding Joint-Set J1 Joint-Set J2 Joint-Set J3 Parameter 030 310 135 045 Dipdirection (deg) 43 40 35 20 Dip(deg) 8% 17% 50% 21% Sm R o u g h n
ess R 14% 35% 39% 14%
-4% 10% 6% R-Sm 44% 5% 4% 1% Sl -35% 1% 58% no data 11% 15% 41% 48% Clean Fil lin g 43% 4% 3% 0% Calcite-Clay 17% 56% 32% 8% Calcite 19% 4% 3% 0% Clay 2% 1% 1% 0% diverse 8% 20% 20% 44% no data 40% 25% 73% 80% ≤1 Ap er tu re 37% 26% 14% 12% 1-5 5% 2% 1% 1% 5-10 3% 1% 1% 0% 10-50 0% 2% 0% 0% >50 15% 44% 11% 7% no data
3.3. Laboratory tests
Many samples of rock were taken from the cores of the exploratory and rock mechanics test boreholes drilled at Bakhtiary Dam site. In order to provide a good coverage over all the project structures and also to compare the geotechnical characteristics of rock materials of the 7 units of Sarvak Formation, it was decided to take samples from all these units and perform similar
index and perform tests on them. The 140 laboratory tests were performed to estimate the Unconfined Compressive Strength of rock. Results of these tests are presented in Table 4. Due to very low water absorption, there is no significant difference between the parameters in dry and saturated conditions [14]. The results of the tests suggest that rock mass in this area is in good conditions.
Table 4. Results of measuring UCS in the diversion system
Units Number of test AverageUCS [MPa]St Dev
SV3
(Disturbed) 5 85 12
SV2 32 105 28
SV3 42 105 30
SV4 12 69 13
SV5 14 62 21
SV6 18 88 38
3.4. Preferential use of RMi and Q-system in the diversion system
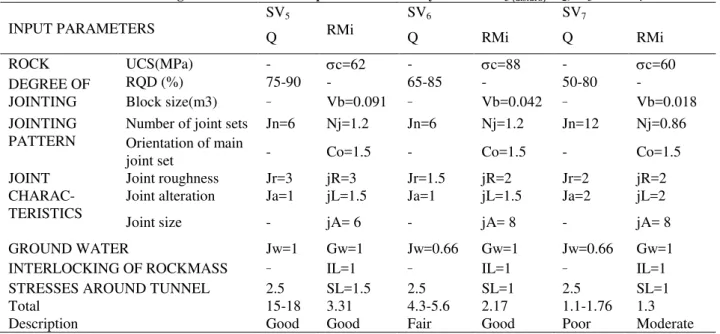
From the main classification systems for rock support estimation, Q and RMi systems use the most important ground features or parameters influencing stability. Each of these parameters is classified and each class given a value or rating to express its influence on tunnel stability. Tables 5 and 6 show values of the various rock mass parameters in two systems for water deviation binary tunnels of Bakhtiari Dam.
Although the rating methods of RMi and Q-system are additive and multiplicative, respectively, the basic concepts of both schemes are similar. Both schemes allocate the ratings to the properties that influence the rock mass behavior and then quantitative figures such as total-RMi and Q-value are produced [15].
These values are used to judge the quality of rock mass for construction. As shown in Tables 5 and 6, in both systems the lowest quality belongs to the zone SV7 and the highest quality is related to the zone SV5.
It can be observed from Table 5 that the most marked difference between the two systems in ranking the rock units occurs for SV2 and SV3 which possess the highest value of c. whereas Q system ranks this unit as being poor, RMi describes the same unit as being good. This can imply that in the rock with high c, RMi must be used with care. As Tables 5 and 6 indicate the result of applying both systems submit more or less close classes for other rock units. This confirms that for the rocks having not high values of c the ranking released by both systems are close together.
Table 5. Ratingsand values of various parameters in two systems for sv3 (disturb)sv2, sv3 and sv4
INPUT PARAMETERS
SV5 SV6 SV7
Q RMi Q RMi Q RMi
ROCK UCS(MPa) - c=62 - c=88 - c=60
DEGREE OF JOINTING
RQD (%) 75-90 - 65-85 - 50-80
-Block size(m3) - Vb=0.091 - Vb=0.042 - Vb=0.018
JOINTING PATTERN
Number of joint sets Jn=6 Nj=1.2 Jn=6 Nj=1.2 Jn=12 Nj=0.86 Orientation of main
joint set - Co=1.5 - Co=1.5 - Co=1.5
JOINT CHARAC-TERISTICS
Joint roughness Jr=3 jR=3 Jr=1.5 jR=2 Jr=2 jR=2 Joint alteration Ja=1 jL=1.5 Ja=1 jL=1.5 Ja=2 jL=2
Joint size - jA= 6 - jA= 8 - jA= 8
GROUND WATER Jw=1 Gw=1 Jw=0.66 Gw=1 Jw=0.66 Gw=1
INTERLOCKING OF ROCKMASS - IL=1 - IL=1 - IL=1
STRESSES AROUND TUNNEL 2.5 SL=1.5 2.5 SL=1 2.5 SL=1
Total 15-18 3.31 4.3-5.6 2.17 1.1-1.76 1.3
Description Good Good Fair Good Poor Moderate
Table 6. Ratings and values of various parameters in two systems for SV5, SV6 and SV7
INPUT PARAMETERS
SV3(disturbed) SV2 & SV3 SV4
Q RMi Q RMi Q RMi
ROCK UCS(MPa) - c=85 - c=105 - c=69
DEGREE OF JOINTING
RQD (%) 40-60 - 55-75 - 65-75 -
Block size(m3) - Vb=0.01 - Vb=0.025 Vb=0.032
JOINTING PATTERN
Number of joint sets Jn=12 Nj=0.86 Jn=9 Nj=1 Jn=6 Nj=1.2 Orientation of main
joint sets - Co=1.5 - Co=1.5 - Co=1.5
JOINT CHARAC-TERISTICS
Joint roughness Jr=2 jR=2 Jr=3 jR=3 Jr=3 jR=3
Joint alteration Ja=2 jL=2 Ja=2 jL=1.5 Ja=2 jL=1
Joint size - jA= 6 - jA= 8 - jA= 8
GROUND WATER Jw=1 Gw=1 Jw=0.66 Gw=1 Jw=0.66 Gw=1
INTERLOCKING OF ROCKMASS - IL=1 - IL=1 - IL=1
STRESSES AROUND TUNNEL 2.5 SL=1 2.5 SL=1 2.5 SL=1.5
Total 1.3-2 1.91 2.4-3.3 3.1 4.3-4.96 1.53
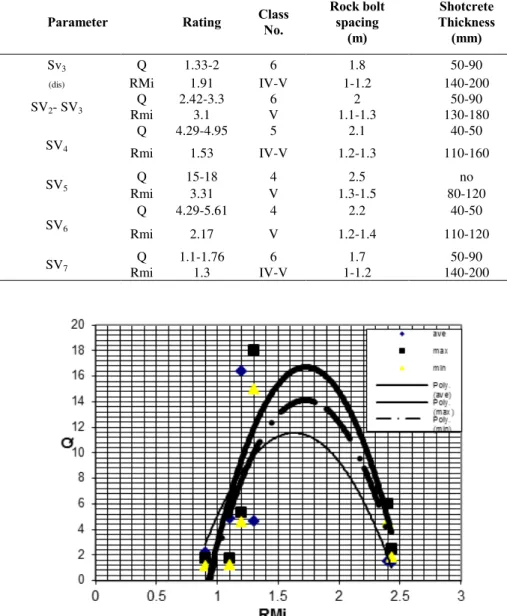
3.5. Support system for diversion tunnels
Through the use of the ratings summarized in Tables 5 and 6, the support systems are suggested by RMi and Q system for the tunnels. As provided in Table 7, the results indicate that SV7 and SV3 (disturbed) needed maximum volume and sv5 needed minimum volume of support and reinforcement.
As far as the suggested supports by the two systems are concerned, as presented in Table 7, RMi suggests more serious options which lead to safety factor of twice as much as Q. It can imply that RMi is more reliable in places where subsidence is of more concern. Heavier shotcrete suggested by RMi indicates that this system is more sensitive to small movements of interior walls of underground spaces.
3.6. Comparison between the two
classification systems
The computer spreadsheet used to estimate the values in all the two systems, was based on the combined input parameters in section 7. By using this spreadsheet, it is easy to calculate the corresponding ground qualities in the two classification systems from the set of common input values or ratings. Thus, comparisons can be made between the systems, provided that the inputs of ground conditions are within the limits of all the two systems.
As far as the relationship between RMi and Q is concerned, there are few points to be considered. This relationship is depicted in Figure 3 and described in Table 8.
Table 7. Summary of support systems resulted from RMi and Q systems
Shotcrete Thickness
(mm) Rock bolt
spacing (m) Class
No. Rating
Parameter
50-90 1.8
6 1.33-2
Q Sv3
(dis) RMi 1.91 IV-V 1-1.2 140-200
50-90 2
6 2.42-3.3
Q SV2- SV3
130-180 1.1-1.3
V 3.1
Rmi
40-50 2.1
5 4.29-4.95 Q
SV4 Rmi 1.53 IV-V 1.2-1.3 110-160
no 2.5
4 15-18
Q SV5
80-120 1.3-1.5
V 3.31
Rmi
40-50 2.2
4 4.29-5.61 Q
SV6
110-120 1.2-1.4
V 2.17
Rmi
50-90 1.7
6 1.1-1.76
Q SV7
140-200 1-1.2
IV-V 1.3
Rmi
Exponential regression leads to highest value of R2. It was figured out that the lowest R2 is obtained for average values of Q and RMi where R2=0.69 and Equation 1 describes this correlation.
Qave = -16.4RMi2 + 53.4RMi – 32 (1)
The minimum values of Q and RMi carry out the best correlation with R2=0.77 and is represented by Equation 2.
Qmin = -22.8RMi2 + 78.6RMi – 53.7 (2)
The result of this investigation can be employed in places where the condition of rock resembles the rock mass dialed with in this work. Also, the equations can be used in order to estimate the required support for the underground spaces.
4. Conclusion
The following conclusions could bedrawn from the current study:
RMi classification system ranks the various units of rock mass of Bakhtiari dam tunnel as medium to good where Q system ranks it as poor to good.
Both classifications suggest “good” class for
SV5 unit.
In both systems, the lowest quality belongs to the zone sv7 and the highest quality is related to the zone SV5.
The most discrepancy of the two systems in ranking the rock units occurs for SV2 and SV3 which possess the highest value of c. Q system ranks this unit as poor, whereas RMi describes the same unit as being good.
In rocks with high c, RMi must be used with care.
For rocks with no high values of c, the ranking released by both systems are close together
RMi system normally suggests heavier support than what is recommended by Q for which the safety factor is twice as much.
In both system units, SV7 and SV3 (disturbed) needed maximum volume and SV5 needed minimum volume of support and reinforcement.
The average values of Q and RMi are interrelated by an equation with coefficient of determination of 0.69.
The minimum values of Q and RMi are interrelated by an equation with best coefficient of determination of 0.77.
References
[1] Sing.B, Goel R.k, (1999). Rock Mass
Classification, University of Roorke india,
published by Elsevier.
[2] Palmstrom.A, (1995). Rmi–A Rock Mass Classification System For Rock Engineering
Purposes, Phd Thesis, University Of Oslo,
Chapter 5.
[3] Rajnish.K, Bhawani.S.G, (2006). Tunneling
in Weak Rocks, ELSEVIER
GEO-ENGINEERING BOOK SERIES.
[4] Palmstrom A. and Broch E. (2006). Use and misuse of rock mass classification systems
with particular reference to the Q-system.
Tunnels and Underground Space Technology, Vol. 21, pp. 575-593.
[5] Coon.R.F, Merritt.A.H, (1970). Predicting in situ modulus of deformation using rock
quality indices. In: Determination of the in
situ modulus of deformation of rock, ASTM
STP477. Philadelphia, ASTM, p.154–73. [6] Zhang.L, Einstein.H, (2004). Using RQD to
estimate the deformation modulus of rock masses. Int J Rock Mech Min Sci, 41(2), 337–41.
[7] Bieniawski.Z.T,(1978), Determining rock mass deformability experience from case histories. Int J Rock Mech Min Sci Geomech Abstr, 15,237–48.
[8] Nicholson.G.A, Bieniawski.Z.T, (1990), a nonlinear deformation modulus based on rock mass classification. Int J Min Geol Eng, 181–202.
[9] Hoek.E, Brown.E.T, (1997). Practical estimates of rock mass strength. Int J Rock Mech Min Sci, 34(8), 1165–86.
[10] Chun.B.S, Ryu.W.R, Sagong.M, Do.J.N, (2009). Indirect estimation of the rock deformation modulus based on polynomialand multiple regression analyses of the RMR system. Int J Rock Mech Min Sci, 46,649–58.
[11] Barton.N, (1983). Application of Q-system, index tests to estimate shear strength and deformability of rock masses. In, Proceedings of international symposium on engineering geology underground construction, vol.1 (II).Lisbon. p. 51–70. [12] Barton.N, (2002). Some new Q value
correlations to assist in situ characterization and tunnel design. Int J Rock Mech Min Sci; 39:185–216.
[14]Iran Water and Power resourced Development Co, (2007). Final Report of Rock Mechanics of Bakhtiyari Dam.
![Table 1. Summary of specifications of boreholes in diversion system [6]](https://thumb-eu.123doks.com/thumbv2/123dok_br/17150863.240114/2.892.111.788.874.1139/table-summary-specifications-boreholes-diversion.webp)
![Table 4. Results of measuring UCS in the diversion system Units Number of test UCS [MPa]](https://thumb-eu.123doks.com/thumbv2/123dok_br/17150863.240114/4.892.257.638.822.1031/table-results-measuring-ucs-diversion-units-number-test.webp)