Quality, Quantity, and Cost of Physicians’ Prescribing: A
Systematic Review
Geoffrey K. Spurling
1*, Peter R. Mansfield
2,3, Brett D. Montgomery
4, Joel Lexchin
5, Jenny Doust
6,
Noordin Othman
7, Agnes I. Vitry
81University of Queensland, Brisbane, Queensland, Australia,2Healthy Skepticism, Willunga, South Australia,3University of Adelaide, Adelaide, South Australia, Australia, 4School of Primary, Aboriginal and Rural Health Care, University of Western Australia, Perth, Western Australia, Australia,5School of Health Policy and Management, York University, Toronto, Ontario, Canada,6Faculty of Health Sciences and Medicine, Bond University, Gold Coast, Queensland, Australia,7Kulliyyah of Pharmacy, International Islamic University Malaysia, Kuantan, Pahang, Malaysia,8Quality Use of Medicines and Pharmacy Research Centre, Sansom Institute, School of Pharmacy and Medical Sciences, University of South Australia, Adelaide, South Australia, Australia
Abstract
Background:
Pharmaceutical companies spent
$
57.5 billion on pharmaceutical promotion in the United States in 2004. The
industry claims that promotion provides scientific and educational information to physicians. While some evidence indicates
that promotion may adversely influence prescribing, physicians hold a wide range of views about pharmaceutical
promotion. The objective of this review is to examine the relationship between exposure to information from
pharmaceutical companies and the quality, quantity, and cost of physicians’ prescribing.
Methods and Findings:
We searched for studies of physicians with prescribing rights who were exposed to information from
pharmaceutical companies (promotional or otherwise). Exposures included pharmaceutical sales representative visits, journal
advertisements, attendance at pharmaceutical sponsored meetings, mailed information, prescribing software, and participation
in sponsored clinical trials. The outcomes measured were quality, quantity, and cost of physicians’ prescribing. We searched
Medline (1966 to February 2008), International Pharmaceutical Abstracts (1970 to February 2008), Embase (1997 to February
2008), Current Contents (2001 to 2008), and Central (The Cochrane Library Issue 3, 2007) using the search terms developed with
an expert librarian. Additionally, we reviewed reference lists and contacted experts and pharmaceutical companies for
information. Randomized and observational studies evaluating information from pharmaceutical companies and measures of
physicians’ prescribing were independently appraised for methodological quality by two authors. Studies were excluded where
insufficient study information precluded appraisal. The full text of 255 articles was retrieved from electronic databases (7,185
studies) and other sources (138 studies). Articles were then excluded because they did not fulfil inclusion criteria (179) or quality
appraisal criteria (18), leaving 58 included studies with 87 distinct analyses. Data were extracted independently by two authors
and a narrative synthesis performed following the MOOSE guidelines. Of the set of studies examining prescribing quality
outcomes, five found associations between exposure to pharmaceutical company information and lower quality prescribing,
four did not detect an association, and one found associations with lower and higher quality prescribing. 38 included studies
found associations between exposure and higher frequency of prescribing and 13 did not detect an association. Five included
studies found evidence for association with higher costs, four found no association, and one found an association with lower
costs. The narrative synthesis finding of variable results was supported by a meta-analysis of studies of prescribing frequency
that found significant heterogeneity. The observational nature of most included studies is the main limitation of this review.
Conclusions:
With rare exceptions, studies of exposure to information provided directly by pharmaceutical companies have
found associations with higher prescribing frequency, higher costs, or lower prescribing quality or have not found
significant associations. We did not find evidence of net improvements in prescribing, but the available literature does not
exclude the possibility that prescribing may sometimes be improved. Still, we recommend that practitioners follow the
precautionary principle and thus avoid exposure to information from pharmaceutical companies.
Please see later in the article for the Editors’ Summary
.
Citation:Spurling GK, Mansfield PR, Montgomery BD, Lexchin J, Doust J, et al. (2010) Information from Pharmaceutical Companies and the Quality, Quantity, and Cost of Physicians’ Prescribing: A Systematic Review. PLoS Med 7(10): e1000352. doi:10.1371/journal.pmed.1000352
Academic Editor:David Henry, Institute for Clinical Evaluative Sciences, Canada ReceivedFebruary 5, 2010;AcceptedSeptember 2, 2010;PublishedOctober 19, 2010
Copyright:ß2010 Spurling et al. This is an open-access article distributed under the terms of the Creative Commons Attribution License, which permits unrestricted use, distribution, and reproduction in any medium, provided the original author and source are credited.
Funding:No direct funding was received for this study. The authors were personally salaried by their institutions during the period of writing (although no specific salary was set aside or given for the writing of this paper). No funding bodies had any role in the study design, data collection, analysis, decision to publish, or preparation of the manuscript.
Competing Interests:JL was paid for work with a Canadian generic company, Apotex Inc., in 2007. GS, PRM, BM, JL, NO, and AV are members of Healthy Skepticism Inc. Healthy Skepticism is an international nonprofit research, education, and advocacy association with the main aim of reducing harm from misleading health information. PRM is the director of Healthy Skepticism Inc., and is mostly unpaid. PRM’s wife and two of his daughters are part-time employees of Healthy Skepticism Inc. JL is a member of the management committee of Healthy Skepticism.
Introduction
Pharmaceutical companies in the United States spent about
US
$
57.5 billion, or 24.4% of their revenue, on promotion in 2004
[1]. One estimate of total promotional expenditure in France for
2004 is
J
2,908 million (12.2% of revenue). However, another
estimate is that pharmaceutical detailing cost
J
3,300 million and
accounted for 75% of the overall cost of promotion in that year
making promotion 17.3% of revenue [2]. Expenditure on
promotion is aimed at maximizing returns for the corporation
and shareholders [3]. The industry claims that promotion also
provides scientific and educational information to healthcare
professionals: ‘‘Appropriate marketing of medicines ensures that
patients have access to the products they need and that the
products are used correctly for maximum patient benefit. Our
relationships with healthcare professionals are critical to achieving
these goals because they enable us to – inform healthcare
professionals about the benefits and risks of our products to help
advance appropriate patient use, provide scientific and
education-al information, support mediceducation-al research and education’’ [4].
There is a wide range of views amongst health professionals
about pharmaceutical promotion. Qualitative studies suggest that
many perceive pharmaceutical promotion to be a useful and
convenient source of information [5–7]. Some doctors deny that
they are influenced by pharmaceutical company promotion or
claim that it influences others but not themselves [8–10].
Nonetheless, many of these physicians are willing to give
significant amounts of time to engaging in promotional activities
[11]. By contrast, several professional organisations have called for
more control of promotional activities [12,13] because of evidence
that promotion may be misleading [14–17].
The evidence base illuminating these conflicting views is
growing. In 2000, Wazana identified eight studies linking
pharmaceutical promotion to increased prescribing, ‘‘nonrational
prescribing,’’ and increased prescribing costs [18]. A 2005 review
concluded that promotion influences the prescribing by physicians
in training [19], and a second review in the same year concluded
that sales representatives influence prescribing [20].
Those previous reviews are now out of date, narrowly focused,
or only partially assessed the relationship between information
(promotional or otherwise) from pharmaceutical companies and
prescribing costs and quality. The objective of this review is to
examine the relationship between exposure to information directly
provided by pharmaceutical companies and the quality, quantity,
and cost of physicians’ prescribing.
Methods
Criteria for Including Studies
Randomized controlled trials, time series analyses, before–after
studies, cohort studies, case-control studies, ecological studies, and
cross-sectional studies were eligible for inclusion. Studies were
included if they had both a measure of exposure to any type of
information directly provided by pharmaceutical companies and a
measure of physicians’ prescribing. We excluded studies that
looked at the indirect provision of information, for example,
through continuing medical education courses that were funded by
unrestricted grants from pharmaceutical companies. Case series,
case reports, abstracts, news items, and short reports were
excluded.
Exposure to information directly provided by pharmaceutical
companies was defined as including pharmaceutical sales
repre-sentative visits, advertisements in journals or prescribing software,
presentations from pharmaceutical companies to groups, meetings
sponsored by pharmaceutical companies, mailed information
including advertisements, and participation in sponsored clinical
trials. We did not include studies of other forms of promotion such
as gifts or samples or studies of indirect forms of information
provision such as sponsored education.
The outcome measures were the quality, frequency, and costs of
prescribing.
Search Methods for Identification of Studies
We searched Medline (1966 to February 2008), International
Pharmaceutical Abstracts (1970 to February 2008), Embase (1997
to February 2008), Current Contents (2001 to 2008), and Central
(The Cochrane Library Issue 3, 2007). The search strategy below
was devised for Medline by an expert librarian at the University of
Queensland and adapted for the other databases: (exp Drug
Industry OR exp Advertising OR exp Gift Giving OR exp
‘‘Conflict of Interest’’) AND (exp Prescriptions, Drug/OR
(prescribing or prescription
$
).mp.))
We looked for additional articles in the references of each
retrieved article including review articles in an iterative, exhaustive
process. Efforts to find additional studies included placement of
messages on email drug discussion groups, contacting experts in
the field, and asking Australian subsidiaries of international
pharmaceutical companies for information. All languages were
considered.
Selection of Studies
The title and abstract, if available, of all articles detected by the
database searches were reviewed by two authors. Articles that
possibly met the inclusion criteria were retrieved and subjected to
a formal inclusion process independently by two different authors.
Differences of opinion were resolved by consensus and if necessary
a third author was involved.
Quality Appraisal
Articles meeting inclusion criteria were appraised for
method-ological quality independently by two authors. Randomized
studies were assessed for adequacy of randomization method,
allocation concealment, blinding, follow-up, and use of intention
to treat analyses [21]. Controlled cohort and case-control studies
were assessed using the Newcastle-Ottawa scales [22]. For other
nonrandomized studies, quality appraisal included assessment of
sources of bias, for example presence of a control group, selection
methods, control of confounding, response rate (
.
80%), and use
of appropriate statistical tests [23]. Studies were only excluded
from the review if two authors found there was insufficient
information to appraise their quality. Disagreements were resolved
by discussion with a third author.
Data Extraction
For included studies, two authors independently extracted data
on study site, dates of data collection or publication, types of
participants (primary care providers, specialists, and residents),
study medication(s), exposure to information from pharmaceutical
companies, and prescribing outcomes.
Reporting of Results
For quality of prescribing we accepted the original authors’
definitions of what constituted more (or less) appropriate
prescribing.
delivered with versus without conventional promotion may
produce different effects on prescribing.
Conventional promotional techniques were defined as
adver-tisements (in journals and software), representatives’ visits,
attendance at pharmaceutical sponsored meetings, and mailed
information from pharmaceutical companies. In addition, we
included in this group studies looking at total promotional
investment/summated scores of commercial information use/
general use of commercial sources. The other group of studies
included warning letters, participation in company sponsored
trials, and representatives’ visits for nonpromotional purposes.
A narrative synthesis of results was undertaken following the
MOOSE guidelines and meta-analysis performed where
appro-priate data were available (Text S1) [24]. The unit of analysis was
defined as the combination of exposure to a type of information
from a pharmaceutical company (for example pharmaceutical
sales representative visits or journal advertisements) and a type of
prescribing outcome (quality, frequency, and cost of prescribing).
Thus studies were treated as a single unit of analysis if they
measured the same type of exposure and the same type of outcome
regardless of the number of drugs covered in each study. We
classified each analysis as positive or negative rather than no
association detected if the
p
value was less than 5% (
p
,
0.05)
regardless of the magnitude of the effect.
We reported standardized effect measures (Pearson correlation
coefficients, odds ratios [ORs], or beta coefficients) where study
reports provided them or the data needed to calculate them. For
econometric studies, we also reported
t
statistics where they were
reported or it was possible to calculate them.
Meta-analysis was not appropriate for the outcomes of quality of
prescribing and cost of prescribing because in both cases the
studies examined different exposures or outcome measures and/or
lacked control groups. We undertook a meta-analysis for one
component—studies of frequency of prescribing with identifiable
control groups where the information exposure was delivered with
conventional promotional techniques. We used ORs for change in
prescribing frequency as the outcome measure. Where studies had
suitable designs for inclusion in the meta-analysis but ORs and
standard errors were not published we contacted corresponding
authors. Out of ten studies [25–34], we received four replies of
which three provided the information we required [29–31].
Heterogeneity was assessed using the tau squared test with a
sensitivity analysis to investigate likely sources of heterogeneity.
Factors identified a priori as possible explanations for
heteroge-neity were study design, study quality indicators, year of
publication, type of exposure to pharmaceutical company
information (active versus passive), and physician characteristics
(level of experience and also primary care provider versus
specialist). We defined active exposure as information presented
to physicians at meetings or during pharmaceutical sales
representatives’ visits. We defined passive exposure as journal
advertisements, mailed information, advertisements on clinical
software, and participation in sponsored clinical trials. Studies
reporting more than one unit of analysis were subjected to
sensitivity analysis. Meta-analysis was performed using RevMan
(version 5.0.24) with further analysis conducted using Stata version
10.0 (Stata Corporation).
Results
Search Results
Our search found 7,185 studies from electronic databases and
138 studies were retrieved from reference lists, experts in the field
and email lists. The full text of 255 articles was retrieved. 18
studies were excluded, all because inadequate reporting precluded
quality assessment. Quality appraisal results for included studies
are presented in Tables 1–5. Following application of inclusion/
exclusion criteria and quality appraisal, 58 studies were included in
the review (52 published in journals [25–33,35–77], three reports
[78–80], one dissertation [34], one conference presentation [81],
and one conference poster [82] (Figure 1). Of these 58, 29 studies
came from database searches [25–31,33,35–38,41,44,55,56,59–
62,66–68,70–72,74,76,77], 22 studies came from reference lists
[32,39,40,46–54,58,63–65,69,73,75,78,79], five studies came from
experts in the field [34,43,57,81,82], and two from email lists
[45,80]. These 58 studies included 87 units of analysis.
Pharmaceutical companies provided 62 citations; two of these
met our inclusion criteria and had already been identified through
Medline searches [27,35]. Five of the studies located through the
e-mail lists and experts were not indexed in the databases we
searched [34,43,80–82]. For one study [78], additional data were
obtained from the authors [83].
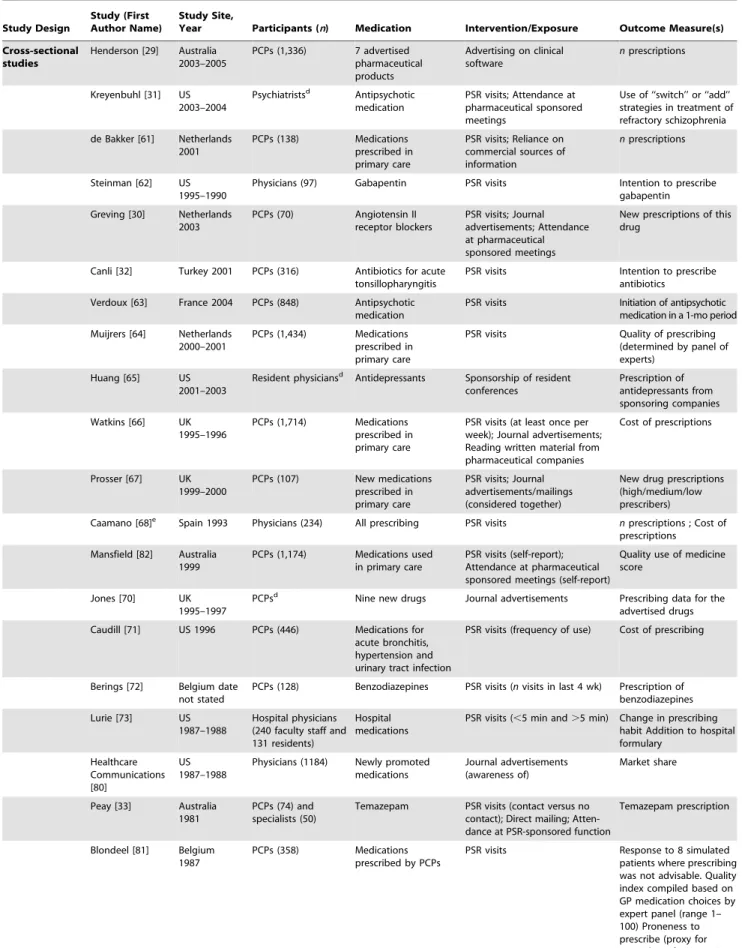
General Characteristics of Studies
The most common study design was cross-sectional (24/58
studies, 41%). There were also two cluster randomized controlled
trials, one controlled-cohort study, two case-control studies, 24
time-series analyses, and five before–after studies. Over half (55%)
of the studies were conducted in the United States. Characteristics
of included studies are outlined in Table 6.
Pharmaceutical Company Information and Prescribing
Quality
Prescribing quality was measured by ten studies with 14 units of
analysis [37,39,58,59,61,64,74,77,81,82] (Table 7). Quality was
assessed in four distinct ways: quality scoring of prescribing
decisions, guideline adherence, prescribing appropriateness of an
individual drug class, and prescribing range. Three studies used
quality scores calculated by coding physicians’ drug choices in
responses to clinical vignettes [74,81,82]. One of these used an
expert panel to derive a quality index (1–100) judging primary
care providers’ prescribing in response to both their actual
prescribing and clinical vignettes [81]. In the latter study learning
about the drug first from pharmaceutical sales representatives was
associated with lower quality of actual prescribing but the number
of pharmaceutical sales representatives’ visits was not. There was
no significant association between primary care providers seeing
more pharmaceutical sales representatives or first learning about
the drug from pharmaceutical sales representatives and lower
quality responses to case vignettes [81]. Another study combined
scales examining indication, effectiveness, safety, dosage, duration,
and polypharmacy to produce a seven-point scale measuring
rationality of prescribing [74]. Primary care providers’
self-reported reliance on pharmaceutical companies for information
was associated with lower quality scores [74]. A third study used a
quality score for a hypertension scenario where thiazides were
considered very appropriate and all other drug groups were
considered very inappropriate [82]. Self-reported rates of
attendance at pharmaceutical company-sponsored meetings were
associated with slightly lower quality scores, but self-reported rates
of pharmaceutical sales representative visits had no significant
association [82].
Residents attending a sponsored meeting were more likely than
nonattending residents at the same hospital to prescribe the
sponsoring company’s medication, both when it was appropriate
according to the authors and when it was not [39].
general as a source of information prescribed a wider range of
drugs [61]. The authors suggested that this was a sign of lower
prescribing quality in the context of recommendations that
primary care providers use a limited list of drugs they know well
[61].
Two studies measured guideline adherence. One found less
adherence by primary care providers who received more frequent
visits from pharmaceutical sales representatives [64], while the
other found no change in adherence by primary care providers
participating in a clinical trial sponsored by a pharmaceutical
company [37].
One study of warnings conveyed by pharmaceutical sales
representatives and mailed information [58], one of mailed
warnings alone [59], and one of representatives’ visits and
advertisements [77] found that there was no alteration in overall
rates of prescriptions judged to be inappropriate.
Pharmaceutical Company Information and Prescribing
Frequency
51 studies [25–54,56–60,62,63,65,67–70,72,73,75–81]
mea-sured prescribing frequency as market share, intention to
prescribe, prescription sales, formulary requests, as well as number
of prescriptions (63 units of analysis) (Table 8). Below we report
separately the results of studies of information delivered with
versus without conventional promotion. Within both groups there
was one unit of analysis per study.
Conventional Promotional Techniques
Pharmaceutical sales representative visits.
Of the 29
studies of pharmaceutical sales representative visits, 17 found only
an association with increased prescribing of the promoted drug
[26,32,33,38,40,43–50,63,67,78,79]. None found less frequent
prescribing. Of the remaining 11, six studies had mixed results:
finding a significant association with more frequent prescribing for
some
measures
but
no
significant
association
for
others
[27,42,62,69,73,81].
Five
did
not
detect
any
significant
relationship [31,52,68,72,77]. One study did not use statistical
tests for associations. It found that during the time that spending
by pharmaceutical companies on promotion of a medication
dropped to zero, there was also a significant drop in prescribing of
that medication. However most of the decreases in promotion and
prescribing occurred after the publication of evidence of problems
with that medication [56].
Nine of these studies with either positive or mixed results
provided insights into features of pharmaceutical sales
represen-tative visits that modified the impact of these visits on prescribing
[40,46,49,62,67,69,73,78]. An association with more frequent
prescribing was more likely when pharmaceutical sales
represen-tatives visited groups of physicians, when physicians had lower
baseline prescribing of the promoted drug [62], and when
physicians had larger prescribing volumes overall [67]. Longer
pharmaceutical sales representative visits to physicians and
residents were also more likely to be associated with increased
prescribing [69,73]. More frequent pharmaceutical sales
repre-sentative
visits
were
associated
with
diminishing
returns
[46,50,69].
In addition to increasing the promoted drug’s market share,
pharmaceutical sales representative visits were associated with a
decrease in the market share of competitor products [78].
Pharmaceutical sales representative visits were more likely to be
associated with more frequent prescriptions for drugs judged more
effective and also for drugs with more side effects [40]. However
the authors of that study did not attempt to measure whether
higher levels of use represented a change in prescribing quality.
Another study found that pharmaceutical sales representative visits
were associated with a greater increase in market share for new
entrants into a therapeutic field than was positive scientific
information [49].
Journal advertisements.
Four out of the eight studies
measuring the effects of journal advertisements presented data
but did not include statistical tests [25,34,70,80]. One of these
noted use of a medication class increased after pharmaceutical
advertising commenced in a country where the medication class
was previously available but was not promoted [25]. One study
visually
compared
graphs
of
the
monthly
number
of
advertisements and prescriptions for a group of nine drugs and
found no clear relationship between the extent of the advertising of
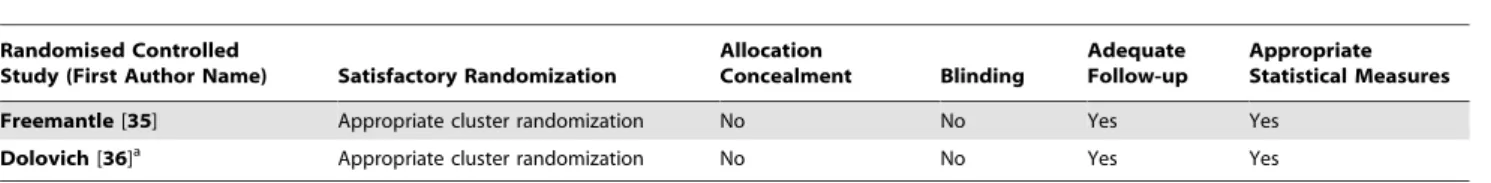
Table 1.
Quality appraisal of included studies: randomised controlled trials.
Randomised Controlled
Study (First Author Name) Satisfactory Randomization
Allocation
Concealment Blinding
Adequate Follow-up
Appropriate Statistical Measures
Freemantle[35] Appropriate cluster randomization No No Yes Yes
Dolovich[36]a Appropriate cluster randomization No No Yes Yes
aReceived research funding from a pharmaceutical company.
doi:10.1371/journal.pmed.1000352.t001
Table 2.
Quality appraisal of included studies: controlled cohort and case-control studies.
Study Type
Study (First Author Name)
Prospective Design
Comparability of Cases and Controls
Selection Bias Minimized
Response Rate.80%
Confounders Controlled
Appropriate Statistical Measures
Adequate Follow-Up Controlled
Cohort
Andersen [37]a No Yes Yes Yes Yes Yes Yes
Case-Control Spingarn [39] No Yes No Yes (100%) Yes Yes Yes
Chren [38] No Yes Yes Yes (88%) Yes Yes Yes
aReceived research funding from a pharmaceutical company.
a drug and the amount of prescribing by general practitioners
[70]. One study found that the market share of a medication was
higher amongst physicians who recognised the advertisement for
that medication compared to those who did not [80]. The last
study observed decreased prescribing of two drug classes at the
same time that advertising decreased [34].
Of the four studies that included statistical tests, one found
that journal advertisements have a more pronounced effect on
market share for the advertised drug than does positive
scientific information published in medical journals [49]. A
cross-sectional study found contradictory results. Self-reported
infrequent use of journal advertisements by physicians to learn
about new medications was not associated with frequency of
prescribing. However, infrequent use of journal advertisements
was associated with less chloramphenicol prescribing [77].
One cross-sectional study found that physicians who recalled
advertisements became prescribers of the advertised products
in consistently larger proportions than those who did not recall
advertisements [75]. Another study found that 9% of high
prescribers of new drugs cited advertisements as an influence
on their prescribing compared to 0% for low prescribers;
however, this was not a statistically significant association
[67].
Attendance at pharmaceutical company-sponsored
meet-ings.
There were eight studies of pharmaceutical
company-sponsored meetings. Five found positive associations with
prescribing frequency [28,31,43,60,65]. Three studies did not
detect a significant association [33,39,40].
Table 3.
Quality appraisal of included studies: time-series analyses.
Time-Series Analysis
Study (First Author Name)
Prospective Design
Control Group
Confounders Controlled
Selection Bias Minimized
Appropriate Statistical Measures
Econometric Ching [78] No No Yes Yes Yes
Venkataraman [40] No No Yes Yes Yes
Windmeijer [41] No No Yes Yes Yes
Chintagunta [42] No No Yes Yes Yes
Narayanan [43] No No Yes Yes Yes
Donohue [44] No No Yes Yes Yes
Mizik [45] No No Yes Yes Yes
Manchanda [46] No No Yes Yes Yes
Manchanda and Chintagunta [47]
No No Yes Yes Yes
Berndt [48] No No Yes Yes Yes
Rosenthal [79] No No Yes No Yes
Azoulay [49] No No Yes Yes Yes
Rizzo [50] No No Yes No Yes
Hurwitz [51] No No Yes Yes Yes
Mackowiak [52] No No No Yes Yes
Leffler [53] No No Yes Yes Yes
Telser [54] No No Yes Yes Yes
Other Spurling [55] Yes No No No Yes
Stafford [56] Yes No No Yes No
Charbit [34] No No No Yes No
Auvray [57] No No No No No
Cleary [26] Yes Yes Yes No Yes
Soumerai [58] No Yes No Yes No
doi:10.1371/journal.pmed.1000352.t003
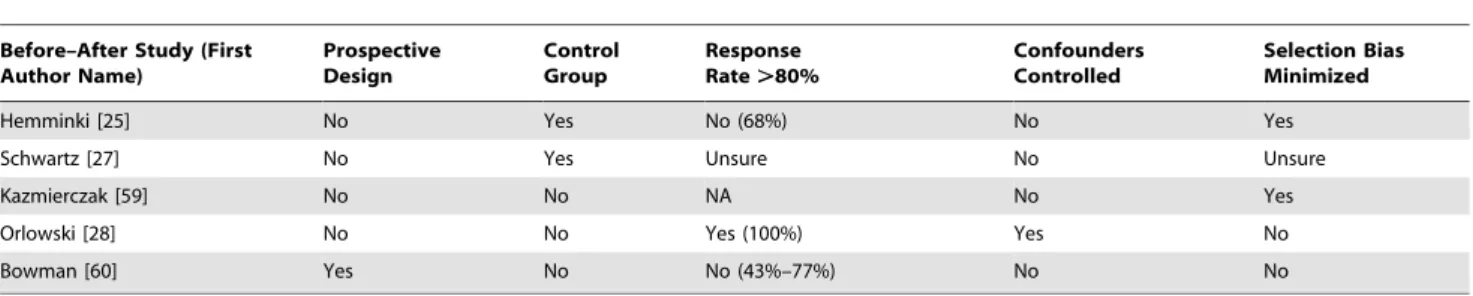
Table 4.
Quality appraisal of included studies: before–after studies.
Before–After Study (First Author Name)
Prospective Design
Control Group
Response Rate.80%
Confounders Controlled
Selection Bias Minimized
Hemminki [25] No Yes No (68%) No Yes
Schwartz [27] No Yes Unsure No Unsure
Kazmierczak [59] No No NA No Yes
Orlowski [28] No No Yes (100%) Yes No
Bowman [60] Yes No No (43%–77%) No No
Mailed
information
from
pharmaceutical
com-panies.
One of the three studies of mailed promotional
ma-terial found an association with increased prescribing [76]. The
others found no association [33,67].
Advertising in clinical software.
A single study examined
the effect of advertising in clinical practice software and found no
association with prescribing frequency for six medications and less
prescribing of one medication [29]. The overall result was no
association between advertising and prescribing frequency.
Total promotional investment.
Eight studies combined the
outcome measures for various exposures to pharmaceutical
company information or measured overall promotional
invest-ment, a proxy for the amount of exposure to information from
pharmaceutical companies. Three studies found that total
pro-motional investment was positively associated with prescribing
frequency [30,33,51]. Two studies found both positive results and
no association [53,54]. One study did not detect an association
[52].
Meta-analysis of promotional information and
prescrib-ing frequency.
We pooled results from a total of seven studies
using a random effects model to examine whether exposure to
promotion was associated with prescribing of the promoted
medication. The seven study results included in the
meta-analysis
showed
significant
heterogeneity
(
I
2= 91%
[95%
confidence interval (CI) 84%–95%], tau
2= 0.35), and therefore
we have presented the forest plot without the pooled outcome
(Figure 2) [29,30,31,38,39,63,75]. Using sensitivity analysis we
found that study design, quality factors, year of publication, and
type of physician did not explain this heterogeneity. One study
provided two units of analysis with outcomes amenable to
meta-analysis: a significant association for attendance at sponsored
meetings and a nonsignificant result for pharmaceutical sales
representative
(PSR)
visits
[31].
We
included
only
that
nonsignificant result in the forest plot (Figure 2). When
meta-analysis was conducted using the significantly positive result for
attendance at a pharmaceutical company-sponsored meeting, the
summary result and level of heterogeneity did not differ greatly.
The largest difference detected was between exposure to active
promotional
information
(OR
2.34,
95%
CI
1.50–3.65),
(
I
2= 59%, 95% CI 0%–86%, tau squared = 0.11) [31,38,39,63]
and passive promotional information (OR 1.24, 95% CI 0.72–
2.15) (I
2= 89.5%, tau squared = 0.14) [29,75].
Information Delivered Without Conventional Promotion
Techniques
Five studies looked for associations between information
delivered without conventional promotion techniques and the
frequency of physicians’ prescribing [35,36,37,58,59]. One
randomized controlled trial partnered a local health authority
Table 5.
Quality appraisal of included studies: cross-sectional studies (no control group).
Cross-Sectional Study (First Author Name)
Prospective Design
Response Rate.80%
Confounders Controlled
Selection Bias Minimized
Appropriate Statistical Measures
Henderson [29]a No Yes Yes Yes Yes
Greving [30] No Yes (96%) Yes Yes Yes
Kreyenbuhl [31] Yes No (58%) No Yes Yes
de Bakker [61] No Unsure Yes Yes Yes
Steinman [62] No Yes Yes No Yes
Canli [32] Yes No (79%) No Yes Yes
Verdoux [63] Yes No (24%) Yes No Yes
Muijrers [64] Yes No (71%) Yes Yes Yes
Huang [65] No NA No No Yes
Watkins [66] Yes No (64%) Yes Yes Yes
Prosser [67] Yes No (73%) No Yes No
Caamano [68] Yes No (75%) Yes Yes Yes
Gonul [69] Yes NA Yes Unsure Yes
Mansfield [82] Yes No (6%) No No Yes
Jones [70] Yes NA No No No
Caudill [71] Yes No (28%) Yes Yes Yes
Berings [72] Yes No (28%) Yes No Yes
Lurie [73] Yes No (75–78%) Yes Yes Yes
Health Care Communications 1989a[80]
No Unsure No No No
Peay [33] No No (52%–70%) Yes Yes Yes
Blondeel [81] Yes No (30%) Yes Yes Yes
Haayer [74] Yes Yes (90%) Yes No Yes
Walton [75] Yes Unsure No Yes Yes
Dajda [76] No NA No Yes Yes
Becker [77] Yes Yes (84%) Yes Yes Yes
aReceived research funding from a pharmaceutical company.
and a pharmaceutical company with the aim of promoting a less
expensive drug [35], and the other randomized controlled trial
aimed to promote rational prescribing through evidence-based
detailing by a pharmaceutical company in partnership with an
academic institution [36]. Neither found an association with
physicians’ prescribing. A single controlled-cohort study of a
pharmaceutical company-funded randomized controlled trial found
that physicians’ participation in recruiting subjects was associated
with an increase in the number of prescriptions of the sponsoring
company’s drug [37]. One time-series analysis found no change in
the rate of decline in the prescribing of a medication when the main
manufacturer was required by a regulatory agency to deliver an
educational program warning about problems with the drug via
mailed information and pharmaceutical sales representative visits
[58]. A cross-sectional study found no change in prescription rates
following warning letters regarding drug side effects [59].
Pharmaceutical Company Information and Prescribing
Costs
Eight studies (Table 9) [35,41,50,55,66,68,69,71] measured
prescribing costs as costs per physician, price elasticity, and
changes in generic prescribing (ten units of analysis). In the United
States, one econometric time-series analysis found that
pharma-ceutical sales representative visits were associated with increased
price sensitivity among physicians prescribing in one therapeutic
class [69], and another found the opposite effect for hypertension
[50]. A third, more recent, econometric study found that
promotional outlay (the total for pharmaceutical sales
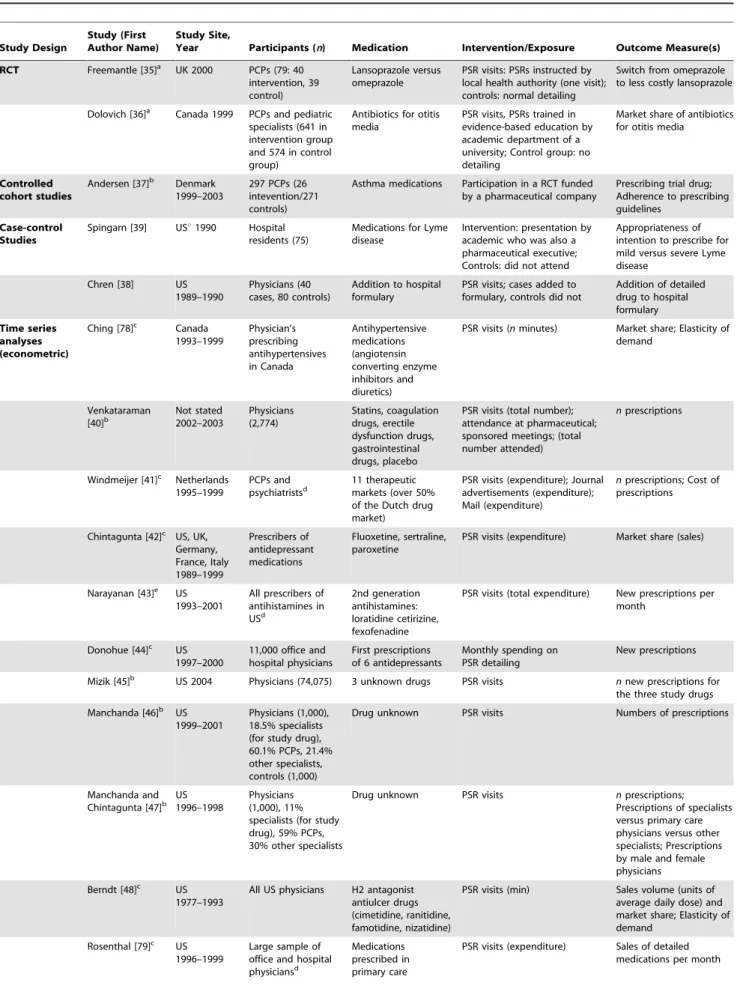
represen-Figure 1. Study flow diagram.Table 6.
Characteristics of included studies (by study design, year of publication, then sample size).
Study Design
Study (First Author Name)
Study Site,
Year Participants (n) Medication Intervention/Exposure Outcome Measure(s) RCT Freemantle [35]a UK 2000 PCPs (79: 40
intervention, 39 control)
Lansoprazole versus omeprazole
PSR visits: PSRs instructed by local health authority (one visit); controls: normal detailing
Switch from omeprazole to less costly lansoprazole
Dolovich [36]a Canada 1999 PCPs and pediatric
specialists (641 in intervention group and 574 in control group)
Antibiotics for otitis media
PSR visits, PSRs trained in evidence-based education by academic department of a university; Control group: no detailing
Market share of antibiotics for otitis media
Controlled cohort studies
Andersen [37]b Denmark
1999–2003
297 PCPs (26 intevention/271 controls)
Asthma medications Participation in a RCT funded by a pharmaceutical company
Prescribing trial drug; Adherence to prescribing guidelines
Case-control Studies
Spingarn [39] USu1990 Hospital residents (75)
Medications for Lyme disease
Intervention: presentation by academic who was also a pharmaceutical executive; Controls: did not attend
Appropriateness of intention to prescribe for mild versus severe Lyme disease
Chren [38] US 1989–1990
Physicians (40 cases, 80 controls)
Addition to hospital formulary
PSR visits; cases added to formulary, controls did not
Addition of detailed drug to hospital formulary
Time series analyses (econometric)
Ching [78]c Canada
1993–1999 Physician’s prescribing antihypertensives in Canada Antihypertensive medications (angiotensin converting enzyme inhibitors and diuretics)
PSR visits (nminutes) Market share; Elasticity of demand Venkataraman [40]b Not stated 2002–2003 Physicians (2,774) Statins, coagulation drugs, erectile dysfunction drugs, gastrointestinal drugs, placebo
PSR visits (total number); attendance at pharmaceutical; sponsored meetings; (total number attended)
nprescriptions
Windmeijer [41]c Netherlands
1995–1999
PCPs and psychiatristsd
11 therapeutic markets (over 50% of the Dutch drug market)
PSR visits (expenditure); Journal advertisements (expenditure); Mail (expenditure)
nprescriptions; Cost of prescriptions
Chintagunta [42]c US, UK,
Germany, France, Italy 1989–1999 Prescribers of antidepressant medications Fluoxetine, sertraline, paroxetine
PSR visits (expenditure) Market share (sales)
Narayanan [43]e US
1993–2001
All prescribers of antihistamines in USd 2nd generation antihistamines: loratidine cetirizine, fexofenadine
PSR visits (total expenditure) New prescriptions per month
Donohue [44]c US
1997–2000
11,000 office and hospital physicians
First prescriptions of 6 antidepressants
Monthly spending on PSR detailing
New prescriptions
Mizik [45]b US 2004 Physicians (74,075) 3 unknown drugs PSR visits nnew prescriptions for
the three study drugs
Manchanda [46]b US
1999–2001
Physicians (1,000), 18.5% specialists (for study drug), 60.1% PCPs, 21.4% other specialists, controls (1,000)
Drug unknown PSR visits Numbers of prescriptions
Manchanda and Chintagunta [47]b
US 1996–1998
Physicians (1,000), 11% specialists (for study drug), 59% PCPs, 30% other specialists
Drug unknown PSR visits nprescriptions; Prescriptions of specialists versus primary care physicians versus other specialists; Prescriptions by male and female physicians
Berndt [48]c US
1977–1993
All US physicians H2 antagonist antiulcer drugs (cimetidine, ranitidine, famotidine, nizatidine)
PSR visits (min) Sales volume (units of average daily dose) and market share; Elasticity of demand
Rosenthal [79]c US
1996–1999
Large sample of office and hospital physiciansd
Medications prescribed in primary care
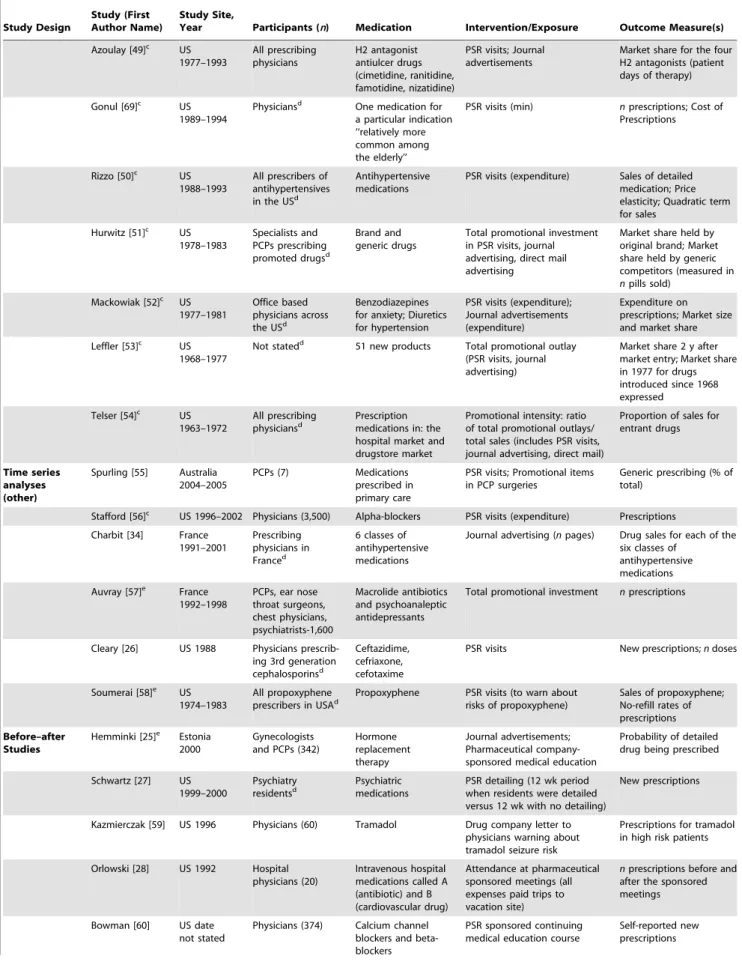
Study Design
Study (First Author Name)
Study Site,
Year Participants (n) Medication Intervention/Exposure Outcome Measure(s) Azoulay [49]c US
1977–1993 All prescribing physicians H2 antagonist antiulcer drugs (cimetidine, ranitidine, famotidine, nizatidine)
PSR visits; Journal advertisements
Market share for the four H2 antagonists (patient days of therapy)
Gonul [69]c US
1989–1994
Physiciansd One medication for
a particular indication ‘‘relatively more common among the elderly’’
PSR visits (min) nprescriptions; Cost of Prescriptions
Rizzo [50]c US
1988–1993
All prescribers of antihypertensives in the USd
Antihypertensive medications
PSR visits (expenditure) Sales of detailed medication; Price elasticity; Quadratic term for sales
Hurwitz [51]c US
1978–1983
Specialists and PCPs prescribing promoted drugsd
Brand and generic drugs
Total promotional investment in PSR visits, journal advertising, direct mail advertising
Market share held by original brand; Market share held by generic competitors (measured in npills sold)
Mackowiak [52]c US 1977–1981
Office based physicians across the USd
Benzodiazepines for anxiety; Diuretics for hypertension
PSR visits (expenditure); Journal advertisements (expenditure)
Expenditure on prescriptions; Market size and market share
Leffler [53]c US
1968–1977
Not statedd 51 new products Total promotional outlay
(PSR visits, journal advertising)
Market share 2 y after market entry; Market share in 1977 for drugs introduced since 1968 expressed
Telser [54]c US
1963–1972
All prescribing physiciansd
Prescription medications in: the hospital market and drugstore market
Promotional intensity: ratio of total promotional outlays/ total sales (includes PSR visits, journal advertising, direct mail)
Proportion of sales for entrant drugs
Time series analyses (other)
Spurling [55] Australia 2004–2005
PCPs (7) Medications prescribed in primary care
PSR visits; Promotional items in PCP surgeries
Generic prescribing (% of total)
Stafford [56]c US 1996–2002 Physicians (3,500) Alpha-blockers PSR visits (expenditure) Prescriptions
Charbit [34] France 1991–2001
Prescribing physicians in Franced
6 classes of antihypertensive medications
Journal advertising (npages) Drug sales for each of the six classes of
antihypertensive medications
Auvray [57]e France
1992–1998
PCPs, ear nose throat surgeons, chest physicians, psychiatrists-1,600 Macrolide antibiotics and psychoanaleptic antidepressants
Total promotional investment nprescriptions
Cleary [26] US 1988 Physicians prescrib-ing 3rd generation cephalosporinsd
Ceftazidime, cefriaxone, cefotaxime
PSR visits New prescriptions;ndoses
Soumerai [58]e US
1974–1983
All propoxyphene prescribers in USAd
Propoxyphene PSR visits (to warn about risks of propoxyphene)
Sales of propoxyphene; No-refill rates of prescriptions
Before–after Studies
Hemminki [25]e Estonia
2000
Gynecologists and PCPs (342)
Hormone replacement therapy
Journal advertisements; Pharmaceutical company-sponsored medical education
Probability of detailed drug being prescribed
Schwartz [27] US 1999–2000
Psychiatry residentsd
Psychiatric medications
PSR detailing (12 wk period when residents were detailed versus 12 wk with no detailing)
New prescriptions
Kazmierczak [59] US 1996 Physicians (60) Tramadol Drug company letter to physicians warning about tramadol seizure risk
Prescriptions for tramadol in high risk patients
Orlowski [28] US 1992 Hospital physicians (20)
Intravenous hospital medications called A (antibiotic) and B (cardiovascular drug)
Attendance at pharmaceutical sponsored meetings (all expenses paid trips to vacation site)
nprescriptions before and after the sponsored meetings
Bowman [60] US date not stated
Physicians (374) Calcium channel blockers and beta-blockers
PSR sponsored continuing medical education course
Study Design
Study (First Author Name)
Study Site,
Year Participants (n) Medication Intervention/Exposure Outcome Measure(s) Cross-sectional
studies
Henderson [29] Australia 2003–2005
PCPs (1,336) 7 advertised pharmaceutical products
Advertising on clinical software
nprescriptions
Kreyenbuhl [31] US 2003–2004
Psychiatristsd Antipsychotic
medication
PSR visits; Attendance at pharmaceutical sponsored meetings
Use of ‘‘switch’’ or ‘‘add’’ strategies in treatment of refractory schizophrenia
de Bakker [61] Netherlands 2001
PCPs (138) Medications prescribed in primary care
PSR visits; Reliance on commercial sources of information
nprescriptions
Steinman [62] US 1995–1990
Physicians (97) Gabapentin PSR visits Intention to prescribe gabapentin
Greving [30] Netherlands 2003
PCPs (70) Angiotensin II receptor blockers
PSR visits; Journal advertisements; Attendance at pharmaceutical sponsored meetings
New prescriptions of this drug
Canli [32] Turkey 2001 PCPs (316) Antibiotics for acute tonsillopharyngitis
PSR visits Intention to prescribe antibiotics
Verdoux [63] France 2004 PCPs (848) Antipsychotic medication
PSR visits Initiation of antipsychotic medication in a 1-mo period
Muijrers [64] Netherlands 2000–2001
PCPs (1,434) Medications prescribed in primary care
PSR visits Quality of prescribing (determined by panel of experts)
Huang [65] US 2001–2003
Resident physiciansd Antidepressants Sponsorship of resident
conferences
Prescription of antidepressants from sponsoring companies
Watkins [66] UK 1995–1996
PCPs (1,714) Medications prescribed in primary care
PSR visits (at least once per week); Journal advertisements; Reading written material from pharmaceutical companies
Cost of prescriptions
Prosser [67] UK 1999–2000
PCPs (107) New medications prescribed in primary care
PSR visits; Journal advertisements/mailings (considered together)
New drug prescriptions (high/medium/low prescribers)
Caamano [68]e Spain 1993 Physicians (234) All prescribing PSR visits nprescriptions ; Cost of
prescriptions
Mansfield [82] Australia 1999
PCPs (1,174) Medications used in primary care
PSR visits (self-report); Attendance at pharmaceutical sponsored meetings (self-report)
Quality use of medicine score
Jones [70] UK 1995–1997
PCPsd Nine new drugs Journal advertisements Prescribing data for the
advertised drugs
Caudill [71] US 1996 PCPs (446) Medications for acute bronchitis, hypertension and urinary tract infection
PSR visits (frequency of use) Cost of prescribing
Berings [72] Belgium date not stated
PCPs (128) Benzodiazepines PSR visits (nvisits in last 4 wk) Prescription of benzodiazepines
Lurie [73] US 1987–1988
Hospital physicians (240 faculty staff and 131 residents)
Hospital medications
PSR visits (,5 min and.5 min) Change in prescribing habit Addition to hospital formulary
Healthcare Communications [80]
US 1987–1988
Physicians (1184) Newly promoted medications
Journal advertisements (awareness of)
Market share
Peay [33] Australia 1981
PCPs (74) and specialists (50)
Temazepam PSR visits (contact versus no contact); Direct mailing; Atten-dance at PSR-sponsored function
Temazepam prescription
Blondeel [81] Belgium 1987
PCPs (358) Medications prescribed by PCPs
tative visits, journal advertisements, and direct mail) was associated
with reduced price sensitivity for primary care providers and
psychiatrists in 11 therapeutic classes consisting of more than 50%
of the Dutch drug market [41]. Of three cross-sectional studies,
two detected an association between pharmaceutical sales
representative visits and higher prescribing costs [66,71], but one
did not detect an association [68]. One study also found that low
cost prescribers were more likely to have rarely or never read
promotional mail or journal advertisements from pharmaceutical
companies than high cost prescribers [66]. One time-series
analysis found that reduced exposure to pharmaceutical sales
representative visits and promotional material was associated with
an increase in generic prescribing [55]. A randomized controlled
trial of pharmaceutical sales representative visits in a
noncom-mercial partnership between a pharmaceutical company and a
local health authority measured physicians’ prescribing costs for
the target drug class and found no effect [35].
Discussion
Overview
We found that the reported relationship between exposure to
information provided directly by pharmaceutical companies and
the quality, frequency, and cost of prescribing varied from case to
case. However, with only one exception [39], the included studies
reported that exposure to information from pharmaceutical
companies was associated with either lower prescribing quality
or no association was detected. Similarly, exposure to information
from pharmaceutical companies was associated with either an
increase in prescribing frequency or no association was detected.
Three studies found that exposure was associated with increased
drug sales up to a point of diminishing returns beyond which more
promotion was increasingly less effective [46,50,69]. Finally, with
only one exception [69], exposure to information from
pharma-ceutical companies was associated with an increase in prescribing
costs or no association was detected.
This review has supported, updated, and extended the findings
of previous reviews regarding the effects of exposure to
information from pharmaceutical companies. 38 of the 58
included studies (66%) were not included in previous systematic
reviews on this topic [25,29–32,34,35,40–42,44,48,49,51–59,61–
68,70,72,75,76,78–82], including seven of the ten studies of
prescribing quality [37,58,59,61,64,81,82] and four of the seven
studies of prescribing costs [35,55,66,68].
Most of the included studies measured the frequency of
prescribing. Amongst these, the studies of informational exposure
where physicians are active participants, such as representatives’
visits, sponsored meetings, or sponsored trials, more consistently
found associations with higher prescribing frequency than studies
of more passive exposures, such as journal advertisements and
mailed information. Poor study quality precludes confident
conclusions about journal advertising. However, one higher
quality econometric analysis found that advertisements in journals
were associated with a more pronounced effect on market share
than positive scientific findings published in journals [49]. Also
there are claims in the marketing literature that the relatively low
cost of passive methods and their ability to synergistically increase
the effectiveness of active methods makes them cost effective
components of sales campaigns [84].
Limitations of Included Studies
All of the included studies had design limitations (Tables 1–5).
We found only two randomized controlled trials [35,36]. Both
lacked adequate reporting of allocation concealment and blinding.
These two trials did not examine standard promotional practice
but instead assessed novel partnerships of government or academia
with industry aiming for less expensive, higher quality prescribing.
On the basis of these two negative randomized controlled trials, it
seems unlikely that similar partnerships will have beneficial effects
on prescribing. No definite conclusions can be extrapolated from
these studies to standard promotional practice.
All other included studies were observational and thus able to
measure associations but not prove causation. There is a risk that
reported associations may be false positives, and that statistically
significant findings may not necessarily be clinically significant.
One example is the study by Mizik et al. that reports only a small
Study DesignStudy (First Author Name)
Study Site,
Year Participants (n) Medication Intervention/Exposure Outcome Measure(s) Haayer [74] Netherlands
1979
PCPs (116) Medications that would result from 8 case-histories devised by a panel
PSR visits; Journal advertisements; Companies’ mailings
Prescribing rationality based on a composite scale (drug choice, duration, dose and use of combination products)
Walton [75] US 1976–77 PCPs (29%) and specialists (71%) (1,000 total)
186 different medications
Journal advertisements Prescriptions of advertised drugs (intention to prescribe)
Dajda [76] UK 1975 PCPs in UKd Branded advertised
drugs in the UK
Mailed advertisements (number in 1 y)
nprescriptions
Becker [77] US 1970 PCPs (29), internists (3). osteopathic physicians (5)
Chloramphenicol, equagesic, vitamin B12, methylphenidate, oral contraceptives
Use of journal advertisements PSR visits (frequency)
Proportion of chloramphenicol scripts. Physicians’ self-reported prescribing behaviour.
aExperimental partnerships between pharmaceutical company and health authority or academic department. bData from pharmaceutical company.
cInformation from a market research company. dTotal number unknown.
eUsing national prescribing data.
PCP, primary care provider; RCT, randomized controlled trial. doi:10.1371/journal.pmed.1000352.t006
Table 7.
Relationship between exposure to information from drug companies and prescribing quality (by year of publication and
then study design/size).
Exposure to Information from Drug Company
Study (First Author Name)
Result in Exposed Group Versus Controls (Where Applicable)
Change in Prescribing Quality Result Effect of PSR visits de Bakker [61] Wider prescribing range was associated with more
visits from PSRs in the last 4 wk
Beta coefficient+0.18 (p,0.05)a
Muijrers [64] More frequent visits from PSRs was associated with less adherence to prescription guidelines
Multiple linear regression:
Beta20.23 (95% CI20.32 to 20.15)p,0.05
Mansfield [82] Frequency of visits from PSRs was not associated with a difference in quality score
Pearson coefficient of 0.0363; p= 0.247
Blondeel [81] Based on responses to 8 case histories: Multivariate regression analysis:
First contact with a drug from the pharmaceutical industry was not associated with quality index;
p.0.1
nPSRs received was associated with poorer quality index; p.0.05
Based on prescriptions for actual patients: First contact with a drug from the pharmaceutical industry was associated with reduced quality of prescribing;
p,0.01
nPSRs received was not associated with poorer quality index p.0.1
Becker [77] Fewer visits from PSRs/month were not associated with a change in the appropriateness of prescribing
Gamma statistic; 0.04, not statistically significant
Attendance at pharmaceutical sponsored meeting
Mansfield [82] Attendance at pharmaceutical sponsored meetings was associated with lower quality scores
Pearson correlation coefficient of 0.0635;p= 0.043
Spingarn [39] Attendees at a sponsored talk about Lyme disease were less likely to choose appropriate oral antibiotics for mild Lyme disease than nonattendees
0% of attendees (n= 22) chose appropriate antibiotics compared to 21% (n= 53) of nonattendees; Fisher exact test:p= 0.027
For attendees and nonattendees of a sponsored talk about Lyme disease there was no difference in choice of acceptable treatment for Lyme disease with central nervous system signs
OR = 3.2 (95% CI 0.8–19.2)
Attendees of a sponsored talk about Lyme disease were more likely to appropriately choose the sponsoring company’s treat-ment for Lyme disease complicated by 2nd degree heart block
OR = 7.9 (95% CI 2.4–29.3)
Journal advertisements Becker [77] Infrequent use of journal ads as a source of prescribing information by doctors was not associated with a change in the appropriateness of prescribing
Gamma statistic 0.373, not statistically significant
Total promotional invest-ment/summated scores of commercial information use/ general use of commercial sources
de Bakker [61] There was a positive correlation for how frequently doctors used the pharmaceutical industry as a source of information and the range of drugs they prescribed
Beta coefficient+0.15 (p,0.05)a
Haayer [74] Frequency of use of information from the pharmaceutical industry was associated with less rational prescribing
Beta coefficient+0.134 ;p,0.001
Information delivered without conventional promotion
Andersen [37] Participation in a randomized controlled trial was not associated with a change in guideline adherence at 2 y for trial sponsor’s medication
OR 1.00 (95% CI 0.84–1.19)
Kazmierczak [59] Mailed warning letters regarding tramadol for those with a seizure risk were not associated with a change in prescription rates for tramadol
9 (10%) prescriptions before and 7 (9%) after warning letters were sent out no association detected
Soumerai [58] PSR visits: Propoxyphene use continued a preexisting decline of about 8% a year during the time when warnings from the manufacturing pharmaceutical company were conveyed by PSRs after which time this decline halted, however a statistical association was not shown. Refill rates and rates of overdose did not change following the warnings
No association detected
Mailed Information: Propoxyphene use continued a preexisting decline of about 8% a year during the time when warnings from the manufacturing pharmaceutical company were expressed by PSRs after which time this decline halted, however a statistical association was not shown. Refill rates and rates of overdose did not change following the warnings
No association detected
aAssumes a wide prescribing range is lower quality prescribing than a narrow prescribing range.
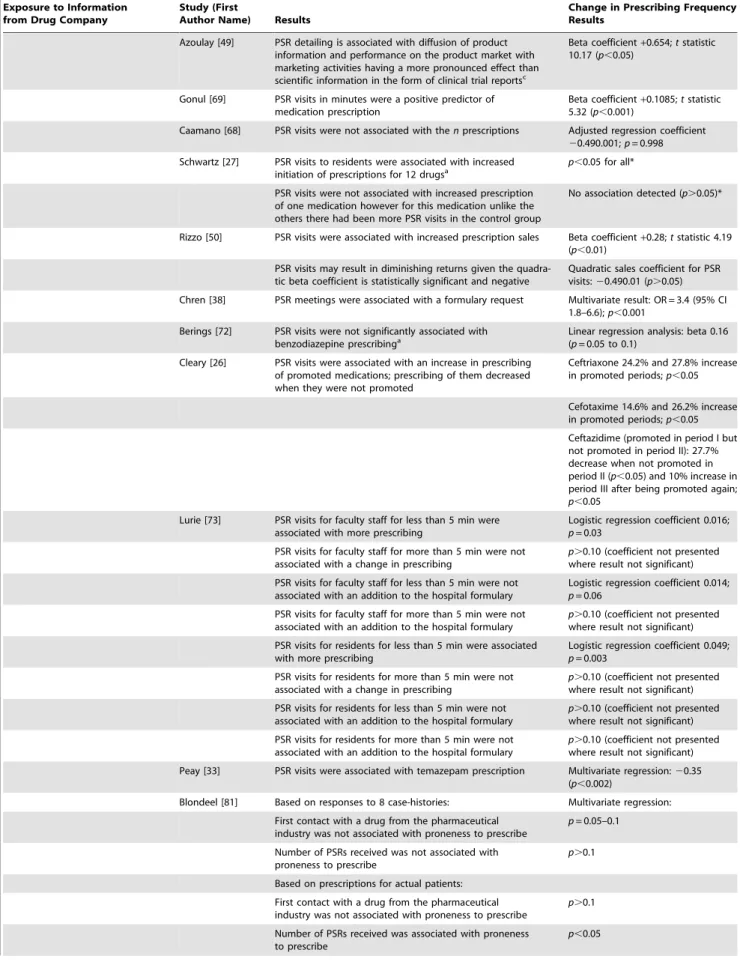
Table 8.
Relationship between exposure to information from drug companies and prescribing frequency (by year of publication
and then study design/size).
Exposure to Information from Drug Company
Study (First
Author Name) Results
Change in Prescribing Frequency Results
Effect of PSR visits Ching [78] Higher levels of detailing for enalapril/hydrochlorothiazide and lisinopril/hydrochlorothiazide was associated with higher levels of demand (prescriptions)
Detailing elasticity 0.1–0.27 (p,0.05)
Kreyenbuhl [31] Meeting PSRs.4 times in the preceding month was not associated with the ‘‘add’’ rather than ‘‘switch’’ strategy for antipsychotic medication prescribing
OR 1.22 (95% CI 0.68–2.20)
Steinman [8] PSR visits of#5 min versus.5 min were not associated with intention to prescribe
No association detected
PSR visits to doctors in a small group were associated with increase in more frequent intention to prescribea
OR 12.9 (95% CI 1.2–138.8)b
PSR visits were associated with increased gabapentin prescribing if physician’s previous gabapentin prescribing was nila
OR 15.1 (95% CI 3.9–58.2)breference
group - medium prescribers of gabapentin
PSR visits were associated with increased gabapentin prescribing if physician’s previous gabapentin prescribing was lowa
OR 8.6 (95% CI 2.4–31.4)breference
group, medium prescribers of gabapentin
Venkataraman [40] PSR visits were associated with increasednprescriptions Beta coefficient:+0.944 (significant with a 95% CI)
Canli [32] PSR visits were associated with increased antibiotic prescribinga p= 0.0001*
Chintagunta [42] Higher levels of detailing were associated with higher market share for that brand in the three of the countries studied and no significant difference in two others
Detailing related change in market share; US; beta coefficient+0.06;t statistic 3 (p,0.05); Germany; beta coefficient+0.73;tstatistic 3.6 (p,0.05); France; beta coefficient +4.17;tstatistic 7.87 (p,0.05); Italy; beta coefficient+0.24;tstatistic 0.96 (p.0.05); UK; beta coefficient+0.29;t statistic 1.61 (p.0.05)
Narayanan [43] PSR visits were associated with an increase in market share 1% increase in expenditure on detailing was associated with increases in market shares for promoted drugs ranging from 0.11% to 0.14% (p,0.05)
Verdoux [63] PSR visits were associated with general practitioners initiating a newer antipsychotic medication
OR 2.80 (95% CI 2.09–3.76);p= 0.0001
Mizik [45] PSR visits were associated with increased prescribing of Drugs A, B. and C
Drug A: 1 PSR visit generates 1.56 new prescriptions (95% CI 0.8–2.23) or 0.64 visits to induce one prescription
Drug B: 1 PSR visit generates 0.32 new prescriptions (95% CI 0.22–0.43) or 3.11 visits to induce one prescription
Drug C: 1 PSR visit generates 0.153 new prescriptions (95% CI 0.11–0.2) or 6.54 visits to induce one prescription
Donohue [44] Expenditure on PSR visits is associated with higher probability that the detailed antidepressant is prescribed
Beta coefficient+0.703 (p,0.001)
Stafford [56] Decreasing promotional expenditure was associated with a decrease in prescribing for alpha blockersc
Decreased with decreased promotion
Manchanda [46] PSR visits were associated with more new prescriptions 1.8 detailing visits results in 5 new prescriptions (average result)b
Manchanda and Chintagunta [47]
PSR visits were not associated with a significant change in mean prescriptions
Beta coefficient+0.83 detailingt statistic 0.675 (p.0.05)
More frequent PSR visits were associated with diminishing increases in prescribing
Quadratic term for PSR visits:20.49;t statistic20.49 (p.0.05)
Berndt [48] PSR detailing were associated with increased cumulative days of therapy
Beta coefficient+0.7414;tstatistic 43.12 (p,0.01)
Rosenthal [79] PSR visits were associated with increased frequency of prescription
Beta coefficient+0.017;tstatistic 4.25 (p,0.05)
Prosser [67] PSR visits were more likely to be cited as a prescribing influence by high prescribers than by low prescribers
Exposure to Information from Drug Company
Study (First
Author Name) Results
Change in Prescribing Frequency Results
Azoulay [49] PSR detailing is associated with diffusion of product information and performance on the product market with marketing activities having a more pronounced effect than scientific information in the form of clinical trial reportsc
Beta coefficient+0.654;tstatistic 10.17 (p,0.05)
Gonul [69] PSR visits in minutes were a positive predictor of medication prescription
Beta coefficient+0.1085;tstatistic 5.32 (p,0.001)
Caamano [68] PSR visits were not associated with thenprescriptions Adjusted regression coefficient 20.490.001;p= 0.998
Schwartz [27] PSR visits to residents were associated with increased
initiation of prescriptions for 12 drugsa p,0.05 for all*
PSR visits were not associated with increased prescription of one medication however for this medication unlike the others there had been more PSR visits in the control group
No association detected (p.0.05)*
Rizzo [50] PSR visits were associated with increased prescription sales Beta coefficient+0.28;tstatistic 4.19 (p,0.01)
PSR visits may result in diminishing returns given the quadra-tic beta coefficient is statisquadra-tically significant and negative
Quadratic sales coefficient for PSR visits:20.490.01 (p.0.05)
Chren [38] PSR meetings were associated with a formulary request Multivariate result: OR = 3.4 (95% CI 1.8–6.6);p,0.001
Berings [72] PSR visits were not significantly associated with benzodiazepine prescribinga
Linear regression analysis: beta 0.16 (p= 0.05 to 0.1)
Cleary [26] PSR visits were associated with an increase in prescribing of promoted medications; prescribing of them decreased when they were not promoted
Ceftriaxone 24.2% and 27.8% increase in promoted periods;p,0.05
Cefotaxime 14.6% and 26.2% increase in promoted periods;p,0.05
Ceftazidime (promoted in period I but not promoted in period II): 27.7% decrease when not promoted in period II (p,0.05) and 10% increase in period III after being promoted again; p,0.05
Lurie [73] PSR visits for faculty staff for less than 5 min were associated with more prescribing
Logistic regression coefficient 0.016; p= 0.03
PSR visits for faculty staff for more than 5 min were not associated with a change in prescribing
p.0.10 (coefficient not presented where result not significant)
PSR visits for faculty staff for less than 5 min were not associated with an addition to the hospital formulary
Logistic regression coefficient 0.014; p= 0.06
PSR visits for faculty staff for more than 5 min were not associated with an addition to the hospital formulary
p.0.10 (coefficient not presented where result not significant)
PSR visits for residents for less than 5 min were associated with more prescribing
Logistic regression coefficient 0.049; p= 0.003
PSR visits for residents for more than 5 min were not associated with a change in prescribing
p.0.10 (coefficient not presented where result not significant)
PSR visits for residents for less than 5 min were not associated with an addition to the hospital formulary
p.0.10 (coefficient not presented where result not significant)
PSR visits for residents for more than 5 min were not associated with an addition to the hospital formulary
p.0.10 (coefficient not presented where result not significant)
Peay [33] PSR visits were associated with temazepam prescription Multivariate regression:20.35 (p,0.002)
Blondeel [81] Based on responses to 8 case-histories: Multivariate regression:
First contact with a drug from the pharmaceutical industry was not associated with proneness to prescribe
p= 0.05–0.1
Number of PSRs received was not associated with proneness to prescribe
p.0.1
Based on prescriptions for actual patients:
First contact with a drug from the pharmaceutical industry was not associated with proneness to prescribe
p.0.1
Number of PSRs received was associated with proneness to prescribe