THE POSITION BUDGETS OF ADMINISTRATIVE AND TERRITORIAL
UNITS IN GENERAL CONSOLIDATED BUDGET
PH.D. assistant CHIRCULESCU MARIA FELICIA
UNIVERSITY “CONSTANTIN BRÂNCUŞI” TARGU JIU
[email protected]
Abstract
The budget is a tool of territorial administrative units of financial and budgetary policy in which the state intervenes in the economy at the local level, having a major impact on general government.Through the decentralization processes that are increasingly debated and applied, the paper a ims to highlight the importance of the territorial administrative unit budgets in the consolidated budget in Romania.Thus, the work comprises both theoretical notions concerning the presentation of the consolidated state budget and the budget of the territorial administrative units. The relevance of the work lies in the importance of general government in the regulation of macroeconomic balances by sizing or macroeconomic imbalances, with modern methods that analyze the possibilities and effects of new types of deficits or surpluses in the public sector.
Keywords: budget, administrative territorial unit
Classification JEL: H61, H72
1. Introduction
The importance of this work lies in the importance the state budget and other budgets that make up the consolidated budget of the public finances, as they participate directly in carrying out the functions and duties of the state, ensure real autonomy of local communities, guarantee the effective implementation of social protection of important categories of the population and ensure the financial stability, monetary, and exchange of state. According to the theory of public finance decisions must occur at the lowest levels of government.
Fiscal decentralization can contribute to more efficient provision of services through better matching of expenses with local priorities and preferences. The decentralized decision-making process increased the possibility of participation in local development.
Both in Romania and in any other state place state transfers to the budgets of territorial administrative units, which differ from country to country the size and purpose. The quantity and regulating the transfer depends on the distribution of responsibilities among levels of government and other sources of income of local governments.
The role and importance of the budgets of administrative-territorial in general, consolidated budget increased as decentralization processes intensified.The process of decentralization involves devolution of decision and management from the central to local level, will create at least in theory, discrepancies in the levels of development of the regions, the higher the revenue collected by the region will be and higher efficiency in use of resources will be bigger will be more developed region[3].The decentralization process will generate a competition between regions, so it is a long one involving a multitude of components political, technical, administrative and fiscal [1].
But regardless of the degree of development and/or decentralization of administrative units State budget resources are supplemented by transfers from the state budget. In this cotext complex and better achieve equilibrium occurs by the state budgets need to understand the role and importance of territorial administrative units within general government.
For the task data provided by the Finance Ministry and the National Institute of Statistics were processed in Excel and then inserted in the paper.
Through research conducted highlighted the dependence of the territorial administrative unit budgets to the general consolidated budget in the economic year that the decentralization process is highly debated and whose application aims to be as efficient as possible.
2. The general consolidated budget
The general consolidated budget reflects public financial flows of income tax and non-tax and sharing their destinations according to social needs and the objectives of financial and economic policy of the government. According to the Public finance law (Law 500 of 11 July 2002 on Public Finances), the consolidated general government budget includes the following categories: the state budget; the state social insurance budget; special funds; state treasury budget; budgets of autonomous public institutions; budgets of public institutions wholly or partly funded from the state budget, state social insurance budget and special funds, as applicable; budgets of public institutions financed from own revenues; budget funds from external loans contracted or guaranteed by the State and whose repayment, interest and other costs are covered from public funds; external grants budget [5].
The state budget in addition to the character of statistical provides the information required executive in highlighting how did the implementation of the budget for the financial year expired more contribute to the establishment by the legislature, in line with government programs to harmonize budgetary policies with economic policies corresponding to the respective steps.
According to the data from Table.no. 1, during the years 2007 to 2015 consolidated budget revenues have continued growth, their growth rate is 83.7%, in contrast to the general consolidated budget expenditures although growth was continuing, the pace was 78, 61%, which indicates that the authorities have reduced spending, despite the crisis manifested in Romania.
Table no. 1 Evolution of the general consolidated budget timeframe 2007-2015
- million lei - No. Years Total incomes Total expenses Surplus / Deficit
1. 2007 127.108,2 136.556,5 -9.448,30
2. 2008 164.466,8 189.121,7 -24.654,90
3. 2009 156.624,9 193.025,4 -36.400,50
4. 2010 168.598,45 201.903,63 -33.305,18
5. 2011 181.566,9 205.403,6 -23.836,70
6. 2012 193.148,2 207.922,1 -14.773,90
7. 2013 200.025,7 215.816,9 -15.791,20
8. 2014 213.833,6 226.326,8 -12.493,20
9. 2015 233.554,3 243.915,5 -10.361,20
Source: mfinante.ro, own processing
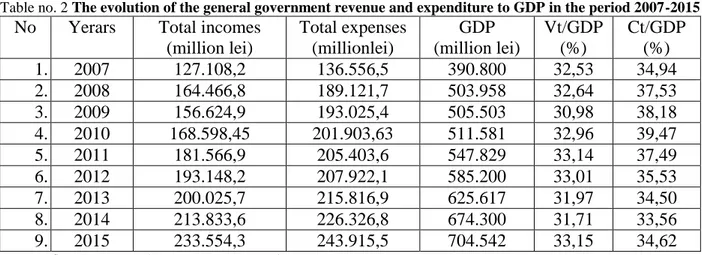
Regarding the share of revenues and expenditures on general government debt to GDP (Table no. 2) it is noted that the revenues of the general government outfit occupied the interval from 2007 to 2015 on average 32.45% of GDP, while expenditures general consolidated budget in the same time interval occupied 36.20% of GDP. Values above-average general government revenues to GDP were recorded in 2007 (32.53%) 2008 (32.64%) 2010 (32.96%) 2011 (33.14%) 2012 (33, 01%) and 2015 (33.15%). Regarding the general government expenditure ratio to GDP, above the average of 36.20%, were recorded value in 2008 (37.53%) 2009 (38.18%) 2010 (39.47%) and 2011 (37.49%).
Table no. 2 The evolution of the general government revenue and expenditure to GDP in the period 2007-2015
No
Yerars
Total incomes
(million lei)
Total expenses
(millionlei)
GDP
(million lei)
Vt/GDP
(%)
Ct/GDP
(%)
1.
2007
127.108,2
136.556,5
390.800
32,53
34,94
2.
2008
164.466,8
189.121,7
503.958
32,64
37,53
3.
2009
156.624,9
193.025,4
505.503
30,98
38,18
4.
2010
168.598,45
201.903,63
511.581
32,96
39,47
5.
2011
181.566,9
205.403,6
547.829
33,14
37,49
6.
2012
193.148,2
207.922,1
585.200
33,01
35,53
7.
2013
200.025,7
215.816,9
625.617
31,97
34,50
8.
2014
213.833,6
226.326,8
674.300
31,71
33,56
9.
2015
233.554,3
243.915,5
704.542
33,15
34,62
Source: mfinante.ro,www.insse.ro, own processing
Analysis of revenues and expenditures of administrative territorial units
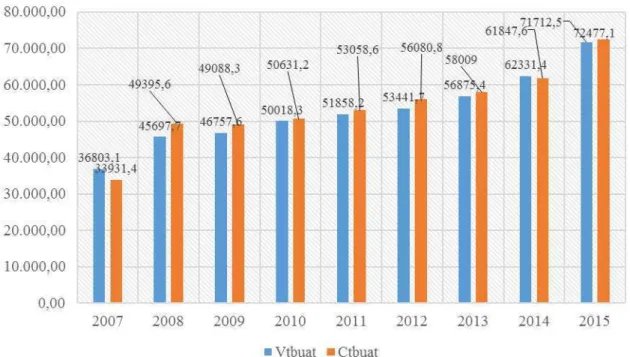
From the data presented in Table. no. 3 and Fig. 3 notes that the timeframe analyzed, only the 2007 and 2014 budgets of centralized administrative units ended the year with surplus and in other years he was in deficit. In the case of the income average growth rate of 8.90% was instead spending the average growth rate was 10.72%, but recorded a decrease in 2009 compared to 2008.
Table no. 3 Evolution centralized revenue and expenditure budgets of administrative-territorial units - million lei- Nr. crt. Yerars Total incomes Total expenses Surplus / Deficit
1. 2007 36.803,1 33.931,4 2.871,70
2. 2008 45.697,7 49.395,6 -3.697,90
3. 2009 46.757,6 49.088,3 -2.330,70
4. 2010 50.018,3 50.631,2 -612,90
5. 2011 51.858,2 53.058,6 -1.200,40
6. 2012 53.441,7 56.080,8 -2.639,10
7. 2013 56.875,4 58.009,0 -1.133,60
8. 2014 62.331,4 61.847,6 483,80
9. 2015 71.712,5 72.477,1 -764,60
Source: mfinance.ro
Fig. 3 Dynamics centralized revenue and expenditure budgets of administrative units
3. Analysis of revenues and expenditures of the central administrative units
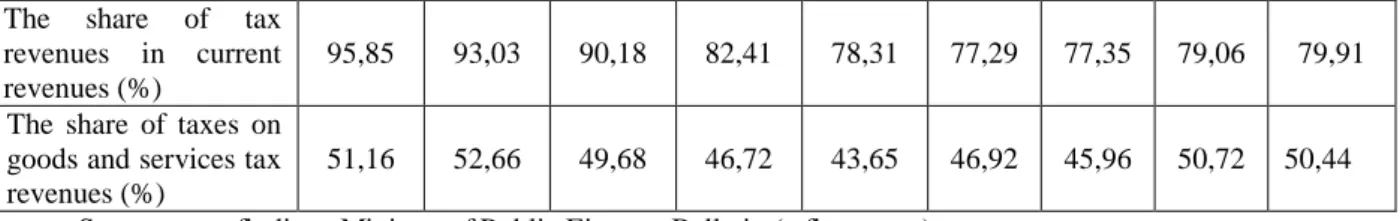
During 2007-2015 there has been a continuous decline in the share of total income tax revenues in the current budget level centralized administrative territorial units, ie from 95.85% in 2007 to 79.91% in 2015. This decrease of almost 16% indicate an orientation territorial administrative units by development programs, whose implementation requires a longer time period compared with Section Current operating budgets of territorial administrative units. In 2010 it recorded the largest fall in the share of tax revenues to the budget of territorial administrative units in the same budget current revenues that dropped by 7.77% compared to 2009. In the period 2010-2015 the decrease in current income tax revenue ratio was 2.5%, so that in 2015 almost 80% of current income tax revenues of the budgets of territorial administrative units.
Table no. 4 The structure of tax revenues from the central budget of the territorial administrative units
Yerars Indicators
2007 2008 2009 2010 2011 2012 2013 2014 2015
The share of tax revenues in current revenues (%)
95,85 93,03 90,18 82,41 78,31 77,29 77,35 79,06 79,91
The share of taxes on goods and services tax revenues (%)
51,16 52,66 49,68 46,72 43,65 46,92 45,96 50,72 50,44
Source: own findings Ministry of Public Finance Bulletin (mfinante.ro)
Regarding the share of taxes on goods and services in the total tax revenue from table. 3 notes that in the first year of the period under review they have reached a level of 51.16% in total tax revenues. Fluctuations in taxes on goods and services tax revenues were low, meaning that if anu 2007 this share was 51.16% in 2015 this indicator was 50.44%.
4. Budget position of administrative territorial units within general government
Centralized budgets to assess the position of the territorial administrative units within general government level weights have determined that you have income and expenditure budgets of territorial administrative units in total consolidated budgets. In fig. 4 the weights central budget revenues of the administrative territorial general government revenue.
In terms of share of budget expenditures in the budgets of the territorial administrative units consolidated the timeframe 2007-2015, the highest rate was recorded throughout 2015, 29.71% and the lowest was recorded in 2007 of 24.85%.
Looking at the average share centralized structure of the administrative territorial budgets in the consolidated budget structure that stands at income levels above the average values of 28.97% recorded values were recorded in the years 2007, 2009, 2010, 2014 and 2015, and at the expense above the average of 26.46%, values were recorded in the years 2012, 2013, 2014 and 2015. The importance of centralized budgets of territorial administrative units within general government stands and the income rate from 28.95% in 2007 to 30.7% in 2015, and expenses, from 24.85% in 2007 to 39.71% in 2015. It notes that the increasing share of budget revenues centralized administrative units was surpassed by increasing the share of expenditure, without this necessarily mean a higher degree of dependence of local authorities to the central government.
In fig. 4 the changes from year to year expenditures of the administrative budgets of central or general government. It is noted that developments in the two categories were not so different, except for the time period 2006-2007 when it registered the biggest difference of 7.08 percentage points. This time the total expenditure budgets centralized administrative units increased by 45.57% compared to the general consolidated budget expenditures increased by only 38.49%.
5. Conclusions
Budgets of administrative and territorial planning tools is driving their economic and financial activity. Budgets of administrative territorial structure reflects the degree of autonomy of local governments to the central government and the links between the various territorial administrations. Also, local budgets revenue and expenditure flows, reflect local administration, the financing of expenses on destinations and cover budget deficits.
Territorial administrative units play an important role in public finances, being able to provide a basis for democratic market systems have a greater chance success. The important role they play budget of the administrative territorial consolidated budget is justified by the fact that they occupy a constant position, which states try to maintain balanced, regardless of periods which are crossed, but it depends on the level of decentralization countries. Practice shows that the more a country is decentralized, the role of local budgets is more important. The important role they play budget of the administrative territorial consolidated budget is justified by the fact that they occupy a constant position, which states try to maintain balanced, regardless of periods which are crossed, but it depends on the level of decentralization countries. Practice shows that the more a country is decentralized, the role of local budgets is more important.
6. Bibliography
[1]. Andronic Maria Letiţia –“Features of the Regional Development and Decentralization in Romania. A Comparative Analysis of the Regions of Romania”-http://stec.univ-ovidius.ro/html/annals/ENG/ summary %20 contents / volume 2012p1.pdf, page. 304
[2]. Dobrotă G., The policy and the trade regime in Romania after 1990, Annals UCB Economy Series, no. 2, 2009, p. 57-70
[3]. György Attila şi György Adina Cristina–“Optimizing local budget balancing in Romania” -http://annals.steconomiceuoradea.ro/volume/2011/n1/030.pdf
[4]. Law 273 of 29 June 2006 on Local Public Finances [5]. Law 500 of 11 July 2002 on Public Finances
[8]. Popeangă Vasile, Dobrotă Gabriela, Popeangă Vasile Nicolae, Public Finances: theoretical and practical guide, Economic studies Publisher, Târgu Jiu, 2002
[9]. Stoica E. C. and company, Budget and Public Treasury, University Publishing, Bucharest, 2009 [10]. Văcărel I. eds., Public Finance Edition VI, Didactic and Pedagogical Publishing, Bucharest, 2007 [11]. www.insse.ro