PANOECONOMICUS, 2014, 4, pp. 487-501
Received: 25 November 2012; Accepted: 14 August 2013.
UDC 336.22 (560) DOI: 10.2298/PAN1404487T Original scientific paper
Taner Turan
Department of International Trade and Finance,
Adana Science and Technology University,
Turkey
Mesut Karakas
Department of Economics, Gebze Institute of Technology, Turkey
Halit Yanikkaya
Department of Economics, Gebze Institute of Technology, Turkey
Tax Smoothing Hypothesis:
A Turkish Case
Summary: We tested the tax smoothing hypothesis for Turkey using annual data for the period of 1949-2010. Although our preliminary estimation results imply the existence of the weak form of tax smoothing for Turkey, further tests indicate the violation of exogeneity of permanent government spending, which is a requirement for the tax smoothing hypothesis to hold. Our causality tests indicate that permanent government spending is not exogenous due to the causality running from lagged tax rates to permanent government spending. Therefore, we conclude that our results provide evidence against the tax smoothing hypothesis. Our results are important because the existence of random-walk behavior of the tax rates alone or some preliminary regressions do not guarantee the existence of tax smoothing.
Key words: Tax smoothing hypothesis, Random walk, Co-integration, Beveridge-Nelson decomposition, Kalman filter.
JEL: E62, H21, C32.
The concept of tax smoothing suggested in a seminal article by Robert J. Barro (1979) and extended to more general settings by Robert E. Lucas Jr. and Nancy L. Stokey (1983) has become one of the most important concepts with substantial policy implications in public finance. Tax smoothing is especially important in developing countries with relatively scarce resources. Implementation of certain policies to smooth taxes avoids excessive deadweight losses on the shoulders of taxpayers. Therefore, policy makers could achieve a more efficient allocation of resources and promote growth in a better, and most importantly, in a healthier way. As mentioned by Philip Arestis (2011) and Michael Bergman (2011), the quality of fiscal policy is especially important for countries that are in turbulent times. An efficient taxation behavior in good times can be a lifesaver when times are troublesome. Moreover, the latest global financial crisis triggered the need to re-focus on the fiscal side of the economy due to the fact that monetary policy is insufficient to combat economic re-cession. Thus, the issue of taxation and fiscal policy practices in both developed and developing countries become even more crucial. Recently, several studies such as Guglielmo D’Amico, Giuseppe Di Biase, and Raimondo Manca (2013), Jesús Ferrei-ro, Carmen Gómez, and Felipe Serrano (2013), and Jérôme Creel, Paul Hubert, and Francesco Saraceno (2014) investigated different aspects of fiscal policy.
ex-488 Taner Turan, Mesut Karakas and Halit Yanikkaya
pected, distortions and burdens due to taxation rise disproportionately with tax rates. Governments, therefore, can curtail tax distortions through smoothing of tax rates rather than adjusting them based on the budget requirements. Thus, the idea of tax smoothing implies that budget deficits or surpluses can be used to keep tax rates rela-tively stable. At this point, the availability and use of debt instruments plays a crucial role to smooth taxes and shape taxation policies. In addition, unlike temporary changes, governments should adjust tax rates in response to permanent increases in government spending. According to the tax smoothing hypothesis, tax rates should only be changed in the case of unpredicted shocks and, thus, predictable changes cannot occur in the tax rates.
In this paper, we tested the tax smoothing hypothesis for Turkey by applying more direct methods for the first time. Our focus is on the existence of tax smooth-ing, which is shown to hold seemingly in our initial analysis for the Turkish case. However, more in-depth analysis clarifies the results. Our results are important be-cause like other developing economies with relatively insufficient resources, Turkey has no luxury to trifle away its resources by inappropriate taxation policies. Thus, we believe that our results will lead policy makers to take corrective actions.
The next section of the paper presents literature survey. Section 2 outlays the empirical methodology and Section 3 presents empirical results. The last section concludes the paper with some policy implications.
1. Literature Review
theoreti-489 Tax Smoothing Hypothesis: A Turkish Case
cal framework in Ghosh (1995) and utilized vector autoregression on a Swedish data-set. Adler (2006) found empirical results that both support tax smoothing in Sweden and explained about 60% of variability in Swedish central government surpluses.
Recently, Gerhard Reitschuler (2010) tested the tax smoothing hypothesis for the 15 EU-member countries by means of vector autoregression. The basic estima-tion results of Reitschuler (2010) supported the hypothesis for Germany, Greece, the Netherlands, and Portugal. On the other hand, his more complicated estimation re-sults pointed out that the tax smoothing hypothesis holds only for the cases of Ger-many and the Netherlands before the Maastricht fiscal rule, but it is rejected for all countries in the dataset after the Maastricht fiscal rule takes effect. In another study, Reitschuler (2011) investigated the existence of tax smoothing for the new member states of the EU. In this study, the hypothesis was found to be valid for the Czech Republic, Hungary, Lithuania, Poland, and Romania and it was also shown that the tax smoothing behavior of these countries was not affected by the Maastricht fiscal rule. In another recent study, Ananda Jayawickrama and Tilak Abeysinghe (2013) used a direct method to test the existence of tax smoothing for Australia, Canada, Italy, Japan, the Netherlands, New Zealand, the US and the UK. They also classified the forms of tax smoothing into “no tax smoothing”, “weak form”, and “strong form” for these countries. Their results are in favor of the weak form of tax smoothing for all countries they analyzed.
There are also many studies reporting the contradictory results on the exis-tence of tax smoothing for developed countries. Chaipat Sahasakul (1986) used the US data for the period of 1937-1982 and showed that tax rates respond not only to permanent increases in government spending but they also respond to temporary de-fense purchases, general price level, and a time trend. These results invalidate the tax smoothing hypothesis for the said period. Bharat Trehan and Carl E. Walsh (1988) used co-integration among government expenditures inclusive of interest, tax re-ceipts, and seignorage for the US data covering the period between 1890 and 1986. They found that even though intertemporal budget balance exists, the tax smoothing hypothesis does not hold. Henning Bohn (1990) showed that tax smoothing cannot be rejected on the basis of time path of taxes for post-war US data. However, the re-sults of this study pointed out that tax smoothing can be rejected by means of an ex-tensive analysis that includes the fact that some security returns are correlated with tax rates. Chao-Hsi Huang and Kenneth S. Lin (1993) examined the relationship be-tween budget deficit and growth rates of national income and government expendi-ture and they applied vector autoregression to the US data covering the period of 1929-1988. They rejected the tax smoothing hypothesis for the full period. However, contradictory to the results on the full period, they failed to reject the existence of tax smoothing after 1947. Nilss Olekalns (1997) tested the tax smoothing hypothesis for the case of Australia using a dataset that covered between 1964 and 1995. Olekalns (1997) presented results against tax smoothing because the Australian fiscal policy was too volatile. Recently, Reitschuler (2011) rejected the tax smoothing hypothesis for Bulgaria, Cyprus, Estonia, Latvia, Malta, Slovak Republic and Slovenia.
490 Taner Turan, Mesut Karakas and Halit Yanikkaya
Paul Cashin, Olekalns, and Ratna Sahay (1998) tested Barro’s tax smoothing model on India for the period between 1951 and 1997 and showed that the tax smoothing hypothesis holds for central government, but this was not the case for regional gov-ernments. Cashin, Nadeem Haque, and Olekalns (1999) applied unit-root tests on a dataset for Pakistan which covered between 1956 and 1995. The results support the existence of tax smoothing in Pakistan. Recently, Rudi Kurniawan (2011) used a vec-tor auvec-toregression methodology on a dataset between 1969 and 2008 for Indonesia. The results of this study lent support for tax smoothing in Indonesian economy. In another recent work, Roberto Pasten and James P. Cover (2011) also utilized vector autoregression on Chilean dataset for the period between 1973 and 2002. They pro-vided strong evidence for the existence of tax smoothing when royalty revenues of the government from the mining sector are assumed not totally controlled by the ad-ministration.
There are even fewer studies providing evidence against the tax smoothing hypothesis in developing countries. Cashin, Haque, and Olekalns (1999) used unit-root test on a dataset covering between 1964 and 1997 for Sri Lanka. Their results showed that Sri Lanka’s fiscal behavior was not in line with the idea of tax smooth-ing. Fabiana Rocha (2001) applied vector autoregression to Brazilian data for the period between 1970 and 1994. His results lent evidence on the rejection of the tax smoothing hypothesis for the full sample. Recently, Mesut Karakas, Taner Turan, and Halit Yanikkaya (2014), using Turkish data with VAR estimation method, re-ported that although the results of preliminary analyses lent evidence in favor of the hypothesis, further in-depth econometric analysis failed to support the existence of tax smoothing.
491 Tax Smoothing Hypothesis: A Turkish Case
2. Methodology and Data
Jayawickrama and Abeysinghe (2013) tested the existence of tax smoothing hypothe-sis and its forms (weak or strong) via four main equations using average tax rate (calculated as total tax revenue to GDP ratio) and government-spending rate ( ) (calculated as government spending to GDP ratio). They first decomposed govern-ment-spending rates by means of Kalman (KF) and Beveridge-Nelson (BN) filters into two parts: permanent government-spending rate ( ) and transitory government-spending rate ( ). Afterwards as in almost all works related to tax smoothing, the random-walk behavior of tax rate is determined by an ADF (Augmented Dickey-Fuller) test:
∆ = + + Δ + Δ + . (1)
As tax rate is assumed to have a Martingale property, the unit-root component of government-spending rate (permanent government-spending rate) can be extracted and used in the co-integration test between tax rate and permanent government-spending rate:
= (Beveridge-Nelson filtered series), or
= (Kalman filtered series).
(2)
The existence of tax smoothing and its form are also checked directly by means of an error correction model (ECM) as in below:
∆ = + + + + + − + . (3)
Where mt is the growth rate of M1 definition of money supply and ut is the un-employment rate.
If α1 = 0, then the tax smoothing hypothesis does not hold. If -1 < α1 < 0, the weak form of tax smoothing hypothesis holds. When α1 = -1, the strong form of tax smoothing holds. In the case where the tax smoothing hypothesis is satisfied, λ1 gen-erally equals to 0.
Lastly, checking for causality is needed. Permanent government-spending rate is assumed exogenous, but there can be spurious or true feedback effects. To deter-mine such a problem, we run the regression in Equation (4):
∆ = + + + + + Δ + − + . (4)
492 Taner Turan, Mesut Karakas and Halit Yanikkaya
3. Empirical Results
Our study examined both the existence and the form of tax smoothing for Turkey within the period of 1949-2010. Data on government expenditures and tax revenues came from the Turkish Ministry of Finance; data on M1 (money supply) were from the Turkish Statistical Institute; and data on unemployment were from Tuncer Bulu-tay (1995) until 1980, and afterwards, from the Turkish Ministry of Development. We also obtained data on GDP from the Ministry of Development to calculate tax and spending shares in GDP. The tax rate and actual government-spending rate are depicted in Figure 1. Both series seem to follow a form of random walk.
Source: Authors.
Figure 1 Tax and Government-Spending Rates (% on Vertical Axis)
Table 1 Test for a Random Walk in Tax Rates
Dependent
variable Constant τt-1 Δτt-1 Δτt-2 AR(2) F ARCH(2) F
Δτ 0.61 -0.02 -0.07 -0.01 0.18 0.24
(1.14) (-0.68) (-0.55) (-0.10) [0.83] [0.78]
Notes: The coefficient t-values are in parentheses and diagnostic p-values are in square brackets. The critical value for ADF test under the null of a driftless walk at the 5% level is -2.92.
Source: Authors’ estimations.
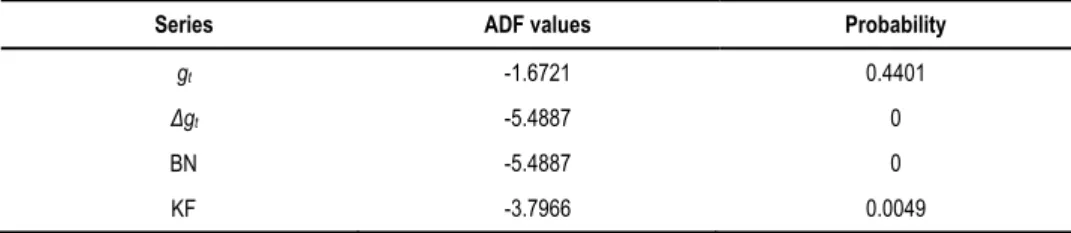
Table 2 ADF Test for a Unit-Root in Government Expenditure Rates
Series ADF values Probability
gt -1.6721 0.4401
Δgt -5.4887 0
BN -5.4887 0
KF -3.7966 0.0049
Source: Authors’ estimations.
0 10 20 30 40 50
1950 1960 1970 1980 1990 2000 2010
A c t u al G o vern m e nt S p e n din g R at e Ta x R at e
-493 Tax Smoothing Hypothesis: A Turkish Case
Actual government-spending rates and filtered government-spending rates are given in Figure 2. Actual government-spending rate and the Beveridge-Nelson unit-root smooth series of government-spending rate show close correspondence, but the Kalman smooth series of government-spending rate diverges from these series during the economic crises at the late 1980s and 1990s. Nevertheless, it can be easily ob-served that fluctuations in government-spending rates stem from the long-term shifts in government-spending rates.
Source: Authors.
Figure 2 Actual, BN Unit-Root, and Kalman Smooth Series of Expenditure Rates
(% on Vertical Axis)
The co-integration results based on Equation (2) between tax rates and perma-nent government expenditure rates for BN and KF series are given in Table 3. The residual-based ADF tests and KPSS test support the integration. The degree of co-integration measured by Rho is not very strong but permissible. Most interestingly, β coefficients estimated from BN and KF series are very similar. AR and ARCH tests show autocorrelation and heteroscedasticity, but these do not create problems except in the case of strong tax smoothing hypothesis.
494 Taner Turan, Mesut Karakas and Halit Yanikkaya
Table 3 Test for Co-Integration between Tax Rate and Permanent Expenditure Rate
(Dependent Variable: )
− −
Coefficient 0.6282 0.6979
t-value 48.999 53.6051
ADF t of residuals -2.9863*** -2.0593**
KPSS LM 0.142 0.1719
Rho 0.5024 0.7797
AR(2) F-test 14.9983*** 45.1577***
ARCH(2) F-test 8.6757*** 13.9142***
Notes: ADF regression includes one lag and no intercept. Asymptotic critical value for KPSS test at the 5% level is 0.463. *, **, *** denotes significance at 10%, 5%, 1% levels, respectively.
Source: Authors’ estimations.
Table 4 Further Tests on Tax Smoothing (Dependent Variable: Δτt)
Explanatory variable BN filter t-values K filter t-values
Constant 0.9271* 1.7398 0.8919 1.5034
-1.0285*** -3.8759 0.1657* 1.7445
0.0022 0.2168 0.0054 0.4802
0.427*** 2.997 0.3895** 2.4308
: -0.3411*** -2.9354 -0.3191** -2.4960
− : -0.4955*** -2.7507 -0.4546** -2.2111
Diagnostic p-values Diagnostic p-values
R square 0.2709 0.1169
AR(2) F-test 2.17 0.1244 0.1976 0.8213
ARCH(2) F-test 0.2796 0.7571 0.032 0.9685
Normality chi-square (2) 5.6226 0.0601 20.6425 0
Hetero F-test 1.1423 0.3507 2.0513 0.0859
Reset F-test 2.9095 0.0634 0.8468 0.4346
Note: *, **, *** denotes significance at 10%, 5%, 1% levels, respectively.
Source: Authors’ estimations.
495 Tax Smoothing Hypothesis: A Turkish Case
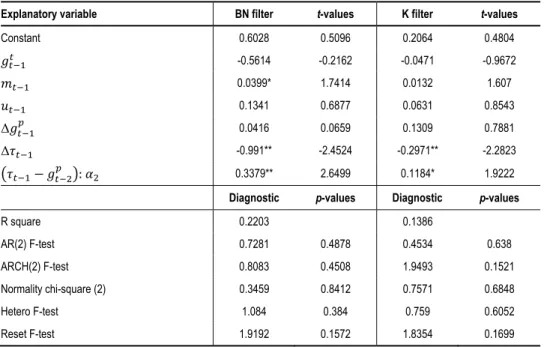
Although our analyses so far provide significant evidence for the weak form of tax smoothing, the exogeneity of permanent government expenditures is a crucial issue for the Turkish case. We performed a causality test as in Equation (4); the test results are in Table 5. The estimated coefficients on independent variables are insig-nificant except for M1 and they have similar signs. Generally, we expect all variables to be insignificant for the exogeneity of permanent government spending. Most im-portantly, as α2 is statistically significant and positive, it gives rise to true positive feedback effects in our case. Thus, based on our preliminary results as similar to most of the related literature, the tax smoothing hypothesis initially seems to hold for Turkey; however, it does not stand when scrutinized closely.
Table 5 Causality Tests (Dependent Variable:∆ )
Explanatory variable BN filter t-values K filter t-values
Constant 0.6028 0.5096 0.2064 0.4804
-0.5614 -0.2162 -0.0471 -0.9672
0.0399* 1.7414 0.0132 1.607
0.1341 0.6877 0.0631 0.8543
Δ 0.0416 0.0659 0.1309 0.7881
Δ -0.991** -2.4524 -0.2971** -2.2823
− : 0.3379** 2.6499 0.1184* 1.9222
Diagnostic p-values Diagnostic p-values
R square 0.2203 0.1386
AR(2) F-test 0.7281 0.4878 0.4534 0.638
ARCH(2) F-test 0.8083 0.4508 1.9493 0.1521
Normality chi-square (2) 0.3459 0.8412 0.7571 0.6848
Hetero F-test 1.084 0.384 0.759 0.6052
Reset F-test 1.9192 0.1572 1.8354 0.1699
Note: *, **, *** denotes significance at 10%, 5%, 1% levels, respectively.
Source: Authors’ estimations.
Similar to the many studies undertaken in the tax smoothing literature, the pe-riod of 1949-2010 is quite long and there can be structural breaks that may affect the results of our analyses1. To cope with this, Bai-Perron multiple structural break tests were applied to Equation (2). The results of sequentially determined structural break tests for co-integration equation with BN filtered series are given in Table 6. The Bai-Perron tests determined only one structural break date for the co-integration equ-ation in 1979, the year when there was an oil crisis.
1
496 Taner Turan, Mesut Karakas and Halit Yanikkaya
Table 6 Structural Break Tests for Equation (2) (BN Filtered Series)
Break test F-statistic Critical value
0 break versus 1 break 12.6328 8.58
1 break versus 2 breaks 3.1903 10.13
Chosen number of breaks: 1 Break date: 1979
Note: Critical values are based on significance at 5% level.
Source: Authors’ estimations.
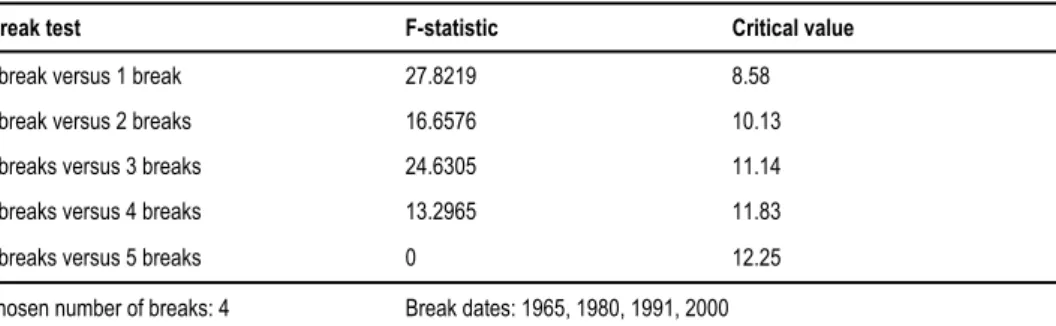
Table 7 presents the results of Bai-Perron multiple structural break tests for co-integration equation with Kalman filtered series. There were four structural breaks at 1965, 1980, 1991, and 2000. These structural break dates correspond mainly to domestic economic crises except for 1980. In addition, the 1979-1980 oil crisis was captured as a structural break date for the co-integration equation with Kalman smooth series.
Table 7 Structural Break Tests for Equation (2) (Kalman Filtered Series)
Break test F-statistic Critical value
0 break versus 1 break 27.8219 8.58
1 break versus 2 breaks 16.6576 10.13
2 breaks versus 3 breaks 24.6305 11.14
3 breaks versus 4 breaks 13.2965 11.83
4 breaks versus 5 breaks 0 12.25
Chosen number of breaks: 4 Break dates: 1965, 1980, 1991, 2000
Notes: Critical values are based on significance at 5% level.
Source: Authors’ estimations.
Note that we have only one structural break when we employed the Beve-ridge-Nelson unit-root smoothed series. Figure 2 shows actual government-spending rate and the Beveridge-Nelson unit-root smooth series of government-spending rate show close correspondence. On the other hand, the Kalman smooth series of gov-ernment-spending rate shows divergent behavior at times of economic crises in the late 1980s and 1990s. In such a case, it is proper to expect less structural breaks for an equation with the Beveridge-Nelson unit-root smooth series.
497 Tax Smoothing Hypothesis: A Turkish Case
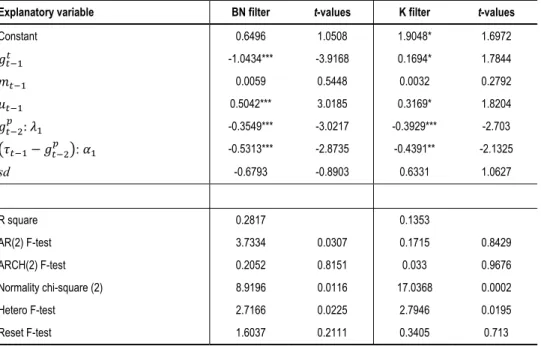
Table 8 Further Tests on Tax Smoothing with sd (Dependent Variable:Δτt)
Explanatory variable BN filter t-values K filter t-values
Constant 0.6496 1.0508 1.9048* 1.6972
-1.0434*** -3.9168 0.1694* 1.7844
0.0059 0.5448 0.0032 0.2792
0.5042*** 3.0185 0.3169* 1.8204
: -0.3549*** -3.0217 -0.3929*** -2.703
− : -0.5313*** -2.8735 -0.4391** -2.1325
sd -0.6793 -0.8903 0.6331 1.0627
R square 0.2817 0.1353
AR(2) F-test 3.7334 0.0307 0.1715 0.8429
ARCH(2) F-test 0.2052 0.8151 0.033 0.9676
Normality chi-square (2) 8.9196 0.0116 17.0368 0.0002
Hetero F-test 2.7166 0.0225 2.7946 0.0195
Reset F-test 1.6037 0.2111 0.3405 0.713
Note: *, **, *** denotes significance at 10%, 5%, 1% levels, respectively.
Source: Authors’ estimations.
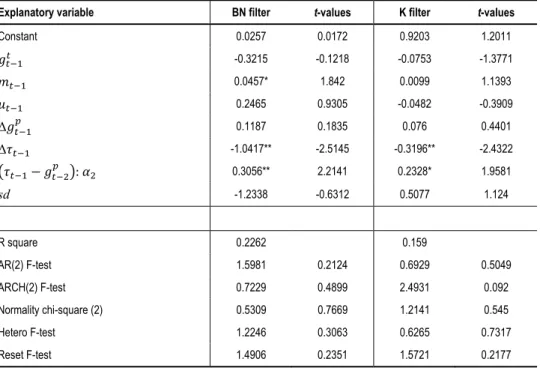
To test the exogeneity of permanent government expenditure within the struc-tural-breaks context, we performed the causality test with structural break dummies as in Equation (4). The test results are reported in Table 9. The coefficients on struc-tural dummy variables are not significant for the cases of BN and Kalman filtered series. Coefficients on the other variables are very similar compared with previous results in Table 5. Causality tests with structural dummies also support the existence of true positive feedback effects because α2 is statistically significant and positive.
Overall, our results with structural breaks indicate that even though structural breaks exist in the time period we considered, estimation results with structural breaks do not alter our main results in any significant way.
possi-498 Taner Turan, Mesut Karakas and Halit Yanikkaya
ble reason. Rocha (2001) suggested that political economy factors would better ex-plain the observed deviations from tax smoothing. One can persuasively argue that because a well-functioning public finance system and effective institutional structure can result in implementing tax smoothing easier, tax smoothing is thus expected to be achieved in developed countries rather than in developing ones. However, empirical studies show that there is evidence both for and against tax smoothing in both devel-oping and developed countries. Therefore, we may conclude that empirical results do not lend any conclusive evidence on the proposition that compared with developing countries; developed countries are more successful in achieving tax smoothing.
Table 9 Causality Tests with sd (Dependent Variable: ∆ )
Explanatory variable BN filter t-values K filter t-values
Constant 0.0257 0.0172 0.9203 1.2011
-0.3215 -0.1218 -0.0753 -1.3771
0.0457* 1.842 0.0099 1.1393
0.2465 0.9305 -0.0482 -0.3909
Δ 0.1187 0.1835 0.076 0.4401
Δ -1.0417** -2.5145 -0.3196** -2.4322
− : 0.3056** 2.2141 0.2328* 1.9581
sd -1.2338 -0.6312 0.5077 1.124
R square 0.2262 0.159
AR(2) F-test 1.5981 0.2124 0.6929 0.5049
ARCH(2) F-test 0.7229 0.4899 2.4931 0.092
Normality chi-square (2) 0.5309 0.7669 1.2141 0.545
Hetero F-test 1.2246 0.3063 0.6265 0.7317
Reset F-test 1.4906 0.2351 1.5721 0.2177
Notes: *, **, *** denotes significance at 10%, 5%, 1% levels, respectively.
Source: Authors’ estimations.
4. Conclusion
random-499 Tax Smoothing Hypothesis: A Turkish Case
walk behavior of the tax rate alone or some preliminary regressions do not guarantee tax smoothing.
Whether or not a country achieves tax smoothing has significant fiscal policy implications. If implemented appropriately, fiscal policies consistent with the tax smoothing idea can avoid potential welfare losses for the overall public by minimiz-ing deadweight losses stemmminimiz-ing from erratic changes in tax rates. Most importantly, given that they have relatively fewer resources; developing countries do not have the luxury to waste their resources due to the suboptimal taxation policies. Because tax smoothing has different policy implications depending on whether a change in gov-ernment spending is permanent or temporary, govgov-ernments should be more focused on making a distinction regarding this issue. In practice, however, making a distinc-tion between permanent and temporary government spending would be challenging but not impossible. For example, a priori, governments can classify government-spending items while preparing or drafting next year’s budget proposal. It may then be easier for policymakers to differentiate between permanent and temporary parts of government spending.
Therefore, in the case of temporary change in spending, it should be dealt mainly with public borrowing. For example, after the massive earthquake occurred in 1999 in Turkey, which is temporary in nature, the Turkish government introduced some new or additional taxes to finance extra government spending. The Turkish government should have financed the additional spending with budget deficits to comply with tax smoothing. Taxpayers in most developing countries such as Turkey suffer from the distortionary effects of sporadic changes in tax rates. To mitigate such effects, changes in tax rates should also be implemented in accordance with the changes in permanent government spending.
500 Taner Turan, Mesut Karakas and Halit Yanikkaya
References
Adler, Johan. 2006. “The Tax-Smoothing Hypothesis: Evidence from Sweden, 1952-1999.”
Scandinavian Journal of Economics, 108(1): 81-95.
Arestis, Philip. 2011. “Fiscal Policy Is Still an Effective Instrument of Macroeconomic
Policy.” Panoeconomicus, 58(2): 143-156.
Barro, Robert J. 1979. “On the Determination of the Public Debt.” Journal of Political Economy, 87(5): 940-971.
Barro, Robert J. 1981. “On the Predictability of Tax-Rate Changes.” National Bureau of Economic Research Working Paper 636.
Bergman, Michael. 2011. “Best in Class: Public Finances in Sweden during the Financial
Crises.” Panoeconomicus, 58(4): 431-453.
Bohn, Henning. 1990. “Tax Smoothing with Financial Instruments.” American Economic Review, 80(5): 1217-1230.
Bulutay, Tuncer. 1995. Employment, Unemployment and Wages in Turkey. Ankara: International Labour Organization.
Cashin, Paul, Nilss Olekalns, and Ratna Sahay. 1998. “Tax Smoothing in a Financially Repressed Economy: Evidence from India.” International Monetary Fund Working Paper WP/98/122.
Cashin, Paul, Nadeem Haque, and Nilss Olekalns. 1999. “Spend Now, Pay Later? Tax Smoothing and Fiscal Sustainability in South Asia.” International Monetary Fund Working Paper WP/99/63.
Creel,Jérôme, Paul Hubert, and Francesco Saraceno. 2014. “French Public Finances at
Risk?” Panoeconomicus, 61(Special Issue): 1-19.
D’Amico, Guglielmo, Giuseppe Di Biase, and Raimondo Manca. 2013. “Effects on Taxation on the Forecasting of Income Inequality: Evidence from Germany, Greece,
and Italy.” Panoeconomicus, 60(6): 707-723.
Ferreiro, Jesús, Carmen Gómez, and Felipe Serrano. 2013. “Mistakes in the Fiscal Policy
in Spain before the Crisis.” Panoeconomicus, 60(5): 577-592.
Ghosh, Atish R. 1995. “Intertemporal Tax Smoothing and Government Budget Surplus:
Canada and the United States.” Journal of Money, Credit and Banking, 27(4):
1033-1045.
Huang, Chao-Hsi, and Kenneth S. Lin. 1993. “Deficits, Government Expenditures, and Tax
Smoothing in the United States: 1929-1988.” Journal of Monetary Economics, 31(3):
317-339.
Jayawickrama, Ananda, and Tilak Abeysinghe. 2013. “The Experience of Some OECD
Economies on Tax Smoothing.” Applied Economics, 45(16): 2305-2313.
Karakas, Mesut, Taner Turan, and Halit Yanikkaya. 2014. “A Brief Analysis of the Tax
Smoothing Hypothesis in Turkey.” Transylvanian Review of Administrative Sciences,
42: 78-93.
Kurniawan, Rudi. 2011. “Tax Smoothing: Tests on Indonesian Data.” International Journal of Economics and Finance Studies, 3(1): 187-197.
Lucas Jr., Robert E., and Nancy L. Stokey. 1983. “Optimal Fiscal and Monetary Policy in
an Economy without Capital.” Journal of Monetary Economics, 12(1): 55-93.
Olekalns, Nilss. 1997. “Australian Evidence on Tax Smoothing and the Optimal Budget
501 Tax Smoothing Hypothesis: A Turkish Case
Pasten, Roberto, and James P. Cover. 2011. “Does the Chilean Government Smooth Taxes?
A Tax-Smoothing Model with Revenue Collection from a Natural Resource.” Applied
Economics Letters, 18(5): 421-425.
Reitschuler, Gerhard. 2010. “Fiscal Policy and Optimal Taxation: Evidence from a Tax
Smoothing Exercise.” Scottish Journal of Political Economy, 57(2): 238-252.
Reitschuler, Gerhard. 2011. “Optimal Taxation and Budget Deficits: Evidence for the EU’s
New Member States.” Economics Bulletin, 31(3): 2593-2602.
Rocha, Fabiana. 2001. “Is there Any Rationale to the Brazilian Fiscal Policy.” Revista Brasileira de Economia, 55(3): 315-331.
Sahasakul, Chaipat. 1986. “The U.S. Evidence on Optimal Taxation over Time.” Journal of Monetary Economics, 18(3): 251-275.
Serletis, Apostolos, and Richard G. Schorn. 1999. “International Evidence on the Tax- and
Revenue-Smoothing Hypothesis.” Oxford Economic Papers, 51(2): 387-396.
Strazicich, Mark C. 2002. “International Evidence of Tax Smoothing in a Panel of Industrial
Countries.” Applied Economics, 34(18): 2325-2331.
Trehan, Bharat, and Carl E. Walsh. 1988. “Common Trends, the Government’s Budget
Constraint, and Revenue Smoothing.” Journal of Economic Dynamics and Control,
12(2-3): 425-444.