Submitted 21 July 2015 Accepted 23 October 2015 Published19 November 2015
Corresponding author
Ehsan Kayal, [email protected]
Academic editor
M ´onica Medina
Additional Information and Declarations can be found on page 20
DOI10.7717/peerj.1403
Distributed under
Creative Commons Public Domain Dedication
OPEN ACCESS
Phylogenetic analysis of higher-level
relationships within Hydroidolina
(Cnidaria: Hydrozoa) using
mitochondrial genome data and insight
into their mitochondrial transcription
Ehsan Kayal1, Bastian Bentlage1, Paulyn Cartwright2,
Angel A. Yanagihara3, Dhugal J. Lindsay4, Russell R. Hopcroft5and Allen G. Collins1,6
1Department of Invertebrate Zoology, Smithsonian Institution, Washington, DC, USA 2Department of Ecology and Evolutionary Biology, University of Kansas, Lawrence, KS, USA 3Department of Tropical Medicine, Medical Microbiology and Pharmacology, John A. Burns
School of Medicine, University of Hawaii at Manoa, Honolulu, HI, USA
4Japan Agency for Marine-Earth Science and Technology (JAMSTEC), Yokosuka, Japan 5Institute of Marine Science, University of Alaska Fairbanks, Fairbanks, AK, USA 6National Systematics Laboratory of NOAA’s Fisheries Service, National Museum of
Natural History, Washington, DC, USA
ABSTRACT
Hydrozoans display the most morphological diversity within the phylum Cnidaria. While recent molecular studies have provided some insights into their evolutionary history, sister group relationships remain mostly unresolved, particularly at mid-taxonomic levels. Specifically, within Hydroidolina, the most speciose hydrozoan subclass, the relationships and sometimes integrity of orders are highly unsettled. Here we obtained the near complete mitochondrial sequence of twenty-six hydroidolinan hydrozoan species from a range of sources (DNA and RNA-seq data, long-range PCR). Our analyses confirm previous inference of the evolution of mtDNA in Hydrozoa while introducing a novel genome organization. Using RNA-seq data, we propose a mechanism for the expression of mitochondrial mRNA in Hydroidolina that can be extrapolated to the other medusozoan taxa. Phylogenetic analyses using the full set of mitochondrial gene sequences provide some insights into the order-level relationships within Hydroidolina, including siphonophores as the first diverging clade, a well-supported clade comprised of Leptothecata-Filifera III–IV, and a second clade comprised of Aplanulata-Capitatas.s.-Filifera I–II. Finally, we describe our relatively inexpensive and accessible multiplexing strategy to sequence long-range PCR amplicons that can be adapted to most high-throughput sequencing platforms.
Subjects Evolutionary Studies, Genomics, Molecular Biology, Zoology
INTRODUCTION
Cnidaria (corals, anemones, jellyfish, hydroids) is a phylum of relatively simple aquatic animals characterized by the presence of a specific cell type, the cnidocyte, which harbors a highly specialized cellular organelle, the cnidocyst. Cnidaria encompasses five recognized classes (Daly et al., 2007): Anthozoa (stony corals, sea anemones, tube anemones, soft corals and gorgonians), Cubozoa (box jellyfish), Hydrozoa (hydroids, hydromedusae and siphonophores), Scyphozoa (the so-called true jellyfish), and Staurozoa (stalked jellyfish). Non-anthozoan cnidarians are united in the clade Medusozoa (Collins, 2002), whose members typically display a metagenetic life cycle consisting of planula larva, sessile polyp and free-swimming medusa, not all of which may be present in the life cycle of a given species. Within Medusozoa, Hydrozoa represents, to many measures, the most diverse class. Hydrozoa encompasses over 90% of medusozoan species (Daly et al., 2007), and so it is perhaps unsurprising that life cycle variation, as well as disparity of medusae, polyps, and colonies within this class far exceeds what is observed within Cubozoa, Scyphozoa or Staurozoa. An important and necessary step in understanding the evolution of the remarkable biodiversity present within Hydrozoa is a robust hypothesis of the phylogenetic relationships among its component taxa.
Recent work based on nuclear ribosomal sequences (Collins, 2002;Collins et al., 2006;Collins et al., 2008;Cartwright et al., 2008) and complete mitochondrial genome sequences (Kayal et al., 2013) shows that Hydrozoa consists of two main clades, Trachylina and Hydroidolina. Monophyly of the latter is also supported by phylogenetic analyses of life history and anatomical features (Marques & Collins, 2004). Trachylina is relatively poor in terms of species richness, containing roughly 150 species in four orders: Limnomedusae, Trachymedusae, Narcomedusae and Actinulida (Collins et al., 2008). The remainder of the approximately 3,350 species of hydrozoans (Daly et al., 2007) that make up the clade Hydroidolina, are classified in three orders: Anthoathecata, Leptothecata and Siphonophora (Schuchert, 2015; Hydroidolina. Accessed through:Schuchert (2015)World Hydrozoa database athttp://www.marinespecies.org/hydrozoa/aphia.php?p=taxdetails& id=19494on 2015-07-09). Hydroidolina comprises almost all hydrozoans whose life cycle includes a benthic polypoid or hydroid stage (the exception being Limnomedusae, which is part of Trachylina). Colonial hydroid stages within Hydroidolina, especially siphonophores, tend to have greater functional specialization between zooids than other colonial members of Cnidaria (Hyman, 1940;Dunn, Pugh & Haddock, 2005;Dunn, 2009;
Cartwright & Nawrocki, 2010).
whose medusae (when present) usually bear gonads on the manubrium (Cartwright et al., 2008). Yet, the absence of thecae can easily be interpreted as plesiomorphic (Cartwright &
Nawrocki, 2010). Even though there has been no support for the monophyly of
Anthoath-ecata, several likely clades have been identified within this taxonomic group. Aplanulata, a group consisting of hydrozoans that lack a ciliated planula stage, was introduced recently (Collins et al., 2005) and its monophyly supported in subsequent studies (Collins et al., 2006;Cartwright et al., 2008;Kayal et al., 2013;Nawrocki et al., 2013). Aplanulata contains a portion of the families whose species, in the hydroid stage, possess capitate tentacles. In the past, all hydrozoan species possessing capitate tentacles have been united within the anthoathecate suborder Capitata. However, the taxon has become restricted to a well-supported clade of non-Aplanulata species with capitate tentacles (Collins et al., 2005;
Nawrocki, Schuchert & Cartwright, 2010), referred to as Capitatasensu strictobyCartwright et al. (2008). The status of the anthoathecate suborder Filifera, containing species whose hydroid stage has tentacles with more or less uniform distribution of nematocysts (filiform), is even more complex, with no less than four putative clades with various levels of support recognized (Cartwright et al., 2008;Cartwright & Nawrocki, 2010).
Despite the recognition of several possible and likely clades within Hydroidolina, phylogenetic analyses have thus far suffered from low support for deep nodes representing the relationships among them. Filifera has never been recovered as a monophyletic group in any explicit phylogenetic analysis, nor has there been support for relationships among the filiferan clades, Capitata, Aplanulata, Leptothecata and Siphonophora (Collins, 2002;Collins et al., 2006;Collins et al., 2008;Cartwright et al., 2008;Cartwright &
Nawrocki, 2010). Lack of resolution among the deep nodes of Hydroidolina hinders
our understanding of their evolution. Indeed, a recent review (Cartwright & Nawrocki, 2010) highlighted the complexity of morphological characters in the evolutionary history of Hydrozoa and lamented the current lack of resolution of hydroidolinan phylogeny, particularly at ordinal and subordinal levels, which prevents a better understanding of life cycle evolution within this class.
Recent technological advances have allowed us to target the nearly complete mtDNA instead of the single-locus approaches, including barcoding, often used in systematics and biodiversity studies (Dettai et al., 2012). The small size and circular nature of the majority of animal mtDNAs make them accessible for low-budget taxonomic studies, given the availability of simple and inexpensive protocols. It is now possible to amplify the complete mtDNA using long-range PCR (Burger et al., 2007), which combined with novel high-throughput sequencing technologies, provide access to mitogenomic data for groups considered “difficult-to-sequence” at very low cost and effort (Kayal et al., 2012;Briscoe et al., 2013;Foox et al., 2015). To date, the mtDNA of 188 non-bilaterian animals has been sequenced, out of which 124 are cnidarians, mostly anthozoans.
have suggested that the mitochondrial genome in medusozoan cnidarians can be mono-, bi-, or octo-chromosomal (Ender & Schierwater, 2003;Voigt, Erpenbeck & W¨orheide, 2008;
Kayal & Lavrov, 2008;Park et al., 2012;Zou et al., 2012;Kayal et al., 2012;Smith et al., 2012). Interestingly, the linearization of medusozoan mtDNA appears to coincide with relative stability in the gene organization of most medusozoans (Kayal et al., 2012), which facilitates designing protocols for amplification and sequencing most of the coding regions of the mitochondrial chromosome(s).
We present an analysis of nearly-complete mitochondrial genome sequences from a diverse set of hydrozoan taxa in an effort to better understand the relationships within Hydroidolina. Specifically, we describe twenty-six novel, nearly-complete mitochondrial genomes from several hydrozoan orders. We first analyzed the composition and gene order of these mitochondrial genomes. We then used RNA-seq data to infer some of the mechanisms involved in mitochondrial gene expression. Finally, we used both the nucleotide and amino acid sequence data to reconstruct the evolutionary history of hydrozoans, focusing on the thus far intractable relationships within Hydroidolina.
MATERIAL AND METHODS
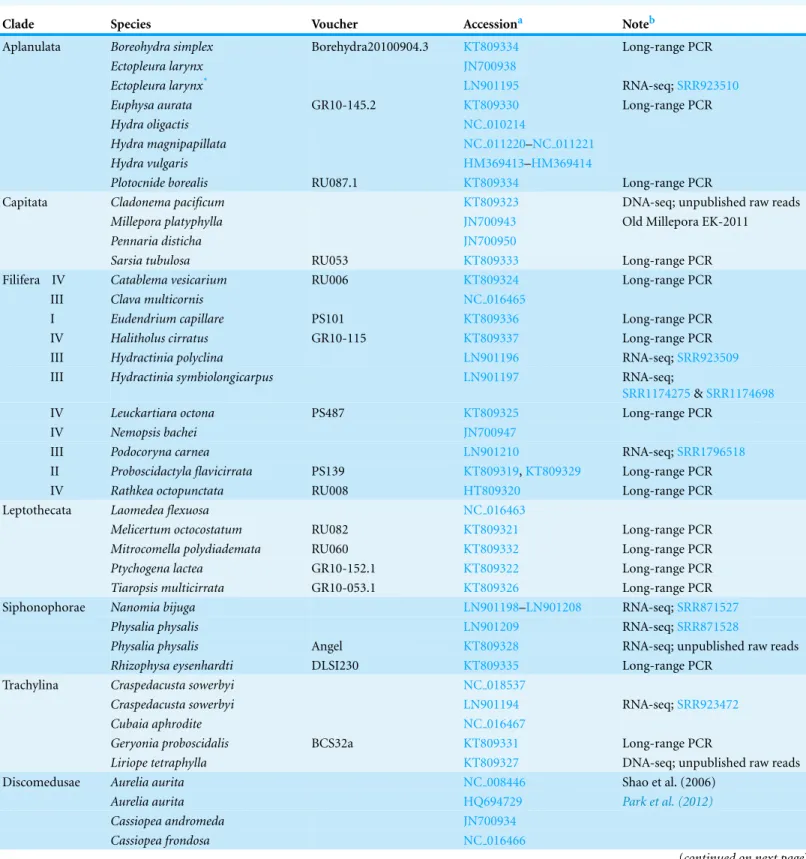
Taxon samplingWe sampled species from both hydrozoan subclasses, Trachylina (three species) and Hydroidolina (twenty-three species), maximizing the coverage of hydrozoan diversity by sampling at least one species from all the currently recognized hydroidolinan clades that correspond to the orders/suborders Aplanulata, Capitatas.s., Filifera I–IV, Leptothecata, Siphonophorae (Table 1). We acquired all publicly available medusozoan mitochondrial genomes through Genbank, including nineteen non-hydrozoans used as outgroup taxa (Table 1).
Obtaining nearly-complete mitochondrial genomes
Table 1 List of samples used in this study.
Clade Species Voucher Accessiona Noteb
Aplanulata Boreohydra simplex Borehydra20100904.3 KT809334 Long-range PCR
Ectopleura larynx JN700938
Ectopleura larynx* LN901195 RNA-seq;SRR923510
Euphysa aurata GR10-145.2 KT809330 Long-range PCR
Hydra oligactis NC 010214
Hydra magnipapillata NC 011220–NC 011221
Hydra vulgaris HM369413–HM369414
Plotocnide borealis RU087.1 KT809334 Long-range PCR
Capitata Cladonema pacificum KT809323 DNA-seq; unpublished raw reads
Millepora platyphylla JN700943 Old Millepora EK-2011
Pennaria disticha JN700950
Sarsia tubulosa RU053 KT809333 Long-range PCR
Filifera IV Catablema vesicarium RU006 KT809324 Long-range PCR
III Clava multicornis NC 016465
I Eudendrium capillare PS101 KT809336 Long-range PCR IV Halitholus cirratus GR10-115 KT809337 Long-range PCR III Hydractinia polyclina LN901196 RNA-seq;SRR923509
III Hydractinia symbiolongicarpus LN901197 RNA-seq;
SRR1174275&SRR1174698
IV Leuckartiara octona PS487 KT809325 Long-range PCR IV Nemopsis bachei JN700947
III Podocoryna carnea LN901210 RNA-seq;SRR1796518
II Proboscidactyla flavicirrata PS139 KT809319,KT809329 Long-range PCR IV Rathkea octopunctata RU008 HT809320 Long-range PCR
Leptothecata Laomedea flexuosa NC 016463
Melicertum octocostatum RU082 KT809321 Long-range PCR
Mitrocomella polydiademata RU060 KT809332 Long-range PCR
Ptychogena lactea GR10-152.1 KT809322 Long-range PCR
Tiaropsis multicirrata GR10-053.1 KT809326 Long-range PCR
Siphonophorae Nanomia bijuga LN901198–LN901208 RNA-seq;SRR871527
Physalia physalis LN901209 RNA-seq;SRR871528
Physalia physalis Angel KT809328 RNA-seq; unpublished raw reads
Rhizophysa eysenhardti DLSI230 KT809335 Long-range PCR
Trachylina Craspedacusta sowerbyi NC 018537
Craspedacusta sowerbyi LN901194 RNA-seq;SRR923472
Cubaia aphrodite NC 016467
Geryonia proboscidalis BCS32a KT809331 Long-range PCR
Liriope tetraphylla KT809327 DNA-seq; unpublished raw reads
Discomedusae Aurelia aurita NC 008446 Shao et al. (2006)
Aurelia aurita HQ694729 Park et al. (2012)
Cassiopea andromeda JN700934
Cassiopea frondosa NC 016466
Table 1 (continued)
Clade Species Voucher Accessiona Noteb
Catostylus mosaicus JN700940
Chrysaora quinquecirrha HQ694730
Chrysaora sp. EK-2011 JN700941
Cyanea capillata JN700937
Rhizostoma pulmo JN700987–JN700988
Pelagia noctiluca JN700949
Coronatae Linuche unguiculata JN700939
Staurozoa Craterolophus convolvulus JN700975–JN700976
Haliclystus sanjuanensis JN700944
Lucernaria janetae JN700946
Cubozoa Alatina moseri JN642330–JN642344
Carukia barnesi JN700959–JN700962
Carybdea xaymacana JN700977–JN700983
Chironex fleckeri JN700963–JN700968
Chiropsalmus quadrumanus JN700969–JN700974
Notes.
*Not included in phylogenetic analyses.
aAccession name correspond to KT for Genbank and LN for the European Nucleotide Archive (ENA). bSRR codes are GenBank Archive numbers of the DNA-seq and RNA-seq runs used in this study.
were processed for multiplexed double-tagged library preparation for Illumina (100 bp single-end) or Ion Torrent (200 bp single-end) sequencing using custom protocols (see Supplemental Informationfor detailed protocols). Sequencing was performed either on one lane of Illumina HiSeq2000 platform (Illumina, San Diego, California, USA) at the Genomics Core Lab of the University of Alabama or using one 316 v.1 chip on the Ion Torrent Personal Genome Machine Ion platform (PGM; Life Technologies, Carlsbad, California, USA) at the Laboratories of Analytical Biology of the Smithsonian National Museum of Natural History.
Sequence assembly and annotation
Sequence reads were sorted per taxon by index and barcode using the Galaxy Barcode Splitter from the Galaxy platform (Giardine et al., 2005;Blankenberg et al., 2010;Goecks, Nekrutenko & Taylor, 2010) and Geneious v.7 (Kearse et al., 2012), respectively. Reads were trimmed and the barcode removed using Geneious before proceeding to assembly using the built-in overlap-layout-consensus assembler of Geneious v.7 and a modified version of MITObim v.1.7 (Hahn, Bachmann & Chevreux, 2013). Then, we used these consensus sequences as backbones to map the sorted and end-trimmed raw reads using both MIRA v.4 (Chevreux, Wetter & Suhai, 1999) and the built-in Geneious mapping plug-in. The final contigs covered the nearly complete mtDNAs as expected from long-range PCR amplifications.
physalis,Craspedacusta sowerbyi,Ectopleura larynx,Podocoryna carneaand two species ofHydractinia, H. polyclinaandH. symbiolongicarpus(Table 1). For these specimens, we first captured several mitochondrial regions by mapping raw reads to the mtDNA from other hydrozoan genomes with Bowtie v.2 (Langmead & Salzberg, 2012) and MIRA v.4. We then extended these contigs with several rounds of baiting (using the mirabait script from MIRA v.4) and assembly (using the overlap-layout consensus assembler in Geneious) into gapped mtDNAs forE. larynx,C. sowerbyi,L. tetraphylla,P. carnea, H. polyclina,H. symbiolongicarpus, one specimen ofP. physalisandC. pacificum, as well as the nearly-complete coding regions forN. bijuga, and another specimen ofP. physalis.
We identified protein genes by blasting large (>300 bp) open reading frames (ORFs) obtained via translation using the minimally derived genetic code (translation table 4=the Mold, Protozoan, and Coelenterate Mitochondrial Code) against published hydrozoan mtDNA genomes, followed by manual annotation. Transfer RNA (tRNA) genes were identified using the tRNAscan-SE and ARWEN programs (Lowe & Eddy, 1997;Laslett &
Canb¨ack, 2008). We identified ribosomal (rRNA) genes by similarity (BLAST searches on
NCBI’s GenBank) to their counterparts in published mt-genomes and delimited the ends by alignment (see below).
Sequence alignments and phylogenetic analyses
We prepared several multiple sequence alignments for phylogenetic analyses as described previously (Kayal et al., 2013). In short, the amino acid (AA hereafter) sequences of protein-coding genes were individually aligned using the L-INS-i option with default parameters of the MAFFT v.7 aligner online (Katoh & Standley, 2013) and subsequently concatenated. Nucleotide (NT hereafter) alignments for individual protein-coding genes were obtained according to their AA alignments using the online version of the PAL2NAL online program (Suyama, Torrents & Bork, 2006) and subsequently concatenated. Ribosomal genes (rRNA hereafter) were individually aligned using the online version of MAFFT with the Q-INS-i option (Katoh & Toh, 2008) and concatenated. We also created a concatenated all-nucleotides dataset consisting of NT and rRNA alignments (allNT hereafter). All concatenated alignments were filtered using Gblocks (Talavera & Castresana, 2007) with default parameters, allowing gaps in all positions, leading to alignments with 2,902 positions (2,501 informative sites) for AA, 9,864 positions (8,850 informative sites) for NT, 2,154 positions (1,664 informative sites) for rRNA, and 12,018 positions (10,773 informative sites) for allNT (Table S3, all alignments are provided as Supplemental Information). We estimated the number of phylogenetically informative sites with the DIVEIN online server (Deng et al., 2010), and the saturation levels of nucleotide alignments (NT, rRNA and allNT) using the DAMBE5 software (Xia, 2013).
MrBayes v.3.2.2 (Ronquist et al., 2012). Maximum Likelihood analyses were performed using the LG model of sequence evolution for amino acids. The General Time Reversible (GTR) models of nucleotide and amino acid evolution for all alignments were used for both Maximum Likelihood and Bayesian. Bayesian analyses consisted of two runs of 4 chains each of 10,000,000 generations using the GTR model for all alignments, sampled every 100 trees after a burn-in fraction of 0.25.
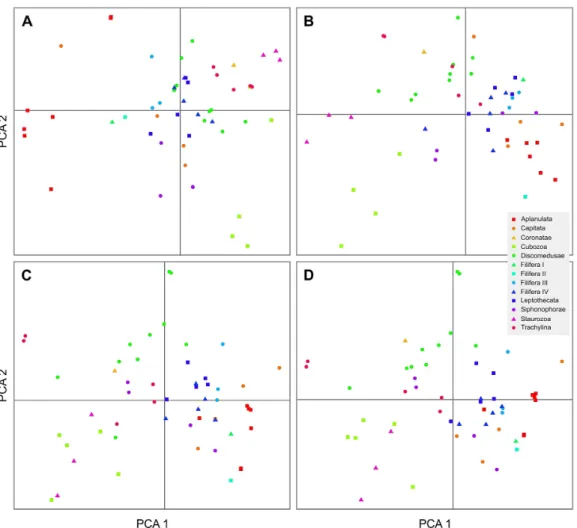
To investigate potential compositional biases in the datasets, amino acid and nucleotide composition of alignments were calculated using custom Python scripts (github.com/bastodian/shed/blob/master/Python/AA-Frequencies.py and github.com/bastodian/shed/blob/master/Python/GC-Frequencies.py), and visualized in 2-dimensional plots using the first two principal components as calculated by the princomp function in R version 2.15.1 (R Core Team, 2014).
Evaluation of competing phylogenetic hypotheses
We tested 3 sets of traditional hypotheses of hydroidolinan relationships using likelihood-based topology tests with the approximately unbiased (AU) tests as implemented in Consel (Shimodaira & Hasegawa, 2001). Phylogenetic analyses were performed under the three following scenarios using constrained topological ML searches in PhyML v. 3.1 (Guindon et al., 2010) to calculate per-site likelihoods.
(1) Several studies have found Capitata to be the earliest branching clade within Hydroidolina e.g., (Collins, 2002;Marques & Collins, 2004;Cartwright et al., 2008;
Cartwright & Nawrocki, 2010)) while another study suggested Aplanulata to be the earliest branch within Hydroidolina (Collins et al., 2006) . We compared these hypotheses to our best tree to evaluate if our data were able to reject either of these alternatives. (2) Filifera was traditionally viewed as being a monophyletic clade, but support for this nominal taxon has not been found so far (reviewed inCollins, 2009). We calculated the best ML tree under the constraint of the monophyly of Filifera and compared the resulting per-site likelihoods to those calculated from our best tree to evaluate if we can reject Filifera’s monophyly given our datasets. (3) Anthoathecata (Aplanulata+Capitata) is a traditional taxon within Hydroidolina, a group not supported by our study and others (Collins, 2009); we compared the constrained topology containing monophyletic Anthoathecata to our best tree.
RESULTS
The mitochondrial genomes of hydrozoan cnidarians
We obtained partial or complete mtDNA from twenty-six hydrozoan species, more than tripling the number of mitogenomes available to date for this class. We found four different genome organizations in these hydrozoans (Fig. 1), three of which were described previously (Kayal et al., 2012): the trachymedusaeGeryonia proboscidalisand Liriope tetraphyllahave a mitochondrial genome organization similar to that known from other trachylines,Cubaia aphrodite(Kayal et al., 2012) andCraspedacusta sowerbyi(Zou
et al., 2012); the mt genome organization in the aplanulatanEuphysa auratais similar
Non-aplanulatan Hydroidolina AMGO, Trachylina
cox2 cox3
atp8
IGR
IGR IGR IGR
Boreohydra simplex/Plotocnide borealis Aplanulata
Ectopleura larynx, Euphysa aurata, Hydra oligactis atp6
Figure 1 Predicted evolution of the mitochondrial genome organization in Hydrozoa
(Cnidaria).Genes are color-coded as follows: green for proteins; red for rRNAs; purple for tRNAs;
light-grey for repeated regions. CR: Control Region corresponding to the inversion of transcription orientation; IR: Inverted Repeat; IGR: Inter-Genic Region. AMGO corresponds to the Ancestral Mitochondrial Genome Organization as predicted inKayal et al. (2013); cox1 c is a duplicatedcox1on the other end of the mtDNA; incomplete 5’end and 3’end are represented by chevrons on the left and right side of genes, respectively.
Kayal et al., 2012); the mt-genome organization in the speciesCatablema vesicarium,
Cladonema pacificum,Craseoa lathetica,Eudendrium capilare,Halitholus cirratus, Hy-dractinia polyclina,H. symbiolongicarpus,Leuckartiara octona,Melicertum octocostatum, Mitrocomella polydiademata,Nanomia bijuga,Podocoryna carnea,Ptychogena lactea, Rathkea octopunctata,Rhizophysa eysenhardti, Sarsia tubulosa, andTiaropsis multicirrata, as well as the partial mitogenome ofProboscidactyla flavicirrataare all similar to that of non-aplanulatan hydroidolinans described previously (Kayal et al., 2012). The mtDNA sequences ofBoreohydra simplexandPlotocnide borealiswere identical, confirming previous suggestions that these two names represent two stages in the life cycle of the same species (SV Pyataeva, RR Hopcroft, DJ Lindsay, AG Collins, 2015, unpublished data).
Interestingly, the mt genome organization of this species is novel, potentially representing a transitional state between the mtDNA organization of other aplanulatan and that of non-aplanulatan hydroidolinans (Fig. 1, see ‘Discussion’).
A Physalia physalis
CR trnW(uca) trnM(cau) IGR IGR
B Model of mRNA expression in non-aplanulatan Hydroidolina
Transcription of polycistronic pre-mRNA
1
mt-mRNA maturation
2
rnl cox2 atp8-6-cox3 nad2-nad5 rns nad6-3-4L-1-4 cob cox1
Figure 2 Mitochondrial gene expression in non-aplanulatan Hydroidolina.(A) mtDNA organization in the siphonophorePhysalia physalisassembled from a large EST dataset. Grey lines correspond to the contigs assembled. Missing features (tRNAs, IGRs, CR) are shown with dotted lines. (B) Predicted model of mt-mRNA expression based on findings fromP. physalis. Color-codes are the same asFig. 1. Grey horizontal arrows are the two pre-mRNA transcripts, the larger being polycistronic. Dark vertical arrows correspond to regions of pre-mRNA excision from the “tRNA punctuation model”; red and blue arrows are the additional excision sites predicted from our model for hydrozoan mt-mRNA expression. We predict that stage 1 and 2 are simultaneous.
of reads) of thePhysaliaRNA-seq data. We found both small and large ribosomal RNA subunits (rnsandrnl, respectively) as well as the protein genescob,cox1, andcox2in single-gene contigs. The other protein genes were found in collinear contigs as follows: atp8-atp6-cox3,nad2-nad5, andnad6-nad3-nad4L-nad1-nad4(Fig. 2A). We were not able to identify with enough confidence the two expected tRNA genesmt-tRNA-Metand mt-tRNA-Thrin this large RNA-seq dataset. Using an independently generated, smaller source of RNA-seq data (SRA Archive num.SRR871528), we assembled a more complete mt genome, confirming that the mtDNA organization inPhysalia physaliswas similar to that of the other siphonophoreRhizophysa eysenhardtiobtained through long-range PCR. This smaller RNA-seq dataset provided the nearly-complete mtDNA sequence, with a few scattered gaps. The low amount of sequence data forNanomia bijugadid not allow us to identify all the protein genes.
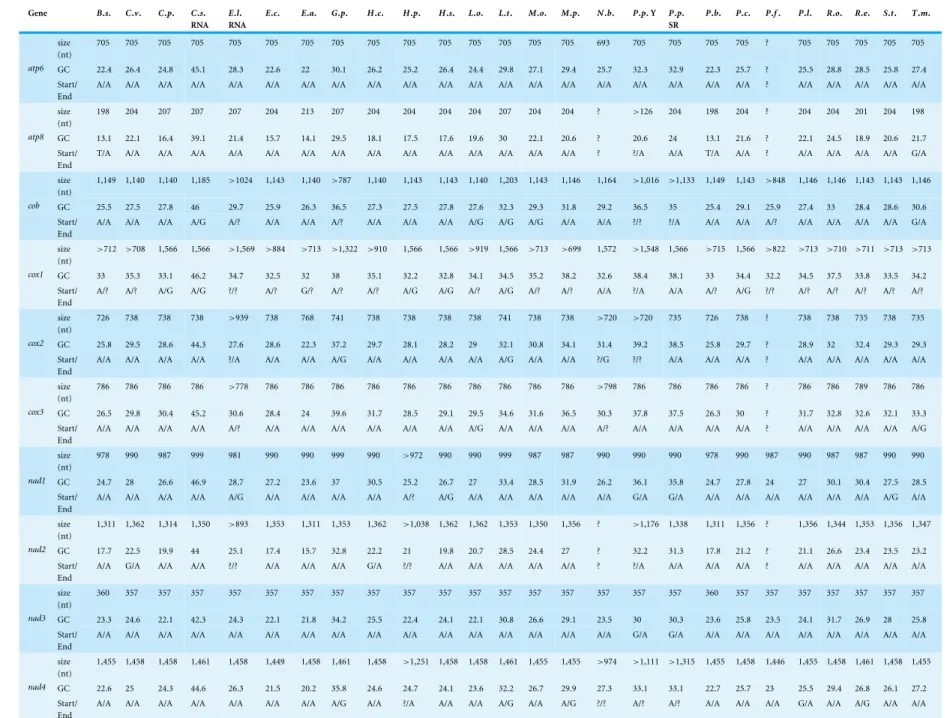
was ATG except foratp8inBoreohydra simplex/Plotocnide borealis(TTG) andTiaropsis multicirrata(GTG);cobinTiaropsis multicirrata(TTG);cox1inEuphysa aurata(GTG); nad1inPhysalia physalis(GTG);nad2inCatablema vesicarium,Halitholus cirratus, and Nanomia bijuga(GTG);nad3inPhysalia physalis(GTG);nad4inPtychogena lactea(GTG); nad4LinNanomia bijuga(GTG);nad5inBoreohydra simplex/Plotocnide borealis(TTG); nad6inCatablema vesicariumandNanomia bijuga(GTG). TAA was the most commonly used stop codon for protein genes, with the exception ofnad5andnad6where TAG was most often used (Table 2).
Phylomitogenomics of Hydrozoa
Our AA, NT, rRNA, and allNT analyses under both Maximum Likelihood and Bayesian frameworks did not yield completely consistent results (Figs. 3andS1–S8). Under GTR, the AA (Figs. S1andS5), NT (Figs. S2andS6) and allNT (Figs. 3andS4) Maximum Likelihood and Bayesian analyses, respectively, yielded almost identical topologies, whereas the rRNA-based topologies (Figs. S3andS7) and the AA topology assuming the LG model (Fig. S8) exhibited far lower resolution and support than all other topologies. The PCA of amino acid and nucleotide compositions (Fig. 4) of the alignments underlying our phylogenetic analyses, where taxa with similar composition cluster together, do not show evidence of strong compositional biases that may affect phylogenetic reconstruction.
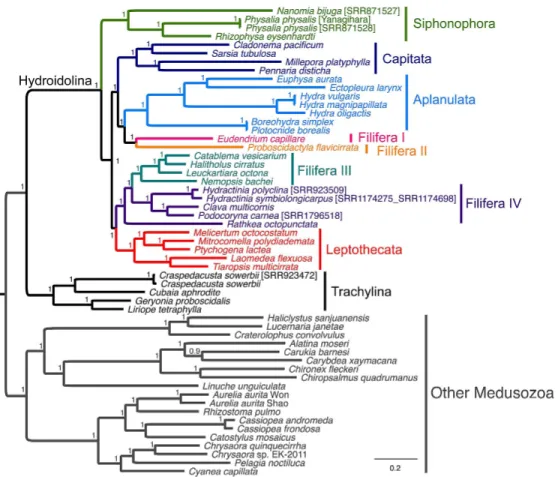
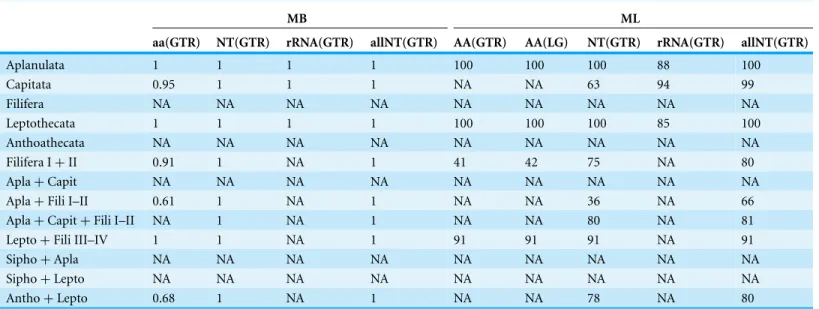
Overall, we found a number of common relationships in all phylogenetic trees that were highly supported: the divergence between Trachylina and Hydroidolina within Hydrozoa, the monophyly of Leptothecata, Capitatas.s. and Aplanulata (Table 3). Within Hydroidolina, all analyses other than those based on just the rRNA data alone: (1) iden-tified siphonophores as the first diverging clade in most trees; (2) supported Filifera I+ Filifera II; (3) supported Aplanulata+Capitata s.s.+Filifera I–II; (4) supported Filifera III+Filifera IV, with the latter being paraphyletic with respect to the former in many trees, and; (5) supported Leptothecata+Filifera III–IV (Table 3). No analyses recovered Capitata in its former sense (Aplanaluta+Capitatas.s.) nor the monophyly of Anthoathecata or Filifera. Our constraint analyses show that the placement of Capitata or Aplanulata as the earliest branching clades within Hydroidolina is rejected by both NT and allNT (NT plus rRNA) alignments, whereas both AA and rRNA data alone cannot reject these hypotheses (Table S5). The monophyly of Filifera was rejected in all cases other than for the rRNA dataset (Table S5). Lastly, the monophyly of Anthoathecata was rejected for both NT and allNT datasets while AA and rRNA alignments do not reject this traditional hypothesis (Table S5).
DISCUSSION
The evolution of mtDNA in Hydrozoa
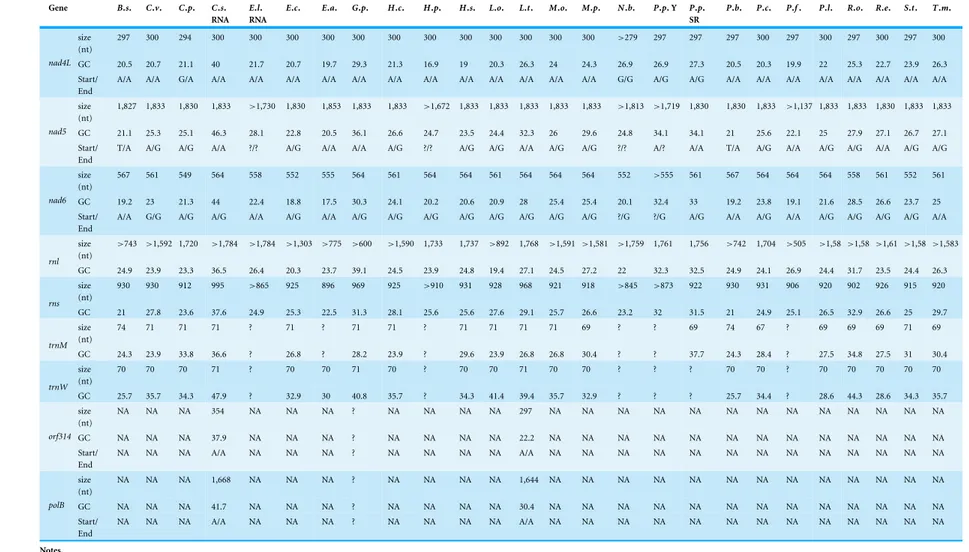
Table 2 Size, GC content and start and end codons for the genes of the newly obtained mtDNA.
Gene B.s. C.v. C.p. C.s. RNA
E.l. RNA
E.c. E.a. G.p. H.c. H.p. H.s. L.o. L.t. M.o. M.p. N.b. P.p.Y P.p. SR
P.b. P.c. P.f. P.l. R.o. R.e. S.t. T.m.
size (nt)
705 705 705 705 705 705 705 705 705 705 705 705 705 705 705 693 705 705 705 705 ? 705 705 705 705 705
GC 22.4 26.4 24.8 45.1 28.3 22.6 22 30.1 26.2 25.2 26.4 24.4 29.8 27.1 29.4 25.7 32.3 32.9 22.3 25.7 ? 25.5 28.8 28.5 25.8 27.4 atp6
Start/ End
A/A A/A A/A A/A A/A A/A A/A A/A A/A A/A A/A A/A A/A A/A A/A A/A A/A A/A A/A A/A ? A/A A/A A/A A/A A/A
size (nt)
198 204 207 207 207 204 213 207 204 204 204 204 207 204 204 ? >126 204 198 204 ? 204 204 201 204 198
GC 13.1 22.1 16.4 39.1 21.4 15.7 14.1 29.5 18.1 17.5 17.6 19.6 30 22.1 20.6 ? 20.6 24 13.1 21.6 ? 22.1 24.5 18.9 20.6 21.7 atp8
Start/ End
T/A A/A A/A A/A A/A A/A A/A A/A A/A A/A A/A A/A A/A A/A A/A ? ?/A A/A T/A A/A ? A/A A/A A/A A/A G/A
size (nt)
1,149 1,140 1,140 1,185 >1024 1,143 1,140 >787 1,140 1,143 1,143 1,140 1,203 1,143 1,146 1,164 >1,016 >1,133 1,149 1,143 >848 1,146 1,146 1,143 1,143 1,146
GC 25.5 27.5 27.8 46 29.7 25.9 26.3 36.5 27.3 27.5 27.8 27.6 32.3 29.3 31.8 29.2 36.5 35 25.4 29.1 25.9 27.4 33 28.4 28.6 30.6 cob
Start/ End
A/A A/A A/A A/G A/? A/A A/A A/? A/A A/A A/A A/G A/G A/G A/A A/A ?/? ?/A A/A A/A A/? A/A A/A A/A A/A G/A
size (nt)
>712 >708 1,566 1,566 >1,569 >884 >713 >1,322 >910 1,566 1,566 >919 1,566 >713 >699 1,572 >1,548 1,566 >715 1,566 >822 >713 >710 >711 >713 >713
GC 33 35.3 33.1 46.2 34.7 32.5 32 38 35.1 32.2 32.8 34.1 34.5 35.2 38.2 32.6 38.4 38.1 33 34.4 32.2 34.5 37.5 33.8 33.5 34.2 cox1
Start/ End
A/? A/? A/G A/G ?/? A/? G/? A/? A/? A/G A/G A/? A/G A/? A/? A/A ?/A A/A A/? A/G ?/? A/? A/? A/? A/? A/?
size (nt)
726 738 738 738 >939 738 768 741 738 738 738 738 741 738 738 >720 >720 735 726 738 ? 738 738 735 738 735
GC 25.8 29.5 28.6 44.3 27.6 28.6 22.3 37.2 29.7 28.1 28.2 29 32.1 30.8 34.1 31.4 39.2 38.5 25.8 29.7 ? 28.9 32 32.4 29.3 29.3 cox2
Start/ End
A/A A/A A/A A/A ?/A A/A A/A A/G A/A A/A A/A A/A A/G A/A A/A ?/G ?/? A/A A/A A/A ? A/A A/A A/A A/A A/A
size (nt)
786 786 786 786 >778 786 786 786 786 786 786 786 786 786 786 >798 786 786 786 786 ? 786 786 789 786 786
GC 26.5 29.8 30.4 45.2 30.6 28.4 24 39.6 31.7 28.5 29.1 29.5 34.6 31.6 36.5 30.3 37.8 37.5 26.3 30 ? 31.7 32.8 32.6 32.1 33.3 cox3
Start/ End
A/A A/A A/A A/A A/? A/A A/A A/A A/A A/A A/A A/G A/A A/A A/A A/? A/A A/A A/A A/A ? A/A A/A A/A A/A A/G
size (nt)
978 990 987 999 981 990 990 999 990 >972 990 990 999 987 987 990 990 990 978 990 987 990 987 987 990 990
GC 24.7 28 26.6 46.9 28.7 27.2 23.6 37 30.5 25.2 26.7 27 33.4 28.5 31.9 26.2 36.1 35.8 24.7 27.8 24 27 30.1 30.4 27.5 28.5 nad1
Start/ End
A/A A/A A/A A/A A/G A/A A/A A/A A/A A/? A/G A/A A/A A/A A/A A/A G/A G/A A/A A/A A/A A/A A/A A/A A/G A/A
size (nt)
1,311 1,362 1,314 1,350 >893 1,353 1,311 1,353 1,362 >1,038 1,362 1,362 1,353 1,350 1,356 ? >1,176 1,338 1,311 1,356 ? 1,356 1,344 1,353 1,356 1,347
GC 17.7 22.5 19.9 44 25.1 17.4 15.7 32.8 22.2 21 19.8 20.7 28.5 24.4 27 ? 32.2 31.3 17.8 21.2 ? 21.1 26.6 23.4 23.5 23.2
nad2
Start/ End
A/A G/A A/A A/A ?/? A/A A/A A/A G/A ?/? A/A A/A A/A A/A A/A ? ?/A A/A A/A A/A ? A/A A/A A/A A/A A/A
size (nt)
360 357 357 357 357 357 357 357 357 357 357 357 357 357 357 357 357 357 360 357 357 357 357 357 357 357
GC 23.3 24.6 22.1 42.3 24.3 22.1 21.8 34.2 25.5 22.4 24.1 22.1 30.8 26.6 29.1 23.5 30 30.3 23.6 25.8 23.5 24.1 31.7 26.9 28 25.8 nad3
Start/ End
A/A A/A A/A A/A A/A A/A A/A A/A A/A A/A A/A A/A A/A A/A A/A A/A G/A G/A A/A A/A A/A A/A A/A A/A A/A A/A
size (nt)
1,455 1,458 1,458 1,461 1,458 1,449 1,458 1,461 1,458 >1,251 1,458 1,458 1,461 1,455 1,455 >974 >1,111 >1,315 1,455 1,458 1,446 1,455 1,458 1,461 1,458 1,455
Table 2 (continued)
Gene B.s. C.v. C.p. C.s. RNA
E.l. RNA
E.c. E.a. G.p. H.c. H.p. H.s. L.o. L.t. M.o. M.p. N.b. P.p.Y P.p. SR
P.b. P.c. P.f. P.l. R.o. R.e. S.t. T.m.
size (nt)
297 300 294 300 300 300 300 300 300 300 300 300 300 300 300 >279 297 297 297 300 297 300 297 300 297 300
GC 20.5 20.7 21.1 40 21.7 20.7 19.7 29.3 21.3 16.9 19 20.3 26.3 24 24.3 26.9 26.9 27.3 20.5 20.3 19.9 22 25.3 22.7 23.9 26.3 nad4L
Start/ End
A/A A/A G/A A/A A/A A/A A/A A/A A/A A/A A/A A/A A/A A/A A/A G/G A/G A/G A/A A/A A/A A/A A/A A/A A/A A/A
size (nt)
1,827 1,833 1,830 1,833 >1,730 1,830 1,853 1,833 1,833 >1,672 1,833 1,833 1,833 1,833 1,833 >1,813 >1,719 1,830 1,830 1,833 >1,137 1,833 1,833 1,830 1,833 1,833
GC 21.1 25.3 25.1 46.3 28.1 22.8 20.5 36.1 26.6 24.7 23.5 24.4 32.3 26 29.6 24.8 34.1 34.1 21 25.6 22.1 25 27.9 27.1 26.7 27.1 nad5
Start/ End
T/A A/G A/G A/A ?/? A/G A/A A/A A/G ?/? A/G A/G A/A A/G A/G ?/? A/? A/A T/A A/G A/A A/G A/G A/A A/G A/G
size (nt)
567 561 549 564 558 552 555 564 561 564 564 561 564 564 564 552 >555 561 567 564 564 564 558 561 552 561
GC 19.2 23 21.3 44 22.4 18.8 17.5 30.3 24.1 20.2 20.6 20.9 28 25.4 25.4 20.1 32.4 33 19.2 23.8 19.1 21.6 28.5 26.6 23.7 25 nad6
Start/ End
A/A G/G A/G A/G A/A A/G A/A A/G A/G A/G A/G A/G A/G A/G A/G ?/G ?/G A/G A/A A/G A/A A/G A/G A/G A/G A/A
size (nt)
>743 >1,592 1,720 >1,784 >1,784 >1,303 >775 >600 >1,590 1,733 1,737 >892 1,768 >1,591 >1,581 >1,759 1,761 1,756 >742 1,704 >505 >1,588>1,586>1,613>1,581>1,583
rnl
GC 24.9 23.9 23.3 36.5 26.4 20.3 23.7 39.1 24.5 23.9 24.8 19.4 27.1 24.5 27.2 22 32.3 32.5 24.9 24.1 26.9 24.4 31.7 23.5 24.4 26.3 size
(nt)
930 930 912 995 >865 925 896 969 925 >910 931 928 968 921 918 >845 >873 922 930 931 906 920 902 926 915 920
rns
GC 21 27.8 23.6 37.6 24.9 25.3 22.5 31.3 28.1 25.6 25.6 27.6 29.1 25.7 26.6 23.2 32 31.5 21 24.9 25.1 26.5 32.9 26.6 25 29.7 size
(nt)
74 71 71 71 ? 71 ? 71 71 ? 71 71 71 71 69 ? ? 69 74 67 ? 69 69 69 71 69
trnM
GC 24.3 23.9 33.8 36.6 ? 26.8 ? 28.2 23.9 ? 29.6 23.9 26.8 26.8 30.4 ? ? 37.7 24.3 28.4 ? 27.5 34.8 27.5 31 30.4
size (nt)
70 70 70 71 ? 70 70 71 70 ? 70 70 71 70 70 ? ? ? 70 70 ? 70 70 70 70 70
trnW
GC 25.7 35.7 34.3 47.9 ? 32.9 30 40.8 35.7 ? 34.3 41.4 39.4 35.7 32.9 ? ? ? 25.7 34.4 ? 28.6 44.3 28.6 34.3 35.7
size (nt)
NA NA NA 354 NA NA NA ? NA NA NA NA 297 NA NA NA NA NA NA NA NA NA NA NA NA NA
GC NA NA NA 37.9 NA NA NA ? NA NA NA NA 22.2 NA NA NA NA NA NA NA NA NA NA NA NA NA
orf314
Start/ End
NA NA NA A/A NA NA NA ? NA NA NA NA A/A NA NA NA NA NA NA NA NA NA NA NA NA NA
size (nt)
NA NA NA 1,668 NA NA NA ? NA NA NA NA 1,644 NA NA NA NA NA NA NA NA NA NA NA NA NA
GC NA NA NA 41.7 NA NA NA ? NA NA NA NA 30.4 NA NA NA NA NA NA NA NA NA NA NA NA NA
polB
Start/ End
NA NA NA A/A NA NA NA ? NA NA NA NA A/A NA NA NA NA NA NA NA NA NA NA NA NA NA
Notes.
B. s.,Boreohydra simplex; C. v.,Catablema vesicarium; C. p.,Cladonema pacificum; C. s. RNA,Craspedacusta sowerbyi; E.l. RNA,Ectopleura larynx; E. c.,Eudendrium capillare; E. a.,Euphysa aurata; G. p.,Geryonia proboscidalis; H. c.,Halitholus cirratus; H. p.,Hydractinia polyclina; H. s.,Hydractinia symbiolongicarpus; L. o.,Leuckartiara octona; L. t.,Liriope tetraphylla; M. o.,Melicertum octocostatum; M. p.,Mitrocomella polydiademata; N. b.,Nanomia bijuga; P. p. Y,Physalia physalis Y; P. p. SR,Physalia physalis SR; P. b.,Plotocnide borealis; P. c.,Podocoryna carnea; P. f.,Proboscidactyla flavicirrata; P. l.,Ptychogena lactea; R. o.,Rathkea octopunctata; R. e.,Rhizophysa eysenhardti; S. t.,Sarsia tubulosa; T. m.,Tiaropsis multicirrata.
Figure 3 Phylogenetic analysis of the allNT alignment under the Bayesian framework using MrBayes
with the GTR+Γmodel of sequence evolution.Support values correspond to posterior probabilities.
Figure 4 2-dimensional plots of the first two principal components from the principal component analysis of the composition of the AA (A), rRNA (B), NT (C) and allNT (D) alignments.
lost in Hydroidolina before the divergence of various orders. Aplanulata displays not two, but three increasingly derived genome organizations generated by sequential gene rearrangement (Fig. 1): inversion ofrnland translocation oftrnW inBoreohydra simplex/Plotocnide borealis; translocation oftrnMinEctopleura larynx,Euphysa aurataand Hydra oligactis; partitioning of the genome into two nearly equal-sized chromosomes in some species ofHydra(Kayal et al., 2012). We found inter-genic regions (IGRs) longer than 10 bp aftercox2inBoreohydra simplex/Plotocnide borealisand aftercox3inEctopleura larynx,Euphysa aurataandHydraspp. These IGRs could conceivably be residues left from the translocations oftrnWandtrnM, respectively, but no obvious homology was found in our alignments (data not shown).
Expression of mtDNA genes in hydrozoans
Table 3 Posterior probabilities and bootstrap values for different clades within Hydrozoa.
MB ML
aa(GTR) NT(GTR) rRNA(GTR) allNT(GTR) AA(GTR) AA(LG) NT(GTR) rRNA(GTR) allNT(GTR)
Aplanulata 1 1 1 1 100 100 100 88 100
Capitata 0.95 1 1 1 NA NA 63 94 99
Filifera NA NA NA NA NA NA NA NA NA
Leptothecata 1 1 1 1 100 100 100 85 100
Anthoathecata NA NA NA NA NA NA NA NA NA
Filifera I+II 0.91 1 NA 1 41 42 75 NA 80
Apla+Capit NA NA NA NA NA NA NA NA NA
Apla+Fili I–II 0.61 1 NA 1 NA NA 36 NA 66
Apla+Capit+Fili I–II NA 1 NA 1 NA NA 80 NA 81
Lepto+Fili III–IV 1 1 NA 1 91 91 91 NA 91
Sipho+Apla NA NA NA NA NA NA NA NA NA
Sipho+Lepto NA NA NA NA NA NA NA NA NA
Antho+Lepto 0.68 1 NA 1 NA NA 78 NA 80
release single-gene (monocistronic) mRNAs and rRNAs (Mercer et al., 2011). Unlike most animals, cnidarian mtDNAs encode either one (trnMin Cubozoa and Octocorallia) or two (trnMandtrnWin the remaining taxa) tRNA genes. This begs the question of the mechanisms involved in the expression of mt genes for this group.
In siphonophores, as in other non-aplanulatan hydroidolinans, thetrnW gene is situated between cox2andatp8, while thetrnM gene falls betweencox3 andnad2 (Fig. 1). While we expect the mt genome of the siphonophorePhysalia physalisto be organized into a single chromosome similar to that ofRhizophysa eysenhardtias suggested by the small RNA-seq data, the partial mt genome obtained from the large RNA-seq data assembled into eight contigs (Fig. 2A). The smaller RNA-seq dataset produced six contigs, including polycistronictrnW(3’end)-atp8-atp6-cox3-trnM-nad2(5’end), nad2(partial)-nad5(partial),nad5(3’end)-rns-nad6-nad3-nad4L-nad1-nad4(partial) and cob(partial)-cox1, as well as monocystroniccox2andrnl. The failure to recover full-length genes likely resulted from insufficient coverage of mt-RNAs in this dataset. For the larger RNA-seq dataset, we found a different pattern of gaps, none within genes; reads span across protein gene boundaries foratp8-atp6-cox3,nad2-nad5, andnad6-nad3-nad4L-nad1-nad4 (Fig. 2A) with average coverage ranging from 8 to 223 reads per contig (data not shown). The absence of any reads between these gene clusters, as well as between contigsnad2-nad5 andrnsorrnsandnad6-nad3-nad4L-nad1-nad4in the large RNA-seq data neither appears to be the result of insufficient read depth nor is it easily explained by the highly transient nature of the polycistronic precursor (pre-mRNA) transcript. The two sets ofPhysalia RNA data were produced using different approaches for capturing mRNAs and building the Illumina libraries, resulting in different maturation levels of the transcripts. We posit that the larger RNA-seq dataset contains only mature mt-mRNAs while the smaller RNA-seq dataset has both pre- and mature mRNAs. Accordingly, the pattern of mt-RNA expression is in part in accord with the tRNA punctuation model, where the excision of the tRNAs would release monocistroniccox2and polycistronicatp8-atp6-cox3from the pre-mRNA (Fig. 2B, Step 2, black arrows). Yet, this model does not explain the bicistronic nad2-nad5nor monocistronicrns,cobandcox1. It is possible that both the rRNAs and the tRNAs are excised, simultaneously or sequentially, from the precursor transcript, releasing bicistronicnad2-nad5and monocistronicrns(Fig. 2B, Step 2, red arrows). However, an additional mechanism would need to be invoked to explain the excision ofcobandcox1 (as illustrated by the absence of reads spanning across that gene boundary) from the polycistronic precursor transcripts. We observed intergenic regions of 10 bp or longer with conserved motifs in these positions (Figs. 2andS9) with potential secondary structures (Figs. S10) that could represent recognition sites for the enzyme involved in maturation of mRNA (Fig. 2B, Step 2, blue arrows). This scenario is supported by the presence of IGRs before (and sometimes after) mt-tRNAs. In fact, by forming short stem-loops, these IGRs might signal for the maturation of mt pre-mRNA in Hydrozoa in a similar fashion as mt-tRNAs in other animals (Mercer et al., 2011).
among hydroidolinan taxa (Collins et al., 2006;Cartwright et al., 2008;Cartwright & Nawrocki, 2010). In our analyses, we similarly found mt-rRNA insufficient for deciphering relationships among hydroidolinan lower clades with high support (Figs. S3,S7and Table 3). The saturation test (Xia et al., 2003) suggests a high level of saturation in the rRNA alignment for 16 and 32 OTUs, while saturation levels are assumed acceptable for the other datasets (Table S2), which could explain the poor performance of rRNA. Similarly, rRNA alone did not allow discriminating among several competing hypotheses of hydroidolinan relationships while NT data did (Table S5).
Our phylogenetic analyses strongly support the monophyly of Trachylina and Hydroidolina, while rejecting Anthoathecata and Filifera as suggested by other molecular data (Cartwright et al., 2008;Cartwright & Nawrocki, 2010). Interestingly, our data support the hypothesis that Siphonophorae is the first diverging lineage within Hydroidolina (Fig. 3andTable 3) in contrast to a recent phylogenomic study that found Aplanulata to be the earliest branching clade within Hydroidolina while Siphonophorae was nested within Hydroidolina (Zapata et al., 2015). Previous studies have grouped, though with low support, Siphonophorae with either Aplanulata (Cartwright et al., 2008) or Leptothecata (Cartwright et al., 2008;Cartwright & Nawrocki, 2010), but both hypothetical positions are contradicted by our analyses (Table 3). Our competing hypothesis suggests that the unique holopelagic colonial organization of siphonophores could have been an early innovation within Hydrozoa. However, given that it is apomorphic, it could have evolved anywhere along the lineage leading from the origin of Hydroidolina to the last common ancestor of Siphonophorae.
Recent rRNA phylogenetic studies have broken Filifera into four clades (I–IV), with varying levels of support (Cartwright et al., 2008). As with our data, rRNA data revealed a clade, albeit with low support, uniting Filifera I (=family Eudendriidae), Filifera II, and Aplanulata. Similarly, our results are consistent with the rRNA-based results, again with low support, that Filifera III and Filifera IV form a clade. However, mitochondrial genome data suggest that Filifera III is embedded within Filifera IV. Studies on morphology and rRNA data have placedClava multicorniswithin Hydractiniidae, making it a member of Filifera III (Schuchert, 2001;Cartwright et al., 2008), which is confirmed by our results. Interestingly, in our trees Filifera IV was found to include a poorly supported, but morphologically distinct, clade dubbed Gonoproxima, containing species that do not bear gonophores on the hydranth body, instead budding on the hydrocauli, pedicels, or stolons (Cartwright et al., 2008;Cartwright & Nawrocki, 2010). Our taxon sampling is much more depauperate, but our analyses suggest that the positioning of the gonophores may perhaps be evolutionarily too labile to be strictly used for classification, similar to the presence of scattered tentacles (Schuchert, 2001).
independently. It is not surprising that the absence of capitate tentacles (the main uniting feature of Filifera) is not revealed to be a synapomorphy.
Significantly more than half of the species within Hydroidolina are contained within Leptothecata, which highlights the lack of taxon sampling in our analysis with just five species represented. Ribosomal analyses have revealedMelicertum octocostatum, a species that actually lacks a theca in the hydroid stage, to be of the sister taxon to the remainder of Leptothecata (Cartwright et al., 2008;Lecl`ere et al., 2009;Cartwright & Nawrocki, 2010), raising the possibility that the theca was derived within Leptothecata rather than emerging right at its base. Our analyses also containMelicertum octocostatumdiverging early within Leptothecata, but not sister to all other sampled leptothecates. Given the caveat that taxon sampling is limited, the absence of a theca inMelicertumis likely a secondary loss. In fact, several other leptothecates show a reduced or diminutive theca into which the hydranth is not able to retract.
CONCLUSION
In this study, we assembled and annotated twenty-three novel nearly-complete or complete mitochondrial genomes from most orders of the class Hydrozoa, with an emphasis on the subclass Hydroidolina. Increased taxon sampling revealed only one additional mitogenome organization beyond those described previously for hydrozoans, being consistent with the most recent overall picture of mitogenome evolution (Kayal et al., 2012). Using EST data, we proposed that the mitochondrial pre-mRNA is polycistronic, with tRNAs and rRNAs likely excised simultaneously during transcription following a modified tRNA punctuation model. Using both nucleotide and amino acid alignments, we inferred the evolutionary history of taxa within Hydroidolina, one of the most difficult questions in cnidarian phylogenetics. In contrast to previous analyses, our data yield resolved topologies and provide a working hypothesis for deep hydroidolinan relationships. Specifically, mitogenome data suggest that Siphonophorae is the earliest diverging group within Hydroidolina; a clade is formed by Leptothecata+Filifera III/IV, where Filifera IV/Gonoproxima is paraphyletic; and Aplanulata/Capitata/Filifera I+II form a clade. We conclude that mitochondrial protein coding sequence data is a pertinent marker for resolving the phylogeny of Hydrozoa. Future investigations of hydrozoans could take advantage of the highly conserved mitogenome organization and the ever-decreasing price of sequencing to obtain the complete mtDNA for massive numbers of hydrozoan samples. We are looking forward to additional studies using alternate data (nuclear genes and genomes) to test our findings.
ACKNOWLEDGEMENTS
ADDITIONAL INFORMATION AND DECLARATIONS
Funding
This project was mainly funded by a Smithsonian Institution Peter Buck Predoctoral Grant to EK. This work was also supported by the National Science Foundation’s Assembling the Tree of Life program (DEB No. 0829986 to R.W. Thacker and A.G.C.). BB wishes to acknowledge an NSF Doctoral Dissertation Improvement Grant (DEB 0910237) that funded the sequencing ofLiriope tetraphylla. RRH was funded in part by the National Oceanic and Atmospheric Administration under UAF cooperative agreements NA13OAR4320056 and NA08OAR4320870, and by the project BOFYGO (from the board of the Danish Centre for Marine Research, DCH) and the Greenland Climate Research Centre (project 6505) via TGN.Physalia physalissequencing was supported by NIH/NIAMS, R01 AR059388 to AY. The funders had no role in study design, data collection and analysis, decision to publish, or preparation of the manuscript.
Grant Disclosures
The following grant information was disclosed by the authors: Smithsonian Institution Peter Buck Predoctoral.
National Science Foundation’s Assembling the Tree of Life program: 0829986. NSF Doctoral Dissertation Improvement: 0910237.
National Oceanic and Atmospheric Administration under UAF: NA13OAR4320056, NA08OAR4320870.
Danish Centre for Marine Research, DCH. Greenland Climate Research Centre: 6505. NIH/NIAMS: R01 AR059388.
Competing Interests
The authors declare there are no competing interests.
Author Contributions
• Ehsan Kayal conceived and designed the experiments, performed the experiments,
analyzed the data, contributed reagents/materials/analysis tools, wrote the paper, prepared figures and/or tables, reviewed drafts of the paper.
• Bastian Bentlage performed the experiments, analyzed the data, contributed
reagents/materials/analysis tools, wrote the paper, prepared figures and/or tables, reviewed drafts of the paper.
• Paulyn Cartwright, Angel A. Yanagihara, Dhugal J. Lindsay and Russell R. Hopcroft
contributed reagents/materials/analysis tools, reviewed drafts of the paper.
• Allen G. Collins conceived and designed the experiments, contributed
DNA Deposition
The following information was supplied regarding the deposition of DNA sequences: A majority of the newly described mitochondrial genomes have being submitted to GenBank:KT809334,KT809330,KT809334,KT809323,KT809333,KT809324, KT809336, KT809337,KT809325, KT809319,KT809329, HT809320,KT809321, KT809332,KT809322,KT809326,KT809328,KT809335,KT809331,KT809327. The rest have been submitted to the European Nucleotide Archive (ENA):LN901194,LN901195, LN901196, LN901197, LN901198,LN901199,LN901200, LN901201,LN901202, LN901203, LN901204, LN901205,LN901206,LN901207, LN901208,LN901209, LN901210.
Data Availability
The following information was supplied regarding data availability:
GenBank:KT809334,KT809330,KT809334,KT809323,KT809333,KT809324, KT809336, KT809337,KT809325, KT809319,KT809329, HT809320,KT809321, KT809332,KT809322,KT809326,KT809328,KT809335,KT809331,KT809327. ENA: LN901194, LN901195, LN901196,LN901197,LN901198, LN901199,LN901200, LN901201, LN901202, LN901203,LN901204,LN901205, LN901206,LN901207, LN901208,LN901209,LN901210.
Supplemental Information
Supplemental information for this article can be found online athttp://dx.doi.org/ 10.7717/peerj.1403#supplemental-information.
REFERENCES
Blankenberg D, Von Kuster G, Coraor N, Ananda G, Lazarus R, Mangan M, Nekrutenko A, Taylor J. 2010.Galaxy: a web-based genome analysis tool for experimentalists. In: Ausubel FM, Brent R, Kingston RE, Moore DD, Seidman JG, Smith JA, Struhl K, eds.Current protocols in molecular biology. Chapter 19:Unit 19.10.1–19.10.21.
Briscoe AG, Goodacre S, Masta SE, Taylor MI, Arnedo MA, Penney D, Kenny J, Creer S. 2013.
Can long-range PCR be used to amplify genetically divergent mitochondrial genomes for comparative phylogenetics? A case study within spiders (Arthropoda: Araneae).PLoS ONE
8:e62404DOI 10.1371/journal.pone.0062404.
Burger G, Lavrov DV, Forget L, Lang FB. 2007.Sequencing complete mitochondrial and plastid genomes.Nature Protocols2:603–614DOI 10.1038/nprot.2007.59.
Cartwright P, Evans NM, Dunn CW, Marques AC, Miglietta MP, Schuchert P, Collins AG. 2008.Phylogenetics of Hydroidolina (Hydrozoa: Cnidaria).Journal of the Marine Biological
Association of the United Kingdom88:1663–1672DOI 10.1017/S0025315408002257.
Cartwright P, Nawrocki AM. 2010.Character Evolution in Hydrozoa (phylum Cnidaria). Integrative and Comparative Biology50:456–472DOI 10.1093/icb/icq089.
Collins AG. 2002.Phylogeny of Medusozoa and the evolution of cnidarian life cycles.Journal of Evolutionary Biology15:418–432DOI 10.1046/j.1420-9101.2002.00403.x.
Collins AG. 2009.Recent insights into cnidarian phylogeny.Smithsonian Contributions to Marine Sciences38:139–149.
Collins AG, Bentlage B, Lindner A, Lindsay D, Haddock SHD, Jarms G, Norenburg JL, Jankowski T, Cartwright P. 2008.Phylogenetics of Trachylina (Cnidaria: Hydrozoa) with new insights on the evolution of some problematical taxa.Journal of the Marine Biological
Association of the United Kingdom88:1673–1685DOI 10.1017/S0025315408001732.
Collins AG, Schuchert P, Marques AC, Jankowski T, Medina M, Schierwater B. 2006.
Medusozoan phylogeny and character evolution clarified by new large and small subunit rDNA data and an assessment of the utility of phylogenetic mixture models.Systematic Biology
55:97–115DOI 10.1080/10635150500433615.
Collins AG, Winkelmann S, Hadrys H, Schierwater B. 2005.Phylogeny of Capitata and Corynidae (Cnidaria, Hydrozoa) in light of mitochondrial 16S rDNA data.Zoologica Scripta
34:91–99DOI 10.1111/j.1463-6409.2005.00172.x.
Daly M, Brugler MR, Cartwright P, Collins AG, Dawson MN, Fautin DG, France SC,
Mcfadden CS, Opresko DM, Rodriguez E, Romano SL, Stake JL. 2007.The phylum Cnidaria: a review of phylogenetic patterns and diversity 300 years after Linnaeus*.Zootaxa182:127–128.
Darriba D, Taboada GL, Doallo R, Posada D. 2011.ProtTest 3: fast selection of best-fit models of protein evolution.Bioinformatics27:1164–1165DOI 10.1093/bioinformatics/btr088.
Darriba D, Taboada GL, Doallo R, Posada D. 2012.jModelTest 2: more models, new heuristics and parallel computing.Nature Methods9:772DOI 10.1038/nmeth.2109.
Deng W, Maust BS, Nickle DC, Learn GH, Liu Y, Heath L, Pond SLK, Mullins JI, Kosakovsky Pond SL, Mullins JI. 2010.DIVEIN: a web server to analyze phylogenies, sequence divergence, diversity, and informative sites.BioTechniques48:405–408DOI 10.2144/000113370.
Dettai A, Gallut C, Brouillet S, Pothier J, Lecointre G, Debruyne R. 2012.Conveniently pre-tagged and pre-packaged: extended molecular identification and metagenomics using complete metazoan mitochondrial genomes.PLoS ONE7:e51263DOI 10.1371/journal.pone.0051263.
Dunn CW. 2009.Quick guide Siphonophores Essay Binding reactions: epigenetic switches, signal transduction and cancer.Current Biology19:233–234DOI 10.1016/j.cub.2009.02.009.
Dunn CW, Pugh PR, Haddock SHD. 2005.Molecular phylogenetics of the siphonophora (Cnidaria), with implications for the evolution of functional specialization.Systematic Biology
54:916–935DOI 10.1080/10635150500354837.
Ender A, Schierwater B. 2003.Placozoa are not derived cnidarians: evidence from molecular morphology.Molecular Biology and Evolution20:130–134DOI 10.1093/molbev/msg018.
Foox J, Brugler M, Siddall ME, Rodr´ıguez E. 2015.Multiplexed pyrosequencing of nine sea anemone (Cnidaria: Anthozoa: Hexacorallia: Actiniaria) mitochondrial genomes.Mitochondrial DNA1736:1–7DOI 10.3109/19401736.2015.1053114.
Giardine B, Riemer C, Hardison RC, Burhans R, Elnitski L, Shah P, Zhang Y, Blankenberg D, Albert I, Taylor J, Miller W, Kent WJ, Nekrutenko A. 2005.Galaxy: a platform for interactive large-scale genome analysis.Genome Research15:1451–1455DOI 10.1101/gr.4086505.
Gissi C, Pesole G. 2003.Transcript mapping and genome annotation of ascidian mtDNA using EST data.Genome Research13:2203–2212DOI 10.1101/gr.1227803.
Goecks J, Nekrutenko A, Taylor J. 2010.Galaxy: a comprehensive approach for supporting accessible, reproducible, and transparent computational research in the life sciences.Genome
Guindon S, Dufayard J-FF, Lefort V, Anisimova M, Hordijk W, Gascuel O. 2010.New algorithms and methods to estimate maximum-likelihood phylogenies: assessing the performance of PhyML 3.0.Systematic Biology59:307–321DOI 10.1093/sysbio/syq010.
Hahn C, Bachmann L, Chevreux B. 2013.Reconstructing mitochondrial genomes directly from genomic next-generation sequencing reads–a baiting and iterative mapping approach.Nucleic Acids Research41:e129DOI 10.1093/nar/gkt371.
Hyman LH. 1940. The Invertebrates, Volume 1. Protozoa through Ctenophora. New York: McGraw-Hill Book Company.
Katoh K, Standley DM. 2013. MAFFT multiple sequence alignment software version 7: improvements in performance and usability.Molecular Biology and Evolution30:772–780 DOI 10.1093/molbev/mst010.
Katoh K, Toh H. 2008.Recent developments in the MAFFT multiple sequence alignment program. Briefings in Bioinformatics9:286–298DOI 10.1093/bib/bbn013.
Kayal E, Bentlage B, Collins AG, Kayal M, Pirro S, Lavrov DV. 2012.Evolution of linear mitochondrial genomes in medusozoan cnidarians.Genome Biology and Evolution4:1–12 DOI 10.1093/gbe/evr123.
Kayal E, Lavrov DV. 2008.The mitochondrial genome ofHydra oligactis(Cnidaria, Hydrozoa) sheds new light on animal mtDNA evolution and cnidarian phylogeny.Gene410:177–186 DOI 10.1016/j.gene.2007.12.002.
Kayal E, Roure B, Philippe H, Collins AG, Lavrov DV. 2013.Cnidarian phylogenetic relationships as revealed by mitogenomics.BMC Evolutionary Biology13:5DOI 10.1186/1471-2148-13-5.
Kearse M, Moir R, Wilson A, Stones-Havas S, Cheung M, Sturrock S, Buxton S, Cooper A, Markowitz S, Duran C, Thierer T, Ashton B, Meintjes P, Drummond A. 2012.Geneious Basic: an integrated and extendable desktop software platform for the organization and analysis of sequence data.Bioinformatics28:1647–1649DOI 10.1093/bioinformatics/bts199.
Langmead B, Salzberg SL. 2012.Fast gapped-read alignment with Bowtie 2.Nature Methods
9:357–359DOI 10.1038/nmeth.1923.
Laslett D, Canb¨ack B. 2008.ARWEN: a program to detect tRNA genes in metazoan mitochondrial nucleotide sequences.Bioinformatics24:172–175DOI 10.1093/bioinformatics/btm573.
Lecl`ere L, Schuchert P, Cruaud C, Couloux A, Manuel M. 2009.Molecular phylogenetics of Thecata (Hydrozoa, Cnidaria) reveals long-term maintenance of life history traits despite high frequency of recent character changes.Systematic Biology58:509–526
DOI 10.1093/sysbio/syp044.
Lowe TM, Eddy SR. 1997.tRNAscan-SE: a program for improved detection of transfer RNA genes in genomic sequence.Nucleic Acids Research25:955–964DOI 10.1093/nar/25.5.0955.
Marques AC, Collins AG. 2004.Cladistic analysis of Medusozoa and cnidarian evolution. Invertebrate Biology123:23–42DOI 10.1111/j.1744-7410.2004.tb00139.x.
Mercer TR, Neph S, Dinger ME, Crawford J, Smith MA, Shearwood A-MJ, Haugen E, Bracken CP, Rackham O, Stamatoyannopoulos JA, Filipovska A, Mattick JS. 2011.The human mitochondrial transcriptome.Cell146:645–658DOI 10.1016/j.cell.2011.06.051.
Nawrocki AM, Collins AG, Hirano YM, Schuchert P, Cartwright P. 2013. Phylogenetic placement ofHydraand relationships within Aplanulata (Cnidaria: Hydrozoa).Molecular Phylogenetics and Evolution67:60–71DOI 10.1016/j.ympev.2012.12.016.
Ojala D, Montoya J, Attardi G. 1981.tRNA punctuation model of RNA processing in human mitochondria.Nature290:470–474DOI 10.1038/290470a0.
Park E, Hwang D-S, Lee J-S, Song J-I, Seo T-K, Won Y-J. 2012.Estimation of divergence times in cnidarian evolution based on mitochondrial protein-coding genes and the fossil record. Molecular Phylogenetics and Evolution62:329–345DOI 10.1016/j.ympev.2011.10.008.
R Core Team. 2014.R: a language and environment for statistical computing. Vienna: R Foundation for Statistical Computing. 2012.
Ronquist F, Teslenko M, Van der Mark P, Ayres DL, Darling A, H¨ohna S, Larget B, Liu L, Suchard MA, Huelsenbeck JP. 2012.MrBayes 3.2: efficient Bayesian phylogenetic inference and model choice across a large model space.Systematic Biology61:539–542
DOI 10.1093/sysbio/sys029.
Schuchert P. 2001.Hydroids of Greenland and Iceland (Cnidaria, Hydrozoa).Meddelelser om Grønland, Bioscience53:1–184.
Schuchert P. 2015.Hydroidolina. Accessed through: World Hydrozoa database athttp://www. marinespecies.org/hydrozoa/aphia.php?p=taxdetails&id=19494on 2015-07-09.Available athttp:/ /www.marinespecies.org/hydrozoa/aphia.php?p=taxdetails&id=19494.
Shimodaira H, Hasegawa M. 2001.CONSEL: for assessing the confidence of phylogenetic tree selection.Bioinformatics17:1246–1247DOI 10.1093/bioinformatics/17.12.1246.
Smith DR, Kayal E, Yanagihara AA, Collins AG, Pirro S, Keeling PJ. 2012.First complete mitochondrial genome sequence from a box jellyfish reveals a highly fragmented, linear architecture and insights into telomere evolution.Genome Biology and Evolution4:52–58 DOI 10.1093/gbe/evr127.
Stamatakis A. 2014.RAxML version 8: a tool for phylogenetic analysis and post-analysis of large phylogenies.Bioinformatics30:1312–1313DOI 10.1093/bioinformatics/btu033.
Suyama M, Torrents D, Bork P. 2006.PAL2NAL: robust conversion of protein sequence alignments into the corresponding codon alignments.Nucleic Acids Research34:W609–W612 DOI 10.1093/nar/gkl315.
Talavera G, Castresana J. 2007.Improvement of phylogenies after removing divergent and ambiguously aligned blocks from protein sequence alignments.Systematic Biology56:564–577 DOI 10.1080/10635150701472164.
Voigt O, Erpenbeck D, W¨orheide G. 2008.A fragmented metazoan organellar genome: the two mitochondrial chromosomes of Hydra magnipapillata.BMC Genomics
9:350DOI 10.1186/1471-2164-9-350.
Xia X. 2013.DAMBE5: a comprehensive software package for data analysis in molecular biology and evolution.Molecular Biology and Evolution30:1720–1728DOI 10.1093/molbev/mst064.
Xia X, Xie Z, Salemi M, Chen L, Wang Y. 2003.An index of substitution saturation and its appli-cation.Molecular Phylogenetics and Evolution26:1–7DOI 10.1016/S1055-7903(02)00326-3.
Zapata F, Goetz FE, Smith SA, Howison M, Siebert S, Church SH, Sanders SM, Ames CL, McFadden CS, France SC, Daly M, Collins AG, Haddock SH, Dunn CW, Cartwright P. 2015.Phylogenomic analyses support traditional relationships within Cnidaria.PLoS ONE
10:e0139068DOI 10.1371/journal.pone.0139068.
Zou H, Zhang J, Li W, Wu S, Wang G. 2012.Mitochondrial genome of the freshwater jellyfish
Craspedacusta sowerbyiand phylogenetics of Medusozoa.PLoS ONE7:e51465