CORRECTION
Correction: The Mitochondrial Genomes of
Aquila fasciata
and
Buteo lagopus
(Aves,
Accipitriformes): Sequence, Structure and
Phylogenetic Analyses
Lan Jiang, Juan Chen, Ping Wang, Qiongqiong Ren, Jian Yuan, Chaoju Qian,
Xinghong Hua, Zhichun Guo, Lei Zhang, Jianke Yang, Ying Wang, Qin Zhang,
Hengwu Ding, De Bi, Zongmeng Zhang, Qingqing Wang, Dongsheng Chen, Xianzhao Kan
There is an error in the seventh sentence of the Abstract. It should read: The highest dN/dS
was detected for the MT-ATP8 gene (0.29896) among Accipitridae, while the lowest for the
MT-CO1 gene (0.01546).
There is an error in the third sentence of the "Rates and patterns of mitochondrial gene
evo-lution within Accipitridae" section of the Results and Discussion. It should read: In the protein
coding region, the most variable region of the genomes by percent variable sites is MT-ATP8,
followed by MT-ND4 and MT-ND6.
The images for Figs
3
and
4
are incorrectly switched. The image that appears as
Fig 3
should
be
Fig 4
, and the image that appears as
Fig 4
should be
Fig 3
. The figure captions appear in the
correct order. Please view the figures with their correct captions here.
PLOS ONE | DOI:10.1371/journal.pone.0141037 October 15, 2015 1 / 3
OPEN ACCESS
Citation:Jiang L, Chen J, Wang P, Ren Q, Yuan J, Qian C, et al. (2015) Correction: The Mitochondrial Genomes ofAquila fasciataandButeo lagopus (Aves, Accipitriformes): Sequence, Structure and Phylogenetic Analyses. PLoS ONE 10(10): e0141037. doi:10.1371/journal.pone.0141037
Published:October 15, 2015
Copyright:© 2015 Jiang et al. This is an open access article distributed under the terms of the
Fig 3. Base composition ofA.fasciataandB.lagopusmitochondrial genomes.AT skew and GC skew are calculated for each protein-coding gene and other gene regions.
doi:10.1371/journal.pone.0141037.g001
Reference
1. Jiang L, Chen J, Wang P, Ren Q, Yuan J, Qian C, et al. (2015) The Mitochondrial Genomes ofAquila fasciataandButeo lagopus(Aves, Accipitriformes): Sequence, Structure and Phylogenetic Analyses. PLoS ONE 10(8): e0136297. doi:10.1371/journal.pone.0136297PMID:26295156
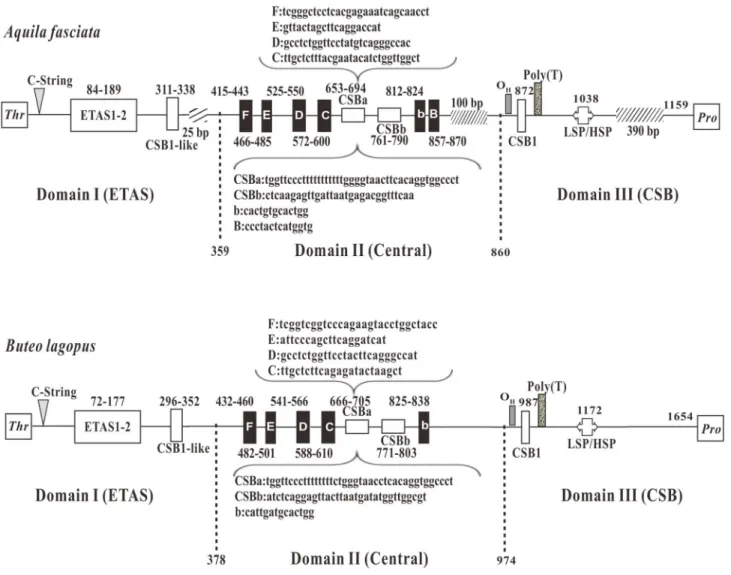
Fig 4. The structures of control region (CR) in mtDNA ofA.fasciataandB.lagopus.Positions of the conserved boxes and the division into the three domains Domain I (ETAS), Domain II (Central), Domain III (CSB) are shown. ETAS = extended termination-associated sequences; F through B boxes = conserved sequence boxes in the central domain, CSBa is highly conserved stretches that vary in length, while CSBb is more variable;
CSB = conserved sequence block; CSB-like = a sequence similar to the CSB; LSP = light-strand transcription promoter; HSP = heavy-strand transcription promoter; twill box means the comparison of two CRs, the lack of base number.
doi:10.1371/journal.pone.0141037.g002