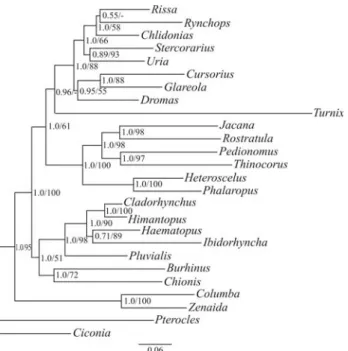
The enigmatic monotypic crab plover Dromas ardeola is closely
Texto
Imagem
Documentos relacionados
Hospitalization brings on troubled times in family relationships as attention is focused on the ostomy patient; nevertheless, the relatives also need support and guidance from
Figure 1 - Diagram illustrating the phylogenetic relationships among some species within the fasciola subgroup and between the subgroups in the repleta group (modified from
ecological relationships, geographic distribution, species richness, and phylogenetic position.. within
A phylogenetic analysis based on the complete mito- genome data from six platyrrhine species ( A. sciureus ) in conjunction with ML and Bayesian methods supported the
Bayesian inference and maximum par- simony analyses of these sequences identify the same groupings as before and provide further evidence to support the following observations:
Molecular inferences from 4 loci for the fungus and 1 locus for the photobiont and statistical analyses within a phylogenetic framework support the following: (a) several switches
O objectivo deste trabalho foi estabelecer a relação entre o tipo de enzima e a extensão da reacção de hidrólise e as características dos hidrolisados proteicos obtidos a partir de
In this context, several studies show that the parturients need continuous support throughout the delivery process and that, when this support is provided by a family member, women
