Abstract—When there are a lot of requests for resources in a grid system, it is essential to make a good planning and resources allocation to provide a suitable QOS. As different programs need different amounts of services based on their priorities, there are various methods to provide these requests by choosing suitable allocation to optimize total work of system. In this study, some parameters such as priority, delay, assurance ability and cost are determined to maximize the system’s efficiency and properly distribute resources based on services priority. Then an optimizing algorithm will be suggested to select grid resource based on hybrid of genetic and simulated annealing algorithms. As tentative results obtained by experiments show, the performance of this method increase 10-15% compared with each genetic algorithm and simulated annealing methods.
Index Terms—Grid system, selection of resources, quality of service, Genetic Algorithm, Simulated Annealing.
I. INTRODUCTION
The grid system expanded these years is considered a network infrastructure. It can integrate distributed resources and develop a higher layer of distributed resource communized environment. The efficiency of the grid system may change dynamically by resources competition and uncertainty. To develop remarkable quality of (QOS) service, one of three standards would be grid [1]. Therefore, grid’s resource and the allocation based on QOS is one of the key matters in grid computing. Nevertheless traditional methods of job scheduling such as backfilling and FCFS can not be matched with grid resources features like allocation of resources to programs based on services priority, dynamic features of resources and to parallel the resources allocation determination.
A study indicates a job scheduling algorithm based on GA [3]. Its proposal improves the amount of resources usage and permittivity compared with traditional methods. Another research sis suggested based on SA which has made job planning on the basis of the amount of latency and assurance ability [4]. It solves some problems like local
1Hossein Shirgahi is faculty member of department computer, Islamic
Azad University, Jouybar Branch, Jouybar, Iran(corresponding author to provide phone: 0098-124-3363191; fax: 0098-124-3363190; e-mail: h.shirgahi@ Jouybariau.ac.ir).
2
Malihe Danesh is M.S. student of Ferdowsi University of Mashhad, Mashhad, Iran, [email protected].
3Najmeh Danesh is faculty member of department computer, Islamic
Azad University, Sari Branch, Sari, Iran, [email protected]
search and hasty convergence well. So it increases the total system’s efficiency.
In another research, an optimizing grid resources selection algorithm providing QOS by GASA algorithm is suggested [5]. This method allocates grid resources to jobs based on the amount of latency, assurance ability and the amount of cost. It develops optimizing resource selection based on GASA to increase efficiency. This method is better than the previous one because it uses both GA and SA advantages. This research uses GASA algorithm to optimize resources selection and expands the method of [5] by applying eight priority levels. In section 2, QOS parameters in grid system, in section 3, resources selection algorithm, in section 4, the experiments and implementations, and in section 5, the results and conclusions will be expressed.
II. QOS PARAMETERS IN THE GRID SYSTEM
A. Describing QOS parameters in grid system
In order to build the model easier, we only Some important features in mind and took the rest of QoS
parameters Did not express, of course, other parameters can be also extended the same method. Here are some important parameters of QOS to clarify the method r:
- Latency: the time between asking for a request and
receiving successful result of that
- Assurance ability: the rate of performing jobs
successfully by a resource.
- Cost: the cost paid by a user when he/she needs a
resource.
- Priority: jobs have priorities based on their
importance and work. So they need different services. The scheduler should allocate resources to the jobs by the levels of priorities.
QOS based on four above-mentioned parameters:
Delay: time between work posts
Request a need to obtain a successful result in the need to get it is desired.
Reliability: the success rate of doing things is called by one source.
Price: to spending when the user must pay a resource needs.
Grid Resource Selection Optimization with
Guarantee Quality of Service by Hybrid of
Genetic and Simulated Annealing Algorithms
1
Priority: importance and types of jobs based on performance in the system have different priorities and different levels based on the need Scheduler service must be used to allocate resources to priority levels of jobs pay.
Therefore, QoS can be expressed with four parameters to be expressed as follows:
B.measuring QoS parameters in the Grid
For every property QOS, to digitize its different values, it must be using a series of formulas to calculate.
delay comprises three sections: network transfer time (ttran),
scheduling system time (tsch ) and computing time (tcom) is
calculated. Total delay obtained based on formula 1. ) 1 ( com sch tran
delay
t
t
t
q
Reliability n th time that a service request is based on the amount of n-1 times the previous step that request has been successfully obtained according to the formula is 2.
)
2
(
1
)
(
)
(
1 1
n
q
q
n i i y reliabilit n y reliabilitPrice is a feature directly on resources by different users are determined.
Nowadays Growth Fast Networks, Concepts As Need Increasing To Width Band And Support Simultaneously Different classes Service At Degree First Importance Were Have, At Result Quality Service To Factor Key Used Making Networks And Services Nowadays Conversion By Is. Based on this work in accordance with the required quality of service Quality of service priority levels are different in this study eight different levels of priority service is considered in Table 1 can see what level of priority should be to provide more quality service desired requires less delay and reliability is more important and low cost will be reduced.
Table 1: Quality of service priority levels with parameters of importance of delay, reliability and cost
C. Standardizing QoS
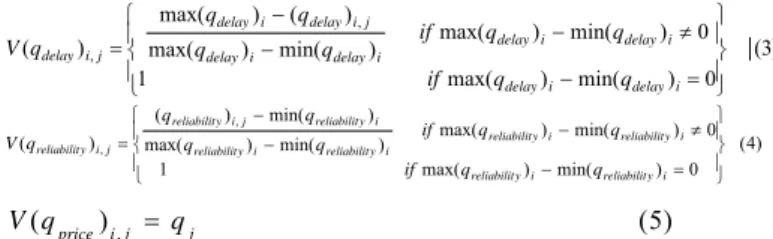
Above criteria can be divided into three classes [6]. Delay value that is much more if QOS is lower, can be standardized by equation 3. Reliability has a direct relation with the QOS value and can be standardized according to equation 4. The price based on equation 5 is standardized. In this equation Number i represents the i-th service invoking and number j represents the j-th resource.
) 3 ( 0 ) min( ) max( 1 0 ) min( ) max( ) min( ) max( ) ( ) max( ) ( , , i delay i delay i delay i delay i delay i delay j i delay i delay j i delay q q if q q if q q q q q V ) 4 ( 0 ) min( ) max( 1 0 ) min( ) max( ) min( ) max( ) min( ) ( ) ( , , i y reliabilit i y reliabilit i y reliabilit i y reliabilit i y reliabilit i y reliabilit i y reliabilit j i y reliabilit j i y reliabilit q q if q q if q q q q q V ) 5 ( ) (
,j j i
price q
q
V
Must be present according to Table 1, based on priority levels of service quality, importance of each parameter delay, reliability and price according to the weight corresponding to each parameter set, so the overall cost of service that the service i have my source j can receive according to equation 6 is obtained.
) 6 ( ) ( ) ( * ) ( * ) ( , , , j i price price j i y reliabilit y reliabilit j i delay delay
i V q V q V q
q
V
In equation 6 Total weights for delay parameters, reliability and price is equal to 1.
D. Describes the structures of research
We assume that our source of n R = (R 1, R 2, ..., R n) and m
do T = (T 1, T 2, ..., T m) there. Quadric To build a set of
resources R, T set of tasks, Q a matrix with m rows and n columns and q i, j Indicates that QOS Yi T i R j from Are
Is, A matrix with one row allocation and m is the column. General service charge according to equation 6 is obtained. The main goal of this model to determine the allocation of resources as a policy system to create the most expensive service.
III. RESOURCE SELECTION ALGORITHMS
A. An introduction to genetic algorithms (GA)
Algorithms Genetics Tool Are Be By It Are Can. Evolutionary development mechanism Like Building Certified. This Operation With Search Space Problem Direction By Good answer And Not Necessarily Optimum Face Accept [7]. Genetic algorithms have the following steps are:
1- Encryption: The process of encoding one of the most important parts of problem solving is by genetic algorithm. Often when the genetic algorithm is used to solve problems to find a suitable display of the answer so easily respond to all issues related to problem solving by Genetic Algorithm is difficult. The process leading to the production of the population are being answered by the show chromosomal Priority level Service Type Weight delay parameter Weight parameter reliability Parameter weight price
0 Best Effort 0.2 0.2 0.6
1 Background 0.25 0.25 0.5
2 Standard 0.3 0.3 0.4
3 Excellent Load 0.35 0.35 0.3
4 Controlled Load 0.38 0.42 0.2
5 Voice and Video 0.4 0.45 0.15
6
Layer 3 Network Control Reserved
Traffic
0.42 0.48 0.1
7
Layer 2 Network Control Reserved
Traffic
problem has answers. That shows a variety of fields such as binary, some grapheme strings, permutations, and ... View answers for chromosomal problem exists [8].
In this paper, an indirect method of encryption is used, the coding of each work determines what services will be the source, the structure of chromosome length equal to the number of jobs in the system is and the amount of each chromosome determines the number corresponding to a resource that the service works is, the overall structure of chromosomes can see in Figure 1.
Figure 1: Overall structure of chromosomes
2- Start: a population number Chromosome number Chromosome K-dependent nature of the problem is, at this stage will develop. Initial production of chromosomes is random.
3- Returns value: The production of basic population, should any member of this population can be attributed a value, this work by an evaluation function is done. Solve a problem by genetic algorithm to find a good way to value a week and appropriate evaluation function is very important. In this paper evaluation function is based on equation 7.
m
i i
q V F
1
) 7 ( )
(
4- Create a new population: In this stage the most important steps to solve a problem is by genetic algorithms. Since the selection of primary and scattered population in the problem search space can not point a new search to find space and population in the search optimum solution to lead at this stage by using genetic operators such as Crossover and Mutation and evolution of the system inspired by nature, a new population using the initial population is created and then searched the space given. principles work at this stage thus important that an initial population of K value to each of them using the following steps, a new population is created.
a) selection: According to Darwin's theory that the best survive and reproduction and to produce new individuals. By genetic algorithm in solving the same theory applies. Thus for the population must act Crossover between two chromosomes from the population to choose between the Crossover can act on their actions and we achieved our new children. Choose from discuss important topics discussed are genetic algorithm. Different methods for action selection has been presented so far include: random selection, Roulette wheel, Rank power are [9]. In this study, we based on the amount and value of each chromosome using the formula Rank Power 8 and 9 likely choice for each parent chromosome being obtains. Method Rank Power to then serves the worst chromosome value 1 and the second worst chromosome value 2 and so on until the end that best chromosome value K than let the K as the population is. And ultimately likely to select chromosomes i
according to formula 9 is obtained and based on the amount of each chromosome based Chances are, a few numbers from 1 to F will allocate. Now a function of a random number from 1 to F we choose, This number is reserved to each chromosome, the chromosome is selected.
) 8 ( ...
3 2
12 2 2 K2
F
) 9 ( 2
F
Ranki
b) Crossover: because of new production and distribution of population in space is the problem. This process model derived from genetic individuals that the population in nature, causing a variety of individuals and individual differences and they are apparent and the genetic algorithm and solve problems caused scattered population in space can be searched. Crossover act with a certain probability if α accepts this possibility means that each person probably α Crossover will participate in practice. Crossover operation is done so that the two chromosomes or individual from a population in which search is selected in selection procedures in the previous post mentioned, two chromosomes are selected with Cross are given and two new chromosomes, or the child new to them among the population are located. Figure 2 View of the initial population and the population in search of secondary postoperative Crossover on two chromosomes can be observed. Crossover for various methods, such as a point, two point, multipoint and uniform there [9]. An example of two-point Crossover in Figure 3 can see.
Figure 2: View of the Crossover Effect of Population Distribution
Figure 3: Crossover Two Point
linked them from far to near local optimum. This method to save an entirely random chromosomes from this undesirable situation offers (Figure 4).
Figure 4: View of the overall work Mutation
Mutation operation many ways act like a Point Mutation, two point, there is some point [9]. An example of multi-point operation Mutation in Figure 5 can see.
Figure 5: Mutation multipoint
5- Replace: previous stages by using genetic operators attempting to create a new population and put them on the space issue has been done. But if this be done with long sharp population increase we are facing so many people crowd after each new generation, the initial population will be reduced K, for this population based on the amount of current competence (Fitness) and they will sort through them with valuable Thai K for later generation and search as the initial population is selected.
6- Assessment: A way to achieve genetic algorithms with other algorithms is different because instead of from the beginning on every effort to find the best answer will be, trying to answer the very first suggestion that although the optimal not continue its work and if you could answer this question needs to be some limits to satisfy user requirements and to meet, in this case the algorithm stops, otherwise still continue to work does the number of procedures performed in this article from the first issue and we are determined to a certain frequency can be implemented.
B. Introduction to the Simulated Annealing algorithm (SA)
Simulated Annealing Algorithm, natural cooling process of the simulation will slow, with a random starting point in the search space begins. If you change the new state space problem for good, it accepts new changes otherwise change state if the order was a bad evaluation function rates for new value was less than previous values, this change based on the Boltzmann probability accept to [4]. In this article, to avoid local optimum and premature end to avoid local SA algorithm crossover and mutation operation in GA algorithm used took the details of which are expressed in 3-3.
C. Designed to optimize selection under GSAA
For design optimization under GSAA selection process took into consideration the following:
1. An initial population size of K randomly let. 2. An initial temperature temp 0 And a convergence
factor a (0 <a <1) we consider, each new stage of the new temperature based on equation 10 is obtained. The experimental temperature temp0 = 1000, a =
0.95 and temp= 1 consider ourselves.
tempi1tempi*a (10)
3. A specific chromosome during the process of mutation and crossover is created and then we will choose the amount and value of new chromosomes based on previous evaluation function obtains. 4. Based on the values obtained for the cost function,
the difference between new and previous value according to equation 11 obtains.
costcostnewcostold (11)
5. If , The new design is better and allocate it to the list of projects put things.
6. But if , The previous design is better in this case, the probability according to Boltzmann equation, we calculated 12. Where k Boltzmann constant and temperature temp is running. Then a random number r between 0 and 1 can create, if The new plan was to list things allocation schemes can be added.
pexp(cost/(k*temp)) (12)
Process expressed in the number specified in the program will continue and at the end of the best chromosome obtained as the desired choice for the allocation of tasks will display.
IV. IMPLEMENTATION AND TESTING
Approach expressed in this article using the software in Windows XP Delphi7 implementation, we implemented the program receive up to 200 sources and the ability to do 1000 is an independent. The implementation of tasks and resources and parameters are randomized to receive, reliable sources randomly between 0.75 to 1 we have considered. Priority tasks randomly between 0 to 7 priority levels are determined, the price of random sources between 10 and 500 are determined, performing random time between 10 and 250 is considered the delay to 1 in 200 has been considered.
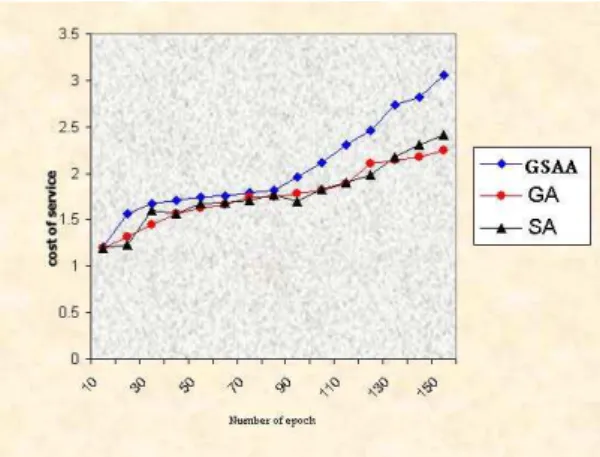
Figure 6: The relationship between frequency and cost of service
V. CONCLUSION
Experiments indicate that the presented GASA algorithm is more efficient than GA and SA algorithms and its responses are 10-15% more optimal.
It would be worthwhile to mention that by increasing proposed algorithm, desirable responses will be achieved rather than other methods.
The suggestions are:
1- to combine some other evolutionary development methods such as PSO and GELS with the present method to improve it.
2- to consider more parameters to determine QOS such as security, deadline and usage of this method.
ACKNOWLEDGMENT
We thanks from Financial support of Islamic Azad University, Jouybar Branch.
REFERENCES
[1] Foster I, "What is The Grid? ",A Three Point Checklist.http://www.fp.mcs.anl.gov/ Foster [EB/OL], July 20, 2005. [2] YE Qing-hua, LIANG Yi, MENG Dan. "A Simplified Backfilling
Algorithm Based on First Fit- RB-FIFT[J]".Computer Engineering and Applications,2003,39(2):70-74
[3] Vincenzo Di Martino, M Mililotti. "Sub optimal scheduling in a grid using genetic algorithms", Parallel Computing, 2004, 30: 553-565. [4] Ajith Abraham, Rajkumar Buyya. "Nature’s heuristics for scheduling
jobs on computational grids", In The 8th Int’l Conf on Advanced Computing and Communications (A-DCOM 2000), Cochin, India, 2000:45-52.
[5] QI Ning, WANG Binqiang and WEI Shuai, "aware GASA:A QoS-aware Grid Resource Selection Optimization Algorithm", In The 15th Int’ Conf on Advanced Computing and Communications , china 2009. [6] Zeng L.Z, Benatallah B., A.Ngu H.H. "QoS- aware middleware for web
services composition". IEEE Transactions on software engineering. 2004,30(5):311-327.
[7] Dianati M. and Song I. , " An Introduction to Genetic Algorithms and Evolution Strategies", University of Waterloo , Canada , 2002. [8] Jean P., " Genetic Algorithm Viewer : Demonstration of a Genetic
Algorithm”, SIGMOD 2000, May 2000.