Ligamentum Flavum Hypertrophy in
Asymptomatic and Chronic Low Back Pain
Subjects
Justin J. Munns☯¤a, Joe Y. B. Lee☯¤b, Alejandro A. Espinoza Orías☯, Ryota Takatori☯,
Gunnar B. J. Andersson☯, Howard S. An☯, Nozomu Inoue☯*
Department of Orthopedic Surgery, Rush University Medical Center, Chicago, Illinois, United States of America
☯These authors contributed equally to this work.
¤a Current address: Department of Orthopaedics, Ohio State University, Wexner Medical Center, Columbus, Ohio, United States of America
¤b Current address: Private Practice, Orange, California, United States of America
Abstract
Purpose
To examine ligamentum flavum thickness using magnetic resonance (MR) images to eval-uate its association with low back pain symptoms, age, gender, lumbar level, and disc characteristics.
Materials and Methods
Sixty-three individuals were part of this IRB-approved study: twenty-seven with chronic low back pain, and thirty-six as asymptomatic. All patients underwent MR imaging and comput-ed tomography (CT) of the lumbar spine. The MR images at the mid-disc level were cap-tured and enlarged 800% using a bilinear interpolation size conversion algorithm that allowed for enhanced image quality. Ligamentum flavum thickness was assessed using bi-lateral medial and bi-lateral measurements. Disc height at each level was measured by the least-distance measurement method in three-dimensional models created by CT images taken of the same subject. Analysis of variance andt-tests were carried out to evaluate the relationship between ligamentum flavum thickness and patient variables.
Results
Ligamentum flavum thickness was found to significantly increase with older age, lower lum-bar level, and chronic low back pain (p<0.03). No difference in ligamentum flavum thick-ness was observed between right and left sided measurements, or between male and female subjects. Disc height and both ligamentum flavum thickness measurements showed low to moderate correlations that reached significance (p<0.01). Additionally, a moderate and significant correlation between disc degeneration grade and ligamentum flavum thick-ness does exist (p<0.001).
OPEN ACCESS
Citation:Munns JJ, Lee JYB, Espinoza Orías AA, Takatori R, Andersson GBJ, An HS, et al. (2015) Ligamentum Flavum Hypertrophy in Asymptomatic and Chronic Low Back Pain Subjects. PLoS ONE 10(5): e0128321. doi:10.1371/journal.pone.0128321
Academic Editor:Tian-wu Chen, Affiliated Hospital of North Sichuan Medical College, CHINA
Received:November 18, 2014
Accepted:April 26, 2015
Published:May 26, 2015
Copyright:© 2015 Munns et al. This is an open access article distributed under the terms of the
Creative Commons Attribution License, which permits
unrestricted use, distribution, and reproduction in any medium, provided the original author and source are credited.
Data Availability Statement:The data file is available at public repositoryFigshare.com. The assigned DOI is as follows:http://dx.doi.org/10.6084/
m9.figshare.1301159.
Funding:This work was supported by two National Institutes of Health grants: National Institute for Arthritis and Musculoskeletal and Skin Diseases
(www.niams.nih.gov) Grant No. P01-AR48152-10;
Conclusion
By measuring ligamentum flavum thickness on MR images at two different sites and com-paring degrees of disc degeneration, we found that ligamentum flavum thickness may be closely related to the pathogenesis of pain processes in the spine.
Introduction
Lumbar spinal stenosis represents a significant cause of pain and disability in the aging popula-tion. Compression of the neural elements occurs with changes in the local anatomy. Many studies suggest that the ligamentum flavum is a key factor in the pathogenesis of lumbar spinal stenosis [1–6]. The degenerative cascade which includes disc deterioration and facet joint ar-throsis, also leads to ligamentum flavum in-folding, hypertrophy, and fibrosis [2,4,7,8]. These changes have been associated with inflammatory changes as well as increased mechanical stresses [2,3,5,6,9–12].
Even though many studies have shown the significance of ligamentum flavum hypertrophy in patients with spinal stenosis or at the advanced stage of spondylosis, few studies have sys-tematically examined ligamentum flavum thickness and its relation to age and lumbar level at early stages of the degenerative cascade [1,5,13–16]. Previous studies measuring ligamentum flavum thickness have differed in their method of measurement, using either computed tomog-raphy (CT) or magnetic resonance (MR) imaging [2,5,13–16]. Most of these studies lack a direct comparison between patients with lumbar spinal stenosis and a control group. Further-more, attempts to quantify the thickness of the ligamentum flavum have used single measure-ments, ignoring possible differences in laterality and location of stenosis, i.e. central versus lateral. More importantly, few studies exist that examine the possible correlation between liga-mentum flavum thickness and other factors such as disc height and grade of disc degeneration.
Using enhanced MR images as well as bilateral medial and lateral measurements of ligamen-tum flavum thickness, the current study examined ligamenligamen-tum flavum thickness across differ-ent age groups from 20–60 years of age, gender, and lumbar level in individuals with and without low back pain symptoms. In addition, the effects of disc height and grade of disc de-generation on ligamentum flavum thickness were also analyzed.
Materials and Methods
Ethics Statement
A total of 63 volunteers were enrolled in this study (Rush University Medical Center IRB Ap-proval No. 00042801; study no. ORA L05090801) after providing written informed consent. The IRB-approved consent documents were signed both by the principal investigator and the subject and a copy was provided to the subjects. Study L05090801 is a larger study that probed the relationships between disc and facet degeneration and in vivo lumbar kinematics, which in-volved lumbar spine imaging (both CT and MR) of subjects in various torso positions (supine and axial rotation, as shown elsewhere[14,17–19]). One of the imaging modalities included in the study was MRI to evaluate the quality of the subjects’intervertebral discs. Since the field of view of the MRI data also includes the ligamentum flavum, it provided the authors with the necessary data for the analysis presented here.
Subject Inclusion/Exclusion Criteria
Each subject was screened by the authors for pre-existing lumbar spine pathology and pain epi-sodes in order to classify each subject as asymptomatic or symptomatic. Exclusion criteria for the asymptomatic group were ongoing low back pain, previous spinal surgery, history of low back pain, age over 60 years, obesity, or claustrophobia or other contraindication to MR or CT imaging. Inclusion criteria for the low back pain group were recurrent pain in the low back with at least two episodes each lasting at least 6 weeks and brought on by modest physical exer-tion. Reasons for exclusion in the low back pain group were prior surgery for back pain, age over 60 years, claustrophobia or other contraindication to MR and CT imaging, severe osteo-porosis, severe disc collapse at multiple levels, severe spinal stenosis, destructive process involv-ing the spine, litigation or compensation proceedinvolv-ings, extreme obesity, congenital spine defect, or previous spinal injury.
Image Data Acquisition and Post-processing
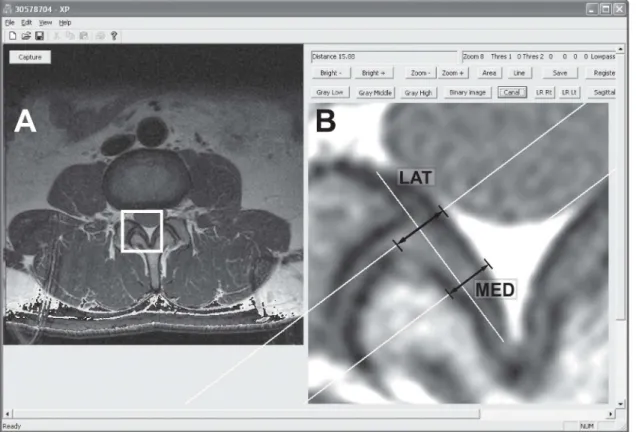
Magnetic resonance imaging was used to provide a cross-sectional view of the lumbar spinal canal from L1/2 to L5/S1. A 1.5-T MR (GE Excite 2, GE Healthcare, Milwaukee, WI) unit was used to obtain 3.0 mm-thick axial proton-density images using standard clinical protocol in which the slice orientation is parallel to the endplates at each disc level. The center slice (at mid-disc level) was selected for subsequent analysis from the axial images at each lumbar level from L1/2 to L5/S1. After selection, the MR images were analyzed by custom software written in Visual C++ (Microsoft Foundation Class). Ligamentum flavum images were captured and enlarged 800% using a bilinear interpolation size conversion algorithm that allowed for en-hanced image quality and provided a basis for more accurate measurement [17]. Ligamentum flavum thickness was assessed using bilateral medial and lateral measurements. To determine medial and lateral measurement locations, distances were measured from the lateral border of the ligamentum flavum to midline to define the length; with the medial measurement set at on-third of the length from midline, and the lateral measurement set at two-on-thirds of the length from midline. Measurement lines were perpendicular to ligamentum flavum length (Fig 1). Ligamentum flavum thickness was compared between right and left sides, and the data was pooled to form average thickness values. Average thickness by medial and lateral methods was examined by levels (L1-L5), age groups (20’s, 30’s, 40’s, 50’s), gender, and symptomatic versus asymptomatic. Disc height at each level was measured by the least-distance measurement method in three-dimensional models created by CT images taken for the same subject [14,20]. Disc grade was assessed on the mid-sagittal T2 MRI scan using the Pfirrmann classification [21]. Ligamentum flavum thickness data were then compared to disc height and disc grade (Pfirrmann classification) to assess for possible correlations.
Statistical Analysis
Pairedt-tests were used to compare thickness on left and right sides. Unpairedt-tests were used to compare measurements between genders and asymptomatic/symptomatic subjects. Differences based on age, spinal level and disc degeneration grade were analyzed using a one-way ANOVA with a Fischer’spost-hoctest. Correlation between the ligamentum flavum thick-ness and disc height was evaluated using linear regression analysis and Pearson’s correlation coefficients. Statistical significance was set at the level ofp<0.05. Results are presented as
Results
Lumbar Levels
A total of 63 individuals were studied, with 36 in the asymptomatic group, and 27 in the symp-tomatic group (mean age 31.9 ± 8.6 years and 41.2 ± 10.1 years, respectively). Demographic data are summarized inTable 1. In comparison of right versus left-sided ligamentum flavum thickness, differences were not significant by medial or lateral measures at any level. Right and left-sided thickness measures were compiled for average thickness, and are summarized in
Table 2. When examined by lumbar level, the overall trend was an increase in ligamentum fla-vum thickness by level caudally from L1/2 (labeled L1) to L4/5 (labeled L4). With the medial
Fig 1. Screen capture of the image analysis program interface.(A) An original PD MR image. The region of interest box (shown as a white square) is selected for analysis. (B) Bilinear interpolation result showing an 800% enlarged image. Arrows indicate lateral thickness (LAT) and medial (MED) thickness.
doi:10.1371/journal.pone.0128321.g001
Table 1. Demographic distribution among asymptomatic and low back pain patients. Percentages are calculated with respect to the total number of subjects.
Asymptomatic Low Back Pain Patients
Total Number 36 27
Males 23 (36.5%) 13 (20.6%)
Females 13 (20.6%) 14 (22.2%)
Age: 20s 17 (27.0%) 3 (4.8%)
Age: 30s 13 (20.6%) 14 (22.2%)
Age: 40s 4 (6.3%) 6 (9.5%)
Age: 50s 2 (3.2%) 7 (11.1%)
measurement, thickness was smallest at L1 and L5, and increased caudally from L2 to L4; statis-tical significance was found between all levels except L1 and L5 (p= 0.13). Using the lateral measurement, the order of ligamentum flavum thickness from least to greatest was L1, L2, L5, L3, and L4. Statistical significance was achieved at fewer levels than with the medial ligamen-tum flavum measure, with L1 thickness being significantly less than L3, L4, and L5; and L2 sig-nificantly less than L4. At all levels except L5/S1, medial ligamentum flavum thickness was greater than lateral ligamentum flavum thickness.
Gender
Average medial thickness of male subjects (3.30 ± 0.78 mm) was not significantly different from that of females (3.23 ± 0.93 mm;p= .5042). Similar results were obtained when compar-ing lateral thickness in males versus females (3.06 ± 0.66 mm versus 2.93 ± 0.64 mm, respec-tively,p= 0.078). This statistical trend was confirmed when the gender effects were further examined by level, a similar pattern emerged as male ligamentum flavum thickness was greater than female ligamentum flavum thickness, but without statistical significance:p= 0.4475 for the medial thickness andp= 0.0673 for the lateral thickness, respectively).
Age Groups
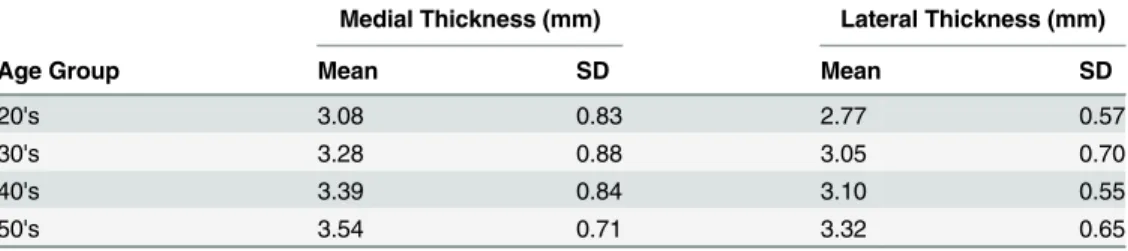
Medial and lateral ligamentum flavum thickness increased by age group (Table 2). Statistical significance varied by measurement method. For the medial measurement, the youngest group was significantly smaller than the two older groups (40s and 50s,p<0.03), whereas the lateral
measurement showed more differences, as follows: 20s<30s, 20s<40s, 20s<50s and 30s<50s,
p<0.0185. Age group differences were not subdivided by level due to the small sample size of
patients 50 years and older.
Low Back Pain Symptoms
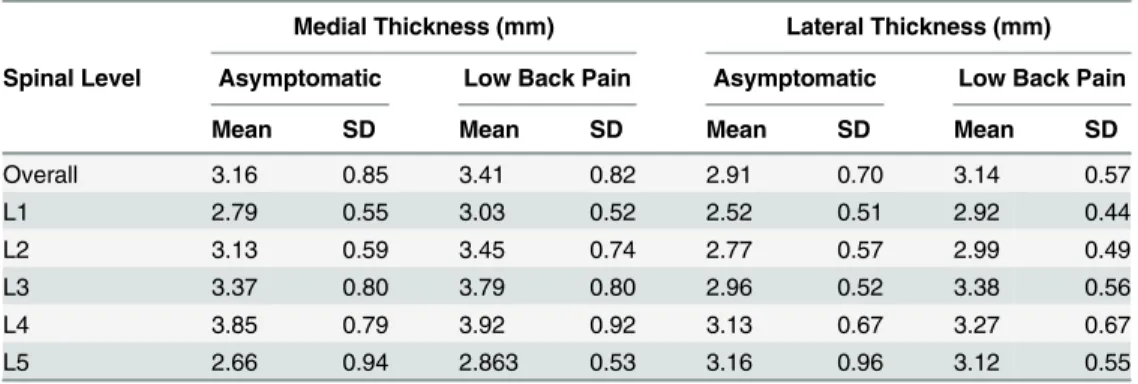
Results for the low back pain group versus the asymptomatic group are summarized inTable 3. Overall, greater medial thickness was found in symptomatic subjects (3.41 ± 0.82 mm) than in asymptomatic subjects (3.16 ± 0.85 mm;p= 0.0098). Lateral thickness in symptomatic patients (3.14 ± 0.57 mm) was also shown to be significantly greater than that in asymptomatic subjects (2.91 ± 0.70 mm), withp= 0.0019.
Thickness differences between low back pain and asymptomatic subjects were then exam-ined by level. It was found that low back pain subjects had slightly thicker medial ligamentum flavum in the upper lumbar all levels, except at L4 and L5 where thickness was almost equal and no significant differences were found (p= 0.74 andp= 0.32, respectively). These differ-ences were not significant at L1 and L2 (p= 0.08 andp= 0.06, respectively), however only L3 reached significance atp= 0.04 (Fig 2A). Using the lateral measurement, low back pain subjects had thicker ligamentum flavum at L1 (2.92 ± 0.44 mm) and L3 (3.38 ± 0.56 mm) compared to
Table 2. Mean (SD) thickness values by age group.
Medial Thickness (mm) Lateral Thickness (mm)
Age Group Mean SD Mean SD
20's 3.08 0.83 2.77 0.57
30's 3.28 0.88 3.05 0.70
40's 3.39 0.84 3.10 0.55
50's 3.54 0.71 3.32 0.65
asymptomatic subjects at L1 (2.52 ± 0.51 mm) and L3 (2.96 ± 0.52 mm), respectively. These differences reached statistical significance (p= 0.0018 andp<0.0031, respectively,Fig 2B).
Disc Height, Disc Grade
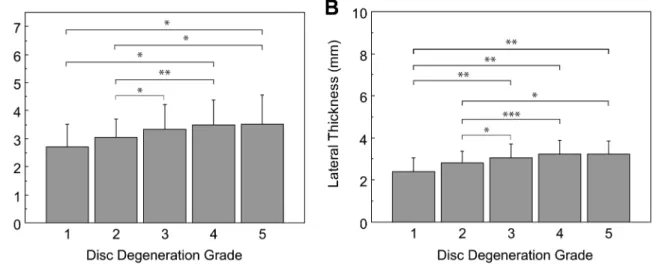
Medial and lateral ligamentum flavum measurements were related to disc height, and disc grade. Two-tailed Pearson correlation coefficients were calculated for the relationships between disc height and both medial and lateral ligamentum flavum thickness at each lumbar level, showing low but significant (r = 0.229,p<0.01) correlation between medial thickness and disc height,
and an even lower relationship between lateral thickness and disc height (r = 0.104,p= 0.067) that was not significant, but a trend nonetheless. It is worth noting that between both thickness measurements, a moderate correlation coefficient was obtained (r = 0.418. p<0.01). Thickness
measurements are associated with disc degeneration grade as shown inFig 3.
Discussion
Using MR imaging and custom-developed, spine specific measurement techniques, we exam-ined the thickness of the ligamentum flavum in asymptomatic and chronic low back pain
Table 3. Mean (SD) thickness among asymptomatic and low back pain patients.
Medial Thickness (mm) Lateral Thickness (mm)
Spinal Level Asymptomatic Low Back Pain Asymptomatic Low Back Pain
Mean SD Mean SD Mean SD Mean SD
Overall 3.16 0.85 3.41 0.82 2.91 0.70 3.14 0.57
L1 2.79 0.55 3.03 0.52 2.52 0.51 2.92 0.44
L2 3.13 0.59 3.45 0.74 2.77 0.57 2.99 0.49
L3 3.37 0.80 3.79 0.80 2.96 0.52 3.38 0.56
L4 3.85 0.79 3.92 0.92 3.13 0.67 3.27 0.67
L5 2.66 0.94 2.863 0.53 3.16 0.96 3.12 0.55
doi:10.1371/journal.pone.0128321.t003
individuals. In our series of 63 subjects, we found ligamentum flavum thickness differs between symptomatic and asymptomatic subjects and increases with higher disc degeneration grade, older age and lower lumbar level.
Ligamentum flavum thickness was measured at two different locations in the present study. Previous studies have not agreed upon a uniform method of measuring ligamentum flavum thickness. While certain studies have utilized an area averaging technique, others have assessed ligamentum flavum thickness using a single measurement located at the approximate“middle”
of the ligamentum flavum [2,5,13,15,16]. We believe the medial and lateral measurements provide a better understanding of how ligamentum flavum thickness varies and may affect symptomatology. Lateral ligamentum flavum thickness was significantly greater in low back pain subjects compared to asymptomatic subjects. Medial ligamentum flavum thickness was also greater in low back pain subjects, but the difference was not statistically significant. The finding that an increase in lateral ligamentum flavum thickness was more significant than me-dial ligamentum flavum thickness is also notable. This is reasonable, given the close proximity of the lateral measurement to the facet joint, where motion and instability are most appreciable. Lateral recess stenosis, which is a frequent finding in older patients with lumbar radiculopathy, may have an earlier basis with lateral thickening of the ligamentum flavum and low back pain. Additionally, both measurements were moderately correlated, which was an expected result. These findings of our study, together with the current literature, support the idea that early changes in the ligamentum flavum may play a key role in chronic low back pain symptoms.
While traditionally the focus of discussion has been on the bulging of the disc leading to compression of the cauda equina, there is growing evidence that identifies ligamentum flavum buckling and hypertrophy as the key pathologic feature of spinal stenosis. Hanssonet al. exam-ined 24 individuals using MRI before and after an external axial load. The authors found the ligamentum flavum to be the primary cause of canal encroachment, with bulging of the liga-ment leading to 50 to 85% of the reduction in canal area [22]. Since axial loading causes disc height loss [23], this study probed any possible correlations between disc height and the liga-mentum flavum thickness. However, no correlation was found between the disc height and the ligamentum flavum thickness in our series. Given that disc height loss associated with disc
Fig 3. Ligamentum flavum thicknessby disc grade.Error bars span one standard deviation. (A) Medial: Asterisks denote significant differences as follows:*p<0.05; and**p<0.001. Medial thickness in grade 3 tended to be larger than that in grade 1 (p = 0.0601). (B) Lateral: Asterisks denote
significant differences as follows:*p<0.05;**p<0.01, and***p<0.0001. Lateral thickness in grade 2 tended to be larger than that in grade 1 (p = 0.096). All other comparisons did not reach significance.
degeneration is a slow process, bulging of the ligamentum flavum may not occur under a grad-ual loss of disc height due to the elastic nature of the ligamentum flavum.
In contrast, the present study found a low, positive but significant correlation between liga-mentum flavum thickness anddisc grade(using the Pfirrmann classification system). The fact that moderate correlation coefficients were obtained between thickness measurements and disc height also shows that loss of disc height might be one of the contributing factors to instability associated with disc degeneration [18,19] and stenosis. Contribution of mechanical stresses to ligamentum flavum thickening has been reported in the literature. Sairyo et al. [5] used a multi-disciplinary approach to study the pathomechanism of ligamentum hypertrophy and found transforming growth factor-beta to be related to the stimulation of fibrosis and summarized the process of ligamentum flavum hypertrophy as beginning with mechanical stress inducing tissue damage, leading to inflammation and scarring, and finally fibrosis. Histologic studies have iden-tified inflammatory markers including tissue inhibitors of matrix metalloproteinases [11,24], microRNA molecules such as miR-155 [25] and increases in connective tissue growth factor [26] to be related to ligamentum flavum hypertrophy and fibrosis. Although pathogenesis of inflam-mation in the ligamentum flavum appears to be multifactorial, abnormal movements of the mo-tion segment could cause mechanical stress and, in tern, inflammatory reacmo-tion.
The limitations of our study may stem from the relatively small sample size and availability of MRI image data. Apost hocanalysis was completed to reveal a power of (1-ß) = 0.87. How-ever, it is still possible that this report may be underpowered to reveal differences that truly exist. The selection criteria for the low back pain group excluded subjects with severe disc col-lapse and stenosis. Although this serves to increase the specificity of our findings, the sensitivity of the study may have been compromised. Given that the parent study for this research was not designed to obtain normative data, our results might be limited due to relatively small sub-ject population. However, one of the intended contributions to the field via this report, is com-municating the development and use of this new method to quantify the thickness of the ligamentum flavum using clinically-available image sets. Future studies including individuals older than 60 years of age will shed light on the degenerative cascade of the spondylosis includ-ing ligamentum flavum hypertrophy.
With respect to the choice for the mid-image slice, alas, 3.0 mm is still thicker than ideal, but that comes also with the fact that it is practically the only slice available that captures the ligamentum flavum at mid disc. It is also, difficult to standardize and adjacent slices might not be consistent in terms of displaying the appropriate views, especially in the posterior processes. The scout view helped in choosing this image to account for orientation and location.
Conclusions
Direct relationships between increasing age, ligamentum flavum thickness and have been insinu-ated by others working in the field of spine biomechanics. Our study confirmed an increase in ligamentum flavum thickness both medially and laterally as age increased and as lumbar level in-creased (caudally), through the L4/5 level. The thickness at the L5/S1 level varied by method but was comparatively thicker using the lateral measurement. This finding may represent the degen-erative process in the ligamentum flavum that occurs with age and also supports the reactive na-ture of the ligamentum flavum to increased mechanical forces at the lower lumbar levels.
Author Contributions
References
1. Altinkaya N, Yildirim T, Demir S, Alkan O, Sarica FB. Factors associated with the thickness of the liga-mentum flavum: is ligaliga-mentum flavum thickening due to hypertrophy or buckling? Spine. 2011; 36(16): E1093–7. Epub 2011/02/24. doi:10.1097/BRS.0b013e318203e2b5PubMed PMID:21343862.
2. Fukuyama S, Nakamura T, Ikeda T, Takagi K. The effect of mechanical stress on hypertrophy of the lumbar ligamentum flavum. Journal of spinal disorders. 1995; 8(2):126–30. Epub 1995/04/01. PubMed PMID:7606119.
3. Kosaka H, Sairyo K, Biyani A, Leaman D, Yeasting R, Higashino K, et al. Pathomechanism of loss of elasticity and hypertrophy of lumbar ligamentum flavum in elderly patients with lumbar spinal canal ste-nosis. Spine. 2007; 32(25):2805–11. Epub 2008/02/05. doi:10.1097/BRS.0b013e31815b650fPubMed PMID:18246001.
4. Okuda T, Baba I, Fujimoto Y, Tanaka N, Sumida T, Manabe H, et al. The pathology of ligamentum fla-vum in degenerative lumbar disease. Spine. 2004; 29(15):1689–97. Epub 2004/07/31. PubMed PMID: 15284518.
5. Sairyo K, Biyani A, Goel V, Leaman D, Booth R Jr, Thomas J, et al. Pathomechanism of ligamentum fla-vum hypertrophy: a multidisciplinary investigation based on clinical, biomechanical, histologic, and bio-logic assessments. Spine. 2005; 30(23):2649–56. Epub 2005/12/02. PubMed PMID:16319751.
6. Schrader PK, Grob D, Rahn BA, Cordey J, Dvorak J. Histology of the ligamentum flavum in patients with degenerative lumbar spinal stenosis. European spine journal: official publication of the European Spine Society, the European Spinal Deformity Society, and the European Section of the Cervical Spine Research Society. 1999; 8(4):323–8. Epub 1999/09/14. PubMed PMID:10483836; PubMed Central PMCID: PMCPmc3611186.
7. Nachemson AL, Evans JH. Some mechanical properties of the third human lumbar interlaminar liga-ment (ligaliga-mentum flavum). Journal of biomechanics. 1968; 1(3):211–20. Epub 1968/08/01. PubMed PMID:16329292.
8. Sairyo K, Biyani A, Goel VK, Leaman DW, Booth R Jr, Thomas J, et al. Lumbar ligamentum flavum hy-pertrophy is due to accumulation of inflammation-related scar tissue. Spine. 2007; 32(11):E340–7. Epub 2007/05/15. doi:10.1097/01.brs.0000263407.25009.6ePubMed PMID:17495768.
9. Chen YT, Wei JD, Wang JP, Lee HH, Chiang ER, Lai HC, et al. Isolation of mesenchymal stem cells from human ligamentum flavum: implicating etiology of ligamentum flavum hypertrophy. Spine. 2011; 36(18):E1193–200. Epub 2011/02/24. doi:10.1097/BRS.0b013e3182053f58PubMed PMID: 21343850.
10. Moon HJ, Park YK, Ryu Y, Kim JH, Kwon TH, Chung HS, et al. The angiogenic capacity from ligamen-tum flavum subsequent to inflammation: a critical component of the pathomechanism of hypertrophy. Spine. 2012; 37(3):E147–55. Epub 2011/06/16. doi:10.1097/BRS.0b013e3182269b19PubMed PMID: 21673619.
11. Park JB, Chang H, Lee JK. Quantitative analysis of transforming growth factor-beta 1 in ligamentum fla-vum of lumbar spinal stenosis and disc herniation. Spine. 2001; 26(21):E492–5. Epub 2001/10/27. PubMed PMID:11679833.
12. Postacchini F, Gumina S, Cinotti G, Perugia D, DeMartino C. Ligamenta flava in lumbar disc herniation and spinal stenosis. Light and electron microscopic morphology. Spine. 1994; 19(8):917–22. Epub 1994/04/15. PubMed PMID:8009349.
13. Abbas J, Hamoud K, Masharawi YM, May H, Hay O, Medlej B, et al. Ligamentum flavum thickness in normal and stenotic lumbar spines. Spine. 2010; 35(12):1225–30. Epub 2010/03/11. doi:10.1097/ BRS.0b013e3181bfca15PubMed PMID:20216339.
14. Crane B, An HS, Ochia RS, Conrin S, Chen K, Andersson GB, et al. In vivo measurement of changes in lumbar intervertebral disc height distribution during torsion 52nd Annual Meeting of the Orthopaedic Re-search Society 2006; Chicago, IL: Orthopedic ReRe-search Society.
15. Safak AA, Is M, Sevinc O, Barut C, Eryoruk N, Erdogmus B, et al. The thickness of the ligamentum fla-vum in relation to age and gender. Clinical anatomy (New York, NY). 2010; 23(1):79–83. Epub 2009/ 11/27. doi:10.1002/ca.20883PubMed PMID:19941359.
16. Sakamaki T, Sairyo K, Sakai T, Tamura T, Okada Y, Mikami H. Measurements of ligamentum flavum thickening at lumbar spine using MRI. Archives of orthopaedic and trauma surgery. 2009; 129 (10):1415–9. Epub 2009/03/13. doi:10.1007/s00402-009-0849-1PubMed PMID:19280205.
18. Ochia RS, Inoue N, Renner SM, Lorenz EP, Lim TH, Andersson GB, et al. Three-dimensional in vivo measurement of lumbar spine segmental motion. Spine (Phila Pa 1976). 2006; 31(18):2073–8. PubMed PMID:16915091.
19. Ochia RS, Inoue N, Takatori R, Andersson GB, An HS. In vivo measurements of lumbar segmental mo-tion during axial rotamo-tion in asymptomatic and chronic low back pain male subjects. Spine (Phila Pa 1976). 2007; 32(13):1394–9. PubMed PMID:17545906.
20. Watanabe S, Inoue N, Yamaguchi T, Hirano Y, Espinoza Orias AA, Nishida S, et al. Three-dimensional kinematic analysis of the cervical spine after anterior cervical decompression and fusion at an adjacent level: a preliminary report. Eur Spine J. 2012; 21(5):946–55. Epub 2011/11/30. doi: 10.1007/s00586-011-2090-1PubMed PMID:22124708; PubMed Central PMCID: PMCPmc3337902.
21. Pfirrmann CW, Metzdorf A, Zanetti M, Hodler J, Boos N. Magnetic resonance classification of lumbar in-tervertebral disc degeneration. Spine (Phila Pa 1976). 2001; 26(17):1873–8. PubMed PMID:
11568697.
22. Hansson T, Suzuki N, Hebelka H, Gaulitz A. The narrowing of the lumbar spinal canal during loaded MRI: the effects of the disc and ligamentum flavum. European spine journal: official publication of the European Spine Society, the European Spinal Deformity Society, and the European Section of the Cer-vical Spine Research Society. 2009; 18(5):679–86. Epub 2009/03/12. doi: 10.1007/s00586-009-0919-7PubMed PMID:19277726; PubMed Central PMCID: PMCPmc3234003.
23. Miyamoto K, Masuda K, Kim JG, Inoue N, Akeda K, Andersson GB, et al. Intradiscal injections of osteo-genic protein-1 restore the viscoelastic properties of degenerated intervertebral discs. The spine jour-nal: official journal of the North American Spine Society. 2006; 6(6):692–703. Epub 2006/11/08. doi:10. 1016/j.spinee.2006.04.014PubMed PMID:17088200.
24. Cui G, Watanabe K, Miyauchi Y, Hosogane N, Tsuji T, Ishii K, et al. Matrix metalloproteinase 13 in the ligamentum flavum from lumbar spinal canal stenosis patients with and without diabetes mellitus. Jour-nal of orthopaedic science: official jourJour-nal of the Japanese Orthopaedic Association. 2011; 16(6):785– 90. Epub 2011/08/11. doi:10.1007/s00776-011-0135-2PubMed PMID:21830104.
25. Chen J, Liu Z, Zhong G, Qian L, Li Z, Qiao Z, et al. Hypertrophy of ligamentum flavum in lumbar spine stenosis is associated with increased miR-155 level. Disease markers. 2014; 2014:786543. Epub 2014/06/26. doi:10.1155/2014/786543PubMed PMID:24963214; PubMed Central PMCID: PMCPmc4052175.