Proteomic Analysis of the Effects of Aged
Garlic Extract and Its FruArg Component
on Lipopolysaccharide-Induced
Neuroinflammatory Response in Microglial
Cells
Hui Zhou1,3., Zhe Qu1,3., Valeri V. Mossine2, Dineo L. Nknolise1,3, Jilong Li4, Zhenzhou Chen1,3, Jianlin Cheng4, C.Michael Greenlief5, Thomas P. Mawhinney2, Paula N. Brown8, Kevin L. Fritsche6, Mark Hannink2, Dennis B. Lubahn2,
Grace Y. Sun1,2,3, Zezong Gu1,3,7*
1.Department of Pathology and Anatomical Sciences, University of Missouri School of Medicine, Columbia, Missouri, United States of America,2.Department of Biochemistry, University of Missouri School of Medicine, Columbia, Missouri, United States of America,3.Center for Translational Neuroscience, University of Missouri School of Medicine, Columbia, Missouri, United States of America,4.Department of Computer Science, Informatics Institute, University of Missouri, Columbia, Missouri, United States of America,5. Department of Chemistry, University of Missouri, Columbia, Missouri, United States of America,6.Division of Animal Sciences, University of Missouri, Columbia, Missouri, United States of America,7.Harry S. Truman Veterans Hospital, Columbia, Missouri, United States of America,8.British Columbia Institute of Technology, Vancouver, British Columbia, Canada
.These authors contributed equally to this work.
Abstract
Aged garlic extract (AGE) is widely used as a dietary supplement, and is claimed to promote human health through anti-oxidant/anti-inflammatory activities with hypolipidemic, antiplatelet and neuroprotective effects. Prior studies of AGE have mainly focused on its organosulfur compounds, with little attention paid to its carbohydrate derivatives, such asN-a-(1-deoxy-D-fructos-1-yl)-L-arginine (FruArg). The goal of this study is to investigate actions of AGE and FruArg on antioxidative and neuroinflammatory responses in lipopolysaccharide (LPS)-activated murine BV-2 microglial cells using a proteomic approach. Our data show that both AGE and FruArg can significantly inhibit LPS-induced nitric oxide (NO) production in BV-2 cells. Quantitative proteomic analysis by combining two dimensional differential in-gel electrophoresis (2D-DIGE) with mass spectrometry revealed that
expressions of 26 proteins were significantly altered upon LPS exposure, while levels of 20 and 21 proteins exhibited significant changes in response to AGE and FruArg treatments, respectively, in LPS-stimulated BV-2 cells. Notably, approximate
OPEN ACCESS
Citation:Zhou H, Qu Z, Mossine VV, Nknolise DL, Li J, et al. (2014) Proteomic Analysis of the Effects of Aged Garlic Extract and Its FruArg Component on Lipopolysaccharide-Induced Neuroinflammatory Response in Microglial Cells. PLoS ONE 9(11): e113531. doi:10.1371/journal.pone.0113531
Editor:Shawn Hayley, Carleton University, Canada
Received:May 16, 2014
Accepted:October 24, 2014
Published:November 24, 2014
Copyright:ß2014 Zhou et al. This is an open-access article distributed under the terms of theCreative Commons Attribution License, which permits unrestricted use, distribution, and reproduction in any medium, provided the original author and source are credited.
Data Availability:The authors confirm that all data underlying the findings are fully available without restriction. All relevant data are within the paper.
Funding:This work was supported in part by funding from the National Institute of Environmental Health Sciences Centers for Neurodegeneration Science P01 1P01ES016738 Missouri Consortium and the University of Missouri Department of Pathology and Anatomical Sciences (to ZG), and the University of Missouri South African Education Program (to DLN). This project was made possible by Grant Number P50AT006273 from the National Center for Complementary and Alternative Medicines (NCCAM), the Office of Dietary Supplements (ODS), and the National Cancer Institute (NCI). The funders had no role in study design, data collection and analysis, decision to publish, or preparation of the manuscript.
78% of the proteins responding to AGE and FruArg treatments are in common, suggesting that FruArg is a major active component of AGE. MULTICOM-PDCN and Ingenuity Pathway Analyses indicate that the proteins differentially affected by treatment with AGE and FruArg are involved in inflammatory responses and the Nrf2-mediated oxidative stress response. Collectively, these results suggest that AGE and FruArg attenuate neuroinflammatory responses and promote resilience in LPS-activated BV-2 cells by suppressing NO production and by regulating
expression of multiple protein targets associated with oxidative stress.
Introduction
Garlic is one of the most widely used botanicals worldwide, and studies have shown its beneficial effects against hypercholesterolemia and hypertension, and protection against cardiovascular disease and stroke [1–3]. Aged garlic extract (AGE), prepared from fresh garlic soaked in 15–20% aqueous ethanol and extracted/aged for more than 10 months at room temperature [4], has been demonstrated as a potent superoxide radical scavenger and chelator of transition metals [5]. While many studies have focused on the organosulfur compounds in AGE, including S-allyl-L-cysteine (SAC), allicin and allyl thiosulfinates [6], less
attention has been paid to the carbohydrate derivatives, such as N-a
-(1-deoxy-D-fructos-1-yl)-L-arginine (FruArg), as bioactive components [7,8].
FruArg belongs to the class of fructosamines, which originate from a non-enzymatic reaction between glucose and arginine [9]; they modify proteinsin vivo
and are widely used as a diagnostic marker of long-term glucose concentration in diabetics. Fructosamine derivatives are formed in foods upon storage or
dehydration and are regarded as a functional food [9]. There is evidence that fructose-amino acids can act as immune-stimulants and inhibit tumorigenesis and metastasis in animal models of cancer [10–13].
FruArg was initially extracted from Korean red ginseng as a novel substrate of nitric oxide synthase [14,15]. It has been also identified as a major component in AGE and is generally present at 2–2.5 mM concentration [16]. FruArg exhibits antioxidant properties and is capable of scavenging hydrogen peroxide and protecting macrophages or endothelial cells from the damaging effects of oxidized low-density lipoprotein [16,17].In vivo, FruArg was shown to suppress
Microglia are the resident immune effector cells in the central nervous system (CNS) with the ability to confer resilience against oxidative and inflammatory responses by increasing production of the anti-oxidative products in responding to various types of injuries and environmental stress [21–24]. Besides
maintenance of immune response, microglial cells can be activated upon phagocytosis of invading bacteria or endocytosis of toxins and produce reactive oxygen/nitrogen species including nitric oxide (NO). Excessive production of NO can induce nitrosative stress in the cell and contributes to neurovascular injuries leading to neurodegenerative diseases including traumatic brain injury, cerebral ischemia, Parkinson’s disease and Alzheimer’s disease [24–29]. Therefore, agents that can attenuate microglial activation, suppress chronic production of
proinflammatory molecules, and/or increase production of antioxidants in the brain are of interest for the development of novel approaches in prevention of neurodegenerative diseases [30,31].
In the present study, we assessed effects of AGE and FruArg in
lipopolysaccharide (LPS)-activated murine BV-2 microglial cells, a well-defined paradigm for study of neuroinflammatory responses. Quantitative proteomic analyses by two dimensional differential in-gel electrophoresis (2D-DIGE) combined with liquid chromatography tandem mass spectrometry (LC-MS/MS) identified multiple molecular targets of AGE and FruArg in LPS-stimulated BV-2 cells. Using Ingenuity Pathway Analysis (IPA) and MULTICOM-PDCN analysis, we predicted signal transduction pathways and protein networks that are
modulated by AGE and FruArg, thus providing important insights into the molecular mechanisms that may underlie their beneficial effects in brain health and promotion of resilience.
Materials and Methods
Materials
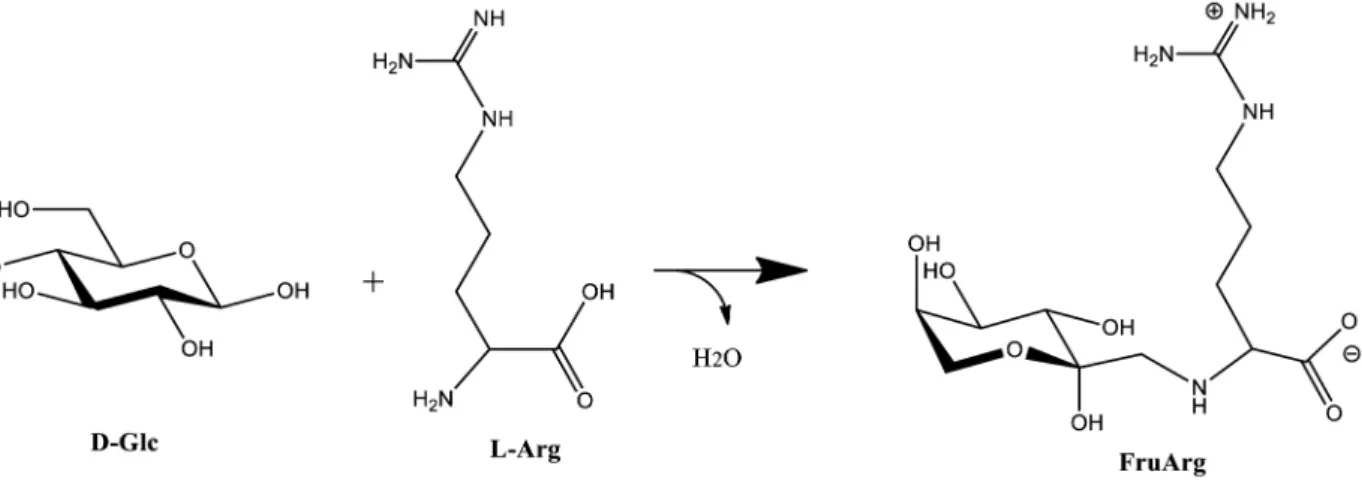
Dulbecco’s modified Eagle’s medium (DMEM), penicillin-streptomycin and L-glutamine were obtained from Gibco (Grand Island, NY, USA). Fetal bovine serum (FBS) was purchased from Atlanta Biologicals, Inc. (Lawrenceville, GA, USA). Aqueous AGE was obtained from Wakunaga of America (Mission Viejo, CA, USA) with the Kyolic brand name, and its content of the benchmark component SAC measured (see the analysis below). FruArg was synthesized by refluxing L-arginine and D-glucose according to the published protocol (Figure 1) [32], and its purity and stability measured by thin layer chromatograph as previously described [14],1H- and13C NMR spectroscopy, as well as electrospray ionization mass spectrometry. Dithiothreitol (DTT), iodoacetamide,
2-mercaptoethanol, neocuproine, [3-(4,5-dimethylthiazol-2-yl)-2,5-diphenyl-2H-tetrazolium bromide (MTT), broad-spectrum NO synthase (NOS) inhibitorN-v
-nitro-L-arginine methyl ester hydrochloride (L-NAME), protein inhibitor cocktail, LPS (rough strains) from Escherichia coli F583 (Rd mutant) were
Minimal Labeling Kit, immobilized pH gradient (IPG) buffer (pH 3–10), and Immobiline DryStrip gels (24 cm, pH 3–10) were obtained from GE Healthcare Life Science (Buckinghamshire, UK). Trypsin (modified, sequencing grade) was obtained from Promega (Madison, WI, USA). The bicinchoninic acid (BCA) protein assay kit, peroxiredoxin-1 (PRDX1) antibody (PA3750), glutaredoxin-3 (GLRX3) antibody (PA531160), and alpha-enolase (ENO1) antibody (PA521387) were purchased from Thermo Fisher Scientific-Pierce (Rockford, IL, USA). Caspase-1 (CASP1) antibody (SC-56036) was purchased from Santa Cruz Biotechnology (Santa Cruz, CA, USA).
Analysis of AGE
The dry matter content of the AGE used in this study was 30.9%. SAC concentration in the AGE sample was determined to be 1652.05¡0.08 mg/mL based on analysis of triplicates, determined by HPLC with a Primary Grade Botanical Reference Material (BRM) SAC (Chromadex Inc., Irvine, CA, USA) as an external calibration standard to comply with the identity testing requirements of cGMP (current Good Manufacturing Practices). Chromatographic separation of AGE was achieved on a C18, 4.66100 mm, 2.6 mm column at 36
˚
C. Theinjection volume was 5 mL with a flow rate of 1.0 mL/min. Mobile Phase A consisted of water with 20 mM sodium dihydrogen phosphate+10 mM heptane sulfonic acid, pH 2.1 and Mobile Phase B consisted of acetonitrile (ACN):water with 20 mM sodium dihydrogen phosphate+10 mM heptane sulfonic acid,
pH 2.1 (50:50, v/v). A gradient program was used for separation: 100% Mobile Phase A to 70% Mobile Phase A over 8.0 min, 70% Mobile Phase A to 46% Mobile Phase A over 12.0 min, 46% Mobile Phase A to 0% Mobile Phase A over 1.0 min, hold at 0% Mobile Phase A for 2.0 min. Detection was achieved at 208 nm. An in-house validation study was performed to evaluate the method’s linear range, method detection limit, limit of quantification, precision and
Figure 1. Structure and chemical reaction of FruArg.Condensation reaction between D-glucose and L-arginine, followed by the Amadori rearrangement, yields FruArg. FruArg is shown as a zwitterion and in theb-pyranose conformation, which are predominant forms at physiological pH.
recovery. Calibration curves for SAC were linear over the range of 0.5–50 mg/mL. The detection limit and limit of quantification for SAC were determined to be 0.11 mg/mL and 0.20 mg/mL, respectively, and the overall average recovery and relative standard deviation was 100.3%¡0.21%.
Cell culture and treatment
Murine BV-2 microglial cells [33,34] were received from co-author Dr. Grace Sun as a gift. The cells were cultured in DMEM containing 5% (v/v) heat-inactivated FBS, 25 U/mL penicillin, and 25 mg/mL streptomycin at 37
˚
C in a saturated humidity atmosphere containing 95% (v/v) air and 5% (v/v) CO2 as previously described [35,36]. At 70–80% confluence, cells were cultured in DMEM without serum for 4 h and then exposed to 100 ng/mL LPS for 20 h in the presence or absence of AGE (0.5%, v/v) and FruArg (3 mM), which were added to the culture medium 1 h prior to LPS exposure. As a positive control, 0.5 mM L-NAME was added to the medium 1 h prior to LPS exposure.Measurement of NO
NO production was evaluated by the Griess reaction: cell culture supernatants were mixed with an equal volume of Griess reagent [1% (w/v) sulfanilamide and 0.1% (w/v) N-(1-naphthyl) ethylenediamide in 5% (v/v) phosphoric acid] for
10 min at room temperature. Absorbance was measured at 543 nm using a Synergy-4 microplate reader (BioTek Instruments Inc., Winooski, VT, USA). NO concentration was determined from a standard curve of serial concentrations of sodium nitrite (0–100 mM).
Cell viability assay
After treatment of BV-2 cells, the conditioned medium was replaced with DMEM containing 0.5 mg/mL MTT and incubated for 4 h at 37
˚
C. The formazan products were dissolved in dimethyl sulfoxide (DMSO) and absorbance was measured at 540 nm using the Synergy-4 microplate reader.Labeling of proteins with CyDye reagents and gel fractionation
Cells were lysed in HENTS [250 mM HEPES-NaOH, pH 7.4, 1 mM EDTA, 0.1 mM neocuproine, 1% (v/v) Triton X-100, 0.1% (w/v) SDS] buffer containing 1% (v/v) protein inhibitor cocktail. Proteins were precipitated in 46volume (v/
v) acetone at220
˚
C overnight and then redissolved in lysis buffer (30 mM Tris-HCl, 7 M urea, 2 M thiourea, 4% (w/v) CHAPS, pH 8.5). After centrifugation at 15,000 g for 10 min, the supernatant was collected and protein concentration was determined using the BCA protein assay.Twelve samples were generated from three biological replicates of four experimental conditions (untreated, LPS-treated, LPS+AGE and LPS+FruArg).
manufacturer’s protocol (ratio of 50 mg protein to 400 pmol CyDye dyes). To limit potential dye-specific labeling-derived artifacts, sample replicates in different gels were labeled with either Cy3 or Cy5 dye, whereas the internal standard pooled from all samples in equal amounts was labeled with Cy2 dye.
For two dimensional gel fractionation, samples labeled by CyDye dyes were pooled (150 mg protein total) at a 1:1:1 ratio and brought up to a final volume of 420 mL with rehydration buffer [7 M urea, 2 M thiourea, 4% (w/v) CHAPS, 2% (v/v) IPG buffer (pH 3–10), 0.002% (v/v) bromphenol blue, 2% (v/v) glycerol, 2% (v/v) 2-hydroxyethyl disulfide, 10 mM DTT]. The first-dimension isoelectric focusing (IEF) was performed in an IPGphor IEF unit (Bio-Rad, Berkeley, CA, USA) on 24-cm IPG strips pH 3–10 as follows: 30 V for 16 h, 250 V for 1 h, 1,000 V for 0.5 h and 8,000 V for up to a total of 80,000 Volt-hour. After IEF, the proteins in strips were reduced and alkylated by successive 15 min treatments with equilibration buffer containing 1.0% (w/v) DTT, followed by 2.5% (w/v) iodoacetamide. The proteins were then resolved in 12% SDS-PAGE gels casted in an Ettan DALTsix gradient maker (GE Healthcare Life Science, Buckinghamshire, UK).
Gel image acquisition and 2D-DIGE data analysis
Fluorescence images of the 2D-DIGE gels were acquired using an Ettan DIGE imager scanner (GE Healthcare Life Science, Buckinghamshire, UK). Excitation and emission wavelengths were set specifically for each dye according to the manufacturer’s recommendations. Semi-automated DIGE data analysis was then performed using the SameSpots software (Version 4.5; Totallab Nonlinear USA Inc. Durham, NC; http://www.totallab.com/products/samespots/overview/) [37]. We considered the fluorescence intensity changes as statistically significant when ratio.1.3 and p value,0.05 in one-way ANOVA analysis of the multiple sample groups.
Protein identification by LC-MS/MS
After imaging for CyDyes, the gels were stained with Coomassie blue dye G250 following standard procedures. The gel spots of interest were manually picked and proteins were in-gel digested by trypsin. Briefly, gel slices were rinsed with 50 mM ammonium bicarbonate (NH4HCO3) and 50% (v/v) ACN, dehydrated with ACN and incubated in 50 mM NH4HCO3 containing 20 mg/mL trypsin (modified sequencing grade) on ice for 1 h and then at 37
˚
C for 18 h. The tryptic peptides were extracted with three changes of the extraction solution containing 60% (v/v) ACN and 1% (v/v) trifluoroacetic acid. The solution containing peptides was evaporated to dryness and the dry peptide mixtures were dissolved in 5% (v/v) ACN/1% (v/v) formic acid.CA). Bound peptides were eluted from this trap column onto a 10.5-cm long, 150-mm inner diameter, pulled-needle analytical column packed with Magic C18 reversed phase resin (Michrom Bioresources, Inc., Auburn, CA). The peptides were separated and eluted from the analytical column with a gradient of ACN at 400 nL/min as follows: initial conditions (during trap load) is 5% B (A: 0.1% formic acid in water; B: 99.9% ACN, 0.1% formic acid), ramp and hold at 10% B for 2 min, gradient from 10% to 40% B over 15 min, ramp to 90% B over 1 min, hold at 90% B for 11 min, ramp back to 5% B over 1 min, hold at 5% B for 5 min prior to loading next sample. The Proxeon Easy nLC system is attached to a LTQ Orbitrap-XL mass spectrometer. Following a high-resolution (30,000 res, profile) Fourier transform MS scan of the eluting peptides (300–2000 m/z range), in each cycle, the 9 most abundant peptides (reject trypsin autolysis ions) were subjected to ion-trap collision-induced dissociation (CID) peptide fragmentation (.1000 counts, NCE of 35%, centroid). Data across a total of 35 min of elution were collected. The Sorcerer 2IDA (Sage-N research Inc., San Jose, CA) was used to query the data against the IPI-mouse database. Criteria for database search were 25 ppm mass error, monoisotopic masses, and methionine oxidation as variable modification.
Bioinformatics analysis
The identified proteins were analyzed by IPA software version 7.6 (http://www. ingenuity.com; Ingenuity Systems, Redwood City, CA, USA) for associated biological functions and molecular pathways, as well as to predict protein-protein interaction networks determined by the Ingenuity Knowledge Base [38], a structured repository of expertly curated biological interactions and functional annotations from various sources including the literature. Our in-house MULTICOM-PDCN software [39] was used to predict protein subcellular locations by searching the Swiss-Prot database.
Results
AGE and FruArg suppress NO production in LPS-stimulated BV-2
microglial cells
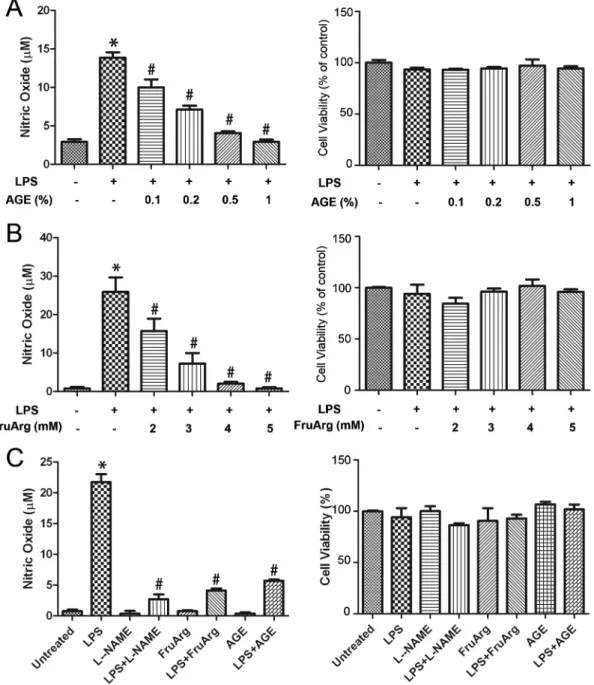
Figure 2. Effects of AGE and FruArg on NO production induced by LPS in BV-2 cells.(A) BV-2 cells were treated with LPS in the presence of AGE (0, 0.1%, 0.2%, 0.5%, or 1%) for 20 h. Griess assay (left plot) showed NO level significantly increased after LPS-exposure (*, p,0.05 vs. untreated), but was inhibited by AGE in a dose-dependent manner (#, p,0.05 vs. LPS-treated by one-way ANOVA, n53; data are presented as mean¡SEM). Result of MTT assay indicated the addition of AGE did not significantly affect the cell viability (right plot). (B) Dose titration for administration of FruArg. BV-2 cells were exposed to LPS in the presence of various concentration of FruArg (0, 2, 3, 4, or 5 mM) for 20 h. LPS-induced NO production was significantly suppressed by FruArg in a dose-dependent manner (left plot; *, p,0.05 vs. untreated;#, p,0.05 vs. LPS-treated by one-way ANOVA, n53; data are presented as mean¡SEM), however, the cell viability was not affected (right plot). (C) Effects of AGE and FruArg in LPS-stimulated BV-2 cells. According to above results, 0.5% for AGE and 3 mM for FruArg were selected as the treatment concentrations used for further study, respectively. Under such conditions, AGE and FruArg alone neither show any effect on NO production (left) nor on cell viability (right). L-NAME (0.5 mM), a known broad-spectrum NOS inhibitor, was introduced as a positive control. *, p,0.05 vs. untreated;#, p,0.05, vs. LPS-treated by one-way ANOVA, n53; Data are presented as mean¡SEM.
any significant effects on NO production (Figure 2C). As a positive control, treatment with a known broad-spectrum NOS inhibitor L-NAME inhibited response in the LPS-stimulated BV-2 cells (Figure 2C, left plot).
Proteomic analysis of AGE and FruArg treatment in
LPS-stimulated BV-2 cells
Cell lysates from four experimental conditions (untreated, LPS-treated, LPS+AGE,
and LPS+FruArg) in biological triplicates were labeled by three fluorescence
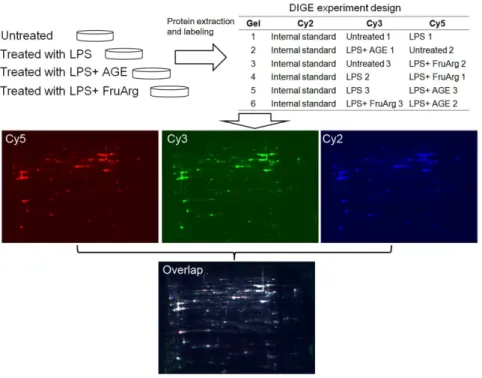
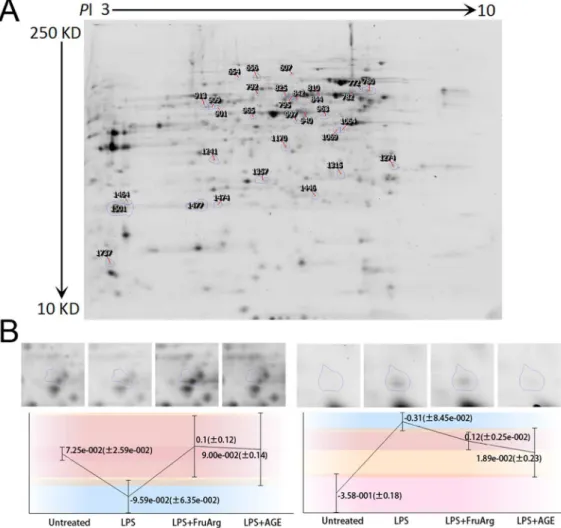
CyDyes (Cy2, Cy3 and Cy5) (Figure 3). After 2D-DIGE separation, 1,925 protein spots on 24-cm gels were detected, of which 32 were significantly altered (ratio .1.3, p,0.05) by the treatments. A representative 2D-DIGE gel image is shown in Figure 4A; quantitative results of spot#825 (Figure 4B, left panel) and spot #1737 (Figure 4B, right panel) are presented as examples of up-regulation and down-regulation, respectively, in the treatment groups. The 32 spots with differential ratio changes were excised from the corresponding Coomassie Blue stained gel for protein identification by LC-MS/MS.
Figure 3. 2D-DIGE experimental design and workflow.Lysates of BV-2 cells untreated or treated with LPS in the absence or presence of AGE (0.5%) or FruArg (3 mM) in triplicate were labeled with fluorescence CyDyes following the scheme shown in the table. The samples were then mixed and resolved on six independent 2D-DIGE gels. Three fluorescence images were obtained from each gel and subjected to image analysis using the SameSpots software.
Identification of differentially expressed proteins
Results of protein identification using LC-MS/MS were listed inTable 1. Some of the protein spots contained more than one protein. For example, two proteins were found in spot #940 and recognized as ENO1 and CASP1. These proteins were identified with high confidence with sequence coverage in the range of 40% to 80%. In addition, some spots contained the same proteins, for instance, spots #1064 and#1069 were both identified as protein GLRX3 and PSMD13,
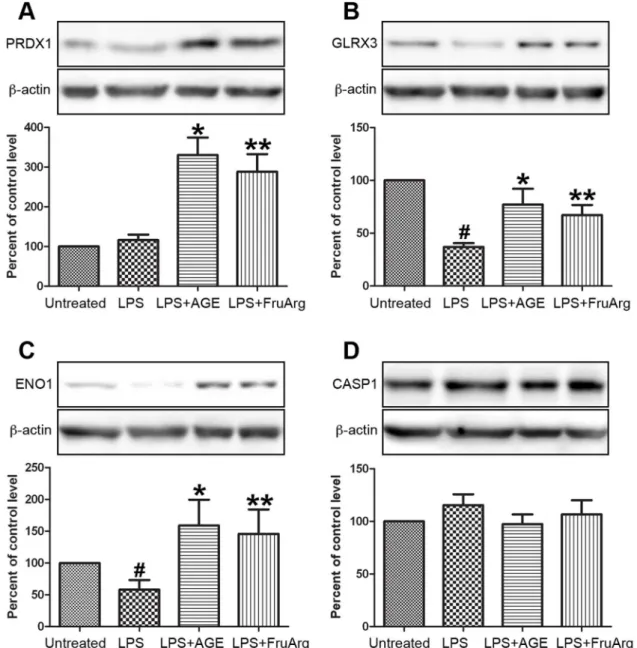
suggesting the co-existence of their post-translational modifications or isoforms. Four of the identified proteins were selected for validation using Western blotting (Figure 5). The results showed that PRDX1 could be up-regulated by both AGE and FruArg (Figure 5A), while GLRX3 was down-regulated by LPS and up-regulated by AGE and FruArg (Figure 5B). ENO1 decreased responding to LPS but increased after AGE or FruArg treatment (Figure 5C), whereas CASP1 did not
Figure 4. Differential spots detection by the SameSpots software.A total of 1,925 protein spots on the 24-cm 2D-DIGE gels were detected using SameSpots analysis. Compared to untreated conditions, 25 protein spots showed significant protein level changes (ratio.1.3, p,0.05) after treatment with LPS. In comparison to LPS treatment, 20 and 21 protein spots were altered by AGE and FruArg, respectively. All of these differential spots were indicated on a representative 2D-DIGE gel (A). Quantification results of two example spots,#825 (left) and#1737 (right), were shown (B).
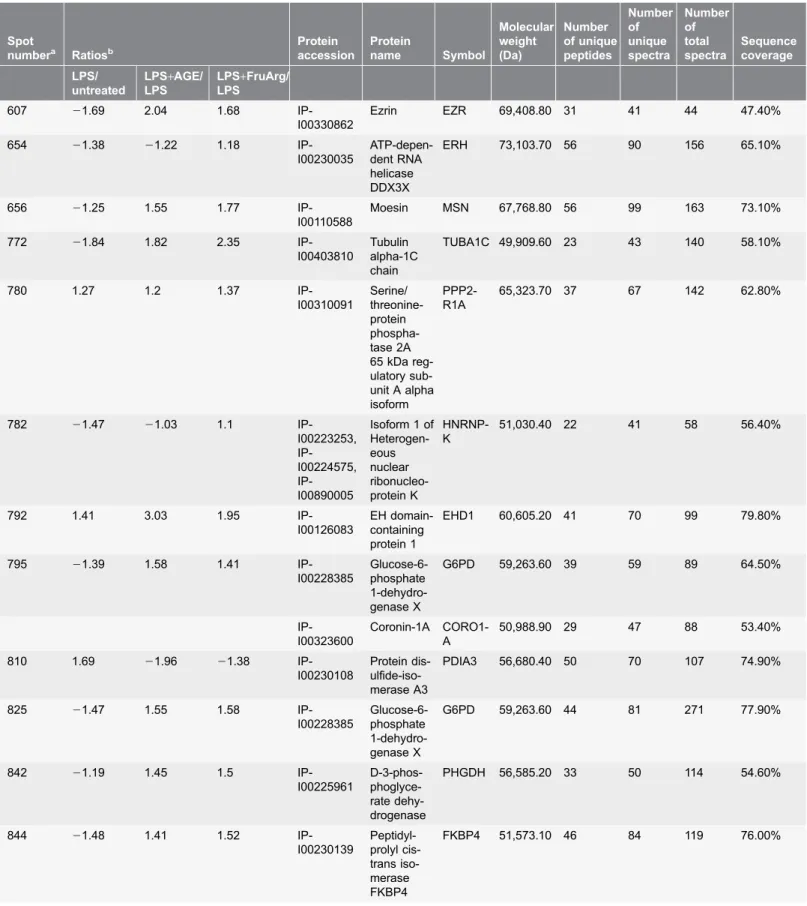
Table 1.List of the differentially expressed proteins identified by 2D-DIGE and LC-MS/MS analysis.
Spot
numbera Ratiosb
Protein accession Protein name Symbol Molecular weight (Da) Number of unique peptides Number of unique spectra Number of total spectra Sequence coverage LPS/ untreated
LPS+AGE/ LPS
LPS+FruArg/ LPS
607 21.69 2.04 1.68
IP-I00330862
Ezrin EZR 69,408.80 31 41 44 47.40%
654 21.38 21.22 1.18
IP-I00230035
ATP-depen-dent RNA helicase DDX3X
ERH 73,103.70 56 90 156 65.10%
656 21.25 1.55 1.77
IP-I00110588
Moesin MSN 67,768.80 56 99 163 73.10%
772 21.84 1.82 2.35
IP-I00403810
Tubulin alpha-1C chain
TUBA1C 49,909.60 23 43 140 58.10%
780 1.27 1.2 1.37
IP-I00310091 Serine/ threonine-protein phospha-tase 2A 65 kDa reg-ulatory sub-unit A alpha isoform
PPP2-R1A
65,323.70 37 67 142 62.80%
782 21.47 21.03 1.1
IP-I00223253, IP-I00224575, IP-I00890005
Isoform 1 of Heterogen-eous nuclear ribonucleo-protein K HNRNP-K
51,030.40 22 41 58 56.40%
792 1.41 3.03 1.95
IP-I00126083
EH domain-containing protein 1
EHD1 60,605.20 41 70 99 79.80%
795 21.39 1.58 1.41
IP-I00228385
Glucose-6-phosphate 1-dehydro-genase X
G6PD 59,263.60 39 59 89 64.50%
IP-I00323600
Coronin-1A CORO1-A
50,988.90 29 47 88 53.40%
810 1.69 21.96 21.38
IP-I00230108
Protein dis- ulfide-iso-merase A3
PDIA3 56,680.40 50 70 107 74.90%
825 21.47 1.55 1.58
IP-I00228385
Glucose-6-phosphate 1-dehydro-genase X
G6PD 59,263.60 44 81 271 77.90%
842 21.19 1.45 1.5
IP-I00225961
D-3-phos- phoglyce-rate dehy-drogenase
PHGDH 56,585.20 33 50 114 54.60%
844 21.48 1.41 1.52
IP-I00230139 Peptidyl-prolyl cis-trans iso-merase FKBP4
Table 1.Cont.
Spot
numbera Ratiosb
Protein accession Protein name Symbol Molecular weight (Da) Number of unique peptides Number of unique spectra Number of total spectra Sequence coverage LPS/ untreated
LPS+AGE/ LPS
LPS+FruArg/ LPS
901 2.69 1.14 1.06
IP-I00111285
Immune-responsive gene 1 pro-tein
IRG1 53,759.60 30 55 104 67.60%
909 2.2 1.39 1.21
IP-I00111285
Immune-responsive gene 1 pro-tein
IRG1 53,759.60 32 62 159 68.90%
913 2.64 1.41 1.27
IP-I00111285
Immune-responsive gene 1 pro-tein
IRG1 53,759.60 30 57 151 68.90%
940 1.08 1.23 1.49
IP-I00125676
Caspase-1 CASP1 45,642.00 27 46 62 53.00%
IP-I00462072
Alpha-eno-lase
ENO1 47,141.70 24 40 61 44.50%
963 2.22 21.83 21.09
IP-I00133417 Interferon-induced protein with tetratrico-peptide repeats 3
IFIT3 47,223.80 44 79 153 83.60%
965 22.17 1.32 1.43
IP-I00111013
Cathepsin D CTSD 44,955.00 22 38 48 52.40%
997 3.82 21.87 21.54
IP-I00120113
UMP-CMP kinase 2, mitochon-drial
CMPK2 50,036.40 37 59 188 73.20%
1064 1.29 1.42 1.33
IP-I00315550
Glutaredoxi-n-3
GLRX3 37,778.70 24 44 80 53.40%
IP-I00126048 26S protea-some non-ATPase regulatory subunit 13
PSMD13 42,810.00 23 31 36 54.50%
1069 22.38 1.58 1.34
IP-I00315550
Glutaredoxi-n-3
GLRX3 37,778.70 23 39 86 52.20%
IP-I00126048 26S protea-some non-ATPase regulatory subunit 13
PSMD13 42,810.00 25 37 45 61.70%
1170 1.13 1.48 1.35
IP-I00314950
60S acidic ribosomal protein P0
RPLP0 34,217.50 24 42 136 69.70%
1241 22.06 21.08 21.04 IP-I00122547 Voltage-dependent anion-selec-tive channel protein 2
Table 1.Cont.
Spot
numbera Ratiosb
Protein accession Protein name Symbol Molecular weight (Da) Number of unique peptides Number of unique spectra Number of total spectra Sequence coverage LPS/ untreated
LPS+AGE/ LPS
LPS+FruArg/ LPS
1274 21.42 1.02 21.33
IP-I00230044
Isoform 2 of Tropomyos-in alpha-3 chain
TPM3 29,021.20 35 67 165 77.40%
1315 1.38 21.03 1.42
IP-I00114329 Glutamate– cysteine ligase regu-latory subu-nit
GCLM 30,535.20 15 23 46 50.00%
1357 1.38 1.13 1.06
IP-I00457898
Phosphogl-ycerate mutase 1
PGAM1 28,832.80 22 53 112 78.70%
1446 1.48 21.03 1.13
IP-I00126042
Ras-related protein Rab-14
RAB14 23,897.60 18 23 29 64.70%
IP-I00132397
GTP-bind-ing protein SAR1b
SAR1B 22,382.90 12 22 32 60.60%
IP-I00117264, IP-I00895414
Protein DJ-1 PARK7 19,908.10 12 16 24 60.80%
1464 1.43 1.28 1.21
IP-I00555023
Glutathione S-transfer-ase P 1
GSTP1 23,610.10 10 17 52 48.60%
1474 2.78 21.76 21.35
IP-I00121788
Peroxiredo-xin-1
PRDX1 22,177.50 18 24 39 64.30%
IP-I00109109 Superoxide dismutase [Mn], mito-chondrial
SOD2 24,603.20 12 17 29 44.60%
1477 2.35 21.2 1.04
IP-I00121788
Peroxiredo-xin-1
PRDX1 22,177.50 24 43 131 76.40%
IP-I00109109 Superoxide dismutase [Mn], mito-chondrial
SOD2 24,603.20 15 28 113 44.60%
1501 1.01 1.34 1.62
IP-I00121788
Peroxiredo-xin-1
PRDX1 22,177.50 26 52 310 80.40%
1737 4.57 21.89 21.52
IP-I00555085
Ubiquitin-like protein ISG15
ISG15 17,897.50 9 21 60 55.30%
a.
Protein spot number according toFigure 4.
b.Average volume ratio based on the spots normalized volume across the four groups was calculated by the SameSpots software. Apvalue for the one-way analysis of variance,0.05 was accepted.
show significant changes under different treatment conditions (Figure 5D), suggesting that ENO1 mainly contributed to the changes in spot #940.
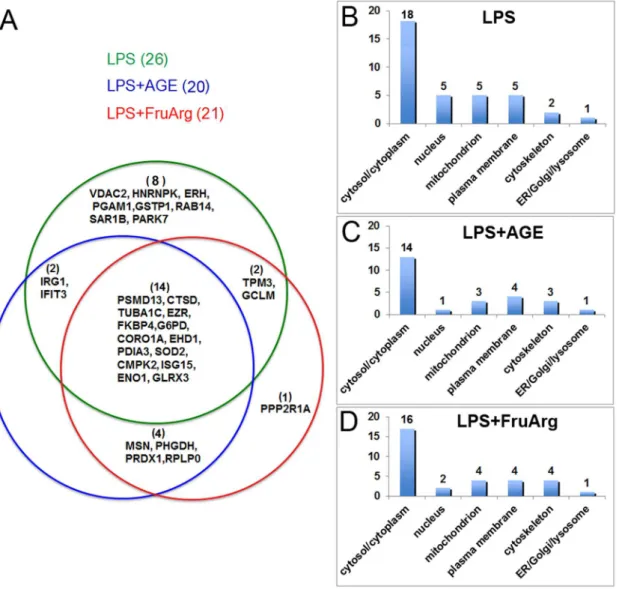
In this study, a total of 26, 20, and 21 differentially expressed proteins were identified in response to LPS, LPS+AGE, and LPS+FruArg treatments, respectively
(Figure 6A). Among these, LPS+AGE treatment shared 16 differentially expressed
proteins with LPS-alone treatment; and LPS+FruArg treatment elicited changes in
16 proteins in common with LPS treatment, thus indicating both AGE and
Figure 5. Validation of expression profiling of proteins by Western blotting.Four of the identified proteins, PRDX1 (A), GLRX3 (B), ENO1 (C), and CASP1 (D), responding to AGE and/or FruArg treatment in LPS-stimulated BV-2 cells were validated using Western blotting. Protein intensities were quantified by Image J software, normalized tob-actin, and expressed as percentage of untreated controls. Data are means¡SEM (n>5);#, P,0.05, untreated vs. LPS; *, P,0.05, LPS vs. LPS+AGE; **, P,0.05, LPS vs. LPS+FruArg.
FruArg partially attenuated the effects of LPS in BV-2 cells. Eighteen proteins responded to the treatments with both AGE and FruArg, accounting for approximate 78% overlap. Nevertheless, AGE and FruArg treatment also had distinct targets. For the LPS+AGE treatment, 2 unique proteins, while for the
LPS+FruArg treatment, 3 proteins were uniquely altered, respectively. Taken together, these findings suggest FruArg as a major bioactive component of AGE, and a potential modulator of oxidative and nitrosative stress and
neuroinflammation.
Among those identified proteins with the differential expression levels, cellular component analysis using MULTICOM-PDCN located 14 in cytosol/cytoplasm, 1
Figure 6. Data analysis for the identified differentially expressed proteins using MULTICOM-PDCN.(A) Three subsets of differential expression proteins with overlaps in between were identified from different treatments (LPS, LPS+AGE, and LPS+FruArg) in BV-2 cells; Cellular locations of these proteins after treated with LPS (B), treated with LPS in the presence of AGE (C) or FruArg (D) were predicted using the in-house MULTICOM-PDCN software.
in nucleus, 3 in mitochondrion, 4 in plasma membrane, 3 in cytoskeleton, and 1 in ER/Golgi/lysosome responding to AGE (Figure 6B), as well as 16, 2, 4, 4, and 4 in those organelles, respectively, in response to FruArg. These results indicate both AGE and FruArg regulate majority of proteins located in cytosol/cytoplasm. Importantly, the nuclear compartment appeared to contain the highest
proportion of LPS-modulated proteins whose expression was altered by treatment with AGE or FruArg (5 versus 1 and 2, respectively), suggesting that AGE and FruArg share a common mechanism of transcriptional regulation of protein levels.
Effects of LPS in BV-2 cells on canonical pathways and signaling
networks
IPA annotation indicated that the 26 differentially expressed proteins responding to LPS treatment in BV-2 cells play critical roles in inflammatory response (13 proteins, p value at 4.31E-05—2.90E-02) and neurological disease (12 proteins, p value at 1.16E-05—3.03E-02), with participation in various cellular processes including drug metabolism (8 proteins, p value at 2.11E-07—3.02E-02), protein synthesis (14 proteins, p value at 2.11E-07—3.02E-02), DNA replication,
recombination, and repair (6 proteins, p value at 9.10E-08—2.42E-02), and cell death and survival (17 proteins, p value at 8.22E-07—2.98E-02). The top canonical pathways for the proteins altered by LPS according to the order of the 2log (p value) include glycolysis I, Nrf2-mediated oxidative stress response, gluconeogenesis I, mitochondrial dysfunction, thyroid hormone biosynthesis, 14-3-3-mediated signaling, and superoxide radicals degradation (Figure 7A). Protein-protein interaction networks were further examined by IPA analysis. Results showed that the top protein-protein interaction network (Figure 7B) is mainly associated with drug metabolism, protein synthesis, DNA replication, recombination, and repair (score549). Eighteen out of the 26 identified proteins responding to LPS treatment are involved in this network. Among these proteins, 9 proteins are down-regulated (shaded green) and 9 proteins were up-regulated (shaded red).
Effects of AGE and FruArg in LPS-stimulated BV-2 cells on
canonical pathways
In order to gain more insight into the mechanisms for the action of AGE and FruArg in LPS-induced microglial activation, we performed pathway and functional analyses of the differentially expressed proteins. IPA annotation indicates that the proteins sensitive to the AGE and FruArg treatments are associated with immunological disease and inflammatory response, and function in cell death and survival, free radical scavenging, DNA replication,
biosynthesis, superoxide radicals degradation, and pentose phosphate pathway (oxidative branch) were among the top canonical pathways targeted by treatment of the two botanical compounds (Figure 8). In comparison, AGE uniquely attenuated effect of LPS on gap junction signaling, RhoGDI signaling, granulocyte adhesion and diapedesis, and serine biosynthesis (Figure 8A), whereas FruArg specifically affected ceramide signaling, p70S6K signaling, synaptic long term depression, and glutathione biosynthesis (Figure 8B). Among the top 10 canonical pathways targeted by LPS (Figure 7A), there are five shared pathways also modulated by AGE or FruArg (Figure 8A and 8B). Hence, AGE and FruArg may reverse the LPS-induced alteration of these key pathways involved in regulation of cellular redox status, cell cycle control, inflammatory signaling and stress
responses, biosynthesis and energy metabolism.
Signaling networks affected by AGE and FruArg in LPS-stimulated
BV-2 cells
We further examined the effects of AGE and FruArg on protein-protein interaction networks in LPS-stimulated BV-2 cells. Based on IPA analysis, the top-score protein-protein interaction network associated with AGE treatment functions in immunological disease and cellular assembly and organization (IPA score549). Eighteen out of the 20 identified proteins responding to AGE treatment are involved in this network (Figure 9A). Among those proteins, 4 proteins were down-regulated (shaded green) and 14 proteins were up-regulated (shaded red). In the case of FruArg treatment, the top protein-protein interaction network functions in immunological disease, drug metabolism, and cellular assembly and organization (IPA score552), consisting of 18 of the 21 identified proteins (Figure 9B). Among those proteins, 4 proteins were down-regulated (shaded green) and 14 proteins were up-regulated (shaded red). There are 15 common proteins (CORO1A, CTSD, EZR, FKBP4, G6PD, GLRX3, ISG15, MSN, PDIA3, PHGDH, PRDX1, SOD2, ENO1, TUBA1C, RPLP0) between these two networks, further confirming that FruArg serves as a major functional component in AGE.
Discussion
Chronic activation of microglia can lead to inflammatory responses through release of various inflammatory mediators that increase oxidative stress, trigger
Figure 7. Effects of LPS in BV-2 cells on canonical pathways and signaling networks.(A) Top 10 canonical pathways participated by the differentially expressed proteins responding to LPS treatment in BV-2 cells. The canonical pathways were ranked according to their2log (p-value). A ratio (orange square) indicates the number of identified differentially proteins found in each pathway over the total number of proteins in that pathway. (B) The top protein-protein interaction network responding to LPS treatment in BV-2 cells is mainly associated with drug metabolism, protein synthesis, DNA replication, recombination, and repair. The symbols labeled in red and green represent up- and down-regulation, respectively, and the intensity of the colors indicates the degree of regulation. Solid lines in the network imply direct interactions between proteins, and dashed lines indicate indirect interactions.
neuronal cell death, and have been implied in the development of
neurodegenerative diseases [31,40]. In this study, we showed that LPS-induced microglial activation, a well-established cellular model of neuroinflammation, altered expression levels of a number of proteins (such as up-regulation of PDIA3,
Figure 8. Canonical pathways altered by AGE and FruArg in LPS-stimulated BV-2 cells.IPA analysis using the differentially expressed proteins predicted the canonical pathways targeted by AGE (A) or FruArg (B) in LPS-stimulated BV-2 cells. Of the top 10 canonical pathways, 6 pathways are shared by the two botanical compounds. These canonical pathways were ranked according to their2log (p-value).
PARK7 and SOD2), consistent with previous reports showing that LPS activates microglia to release neurotoxic factors to induce neuronal death [31,41]. The 26 proteins responding to LPS-stimulation are linked to drug metabolism, protein synthesis, DNA replication, recombination, and repair (Figure 7B). IPA
annotation of canonical pathways showed that Nrf2-mediated pathway, a major antioxidant mechanism for neuroprotection against oxidative stress [42,43], is one of the top targets under LPS exposure (Figure 7A).
AGE, an odorless substance prepared by aging garlic for up to 20 months, has been shown to have neuroprotective effects upon cerebral oxidative stress and neuronal cell death in experimental models of neurodegenerative disorders including cerebral ischemia and Alzheimer’s disease [44–47]. Furthermore, different molecular and cellular mechanisms have been reported, such as scavenging reactive oxygen species [48,49], inhibition of pro-oxidant enzymes [46,50], and induction of antioxidant enzymes [51,52]. FruArg, a product of the Maillard reaction during the aging process of AGE, has been reported to be capable of inducing both anti-oxidative and anti-inflammatory effects [16,53]. However, much remains unknown about the intracellular targets and molecular mechanism(s) underlying the effects of these botanicals. In this study using 2D-DIGE analyses, we have demonstrated that AGE or FruArg treatment can significantly decrease nitrosative stress, as well as regulate the expression of multiple proteins, thus posing a multi-modal action of AGE and FruArg in activated microglia.
2D-DIGE quantitative proteomics analysis showed that treatment with AGE and FruArg to LPS-stimulated BV-2 cells resulted in alteration of 20 and 21 proteins, respectively (Figure 6A). The regulation effects of LPS on 18 proteins (about 69% of the total 26 identified proteins) were reversed by AGE or FruArg treatment. Interestingly, treatment with AGE or FruArg decreased more proteins compared to that of the BV-2 cells exposed to LPS alone in the compartment of nucleus (5 proteins versus 1 and 2, respectively). These results imply that, similarly to a number of anti-inflammatory botanicals, AGE and FruArg may modulate toll-like receptors (TLRs)-induced activation and nuclear translocation of proinflammatory transcription factors for gene regulation [54–56].
As a result, the modulation of LPS in 5 top canonical pathways, including Nrf2-mediated oxidative stress response, thyroid hormone biosynthesis, 14-3-3-mediated signaling, superoxide radicals degradation, and pentose phosphate pathway (oxidative branch) was restored by AGE and FruArg (Figure 7A and Figure 8). In particular, both AGE and FruArg altered the Nrf2-mediated signaling pathway, which is a chief mechanism for cellular defense against oxidative stress [57]. These results suggest that AGE and FruArg attenuated
Figure 9. Protein-protein interaction networks associated with AGE and FruArg treatments in LPS-stimulated BV-2 cells.The networks analysis result showed AGE modulates protein networks that function in immunological disease and cellular assembly and organization (A), while FruArg modulates protein networks that are mainly associated with immunological disease, drug metabolism, and cellular assembly and organization (B). There were 15 common proteins shared by the two protein networks.
LPS-induced neuroinflammatory responses in BV-2 cells through regulating expression of proteins that are involved in multiple oxidative stress-related pathways, consistent with their known antioxidant effects.
Additionally, 78% of the identified proteins that responded to AGE and FruArg treatments were found in common (Figure 6A). And not surprisingly, six of the top ten canonical pathways predicted by IPA are shared by the two botanical compounds (Figure 8). These results indicate that FruArg is a major bioactive component of AGE.
Previous studies demonstrated the average concentration of FruArg in various AGE preparations to be 2.2¡0.2 mM [11], which is close to the concentration used for FruArg treatment (3 mM) here. Thus, we considered this dose to be the human consumption equivalent. However, for AGE treatment, we made a 200-fold dilution, since other active compounds possess synergistic antioxidant properties and most likely also contribute to its effect on suppression of
nitrosative stress and neuroinflammatory responses. Nevertheless, we observed the ability for FruArg as well as AGE to inhibit LPS-induced NO production in microglial cells. Similar results for AGE were found in LPS-stimulated rat macrophages [58], suggesting that AGE and FruArg may be considered as promising dietary supplements to promote resilience in nitrosative stress-induced neurodegenerative disorders by suppressing production of proinflammatory molecules and promoting antioxidant pathways.
Conclusions
In this study, we used gel-based quantitative proteomics to investigate the effects of AGE and FruArg in LPS-stimulated BV-2 cells and revealed new mechanistic insights into the multiple protein targets of these botanical compounds to mitigate neuroinflammatory responses. In addition, our results demonstrated FruArg as a major active component of AGE and similarly acting on nitrosative stress and neuroinflammation. Based on the expression levels of the identified proteins, we predicted multiple signal transduction pathways associated with these targets. Evidence supporting the multi-modal action of AGE and FruArg may aid in better understanding of the molecular mechanisms for their promotion of resilience against the effects of neurological diseases and aging.
Acknowledgments
Author Contributions
Conceived and designed the experiments: ZG. Performed the experiments: HZ ZQ DLN VVM. Analyzed the data: HZ ZQ JL ZG. Contributed reagents/materials/ analysis tools: GYS JC. Wrote the paper: HZ ZQ ZG ZC VVM JC CMG TPM PNB KLF MH DBL GYS.
References
1. Morihara N, Sumioka I, Ide N, Moriguchi T, Uda N, et al. (2006) Aged garlic extract maintains cardiovascular homeostasis in mice and rats. J Nutr 136: 777S–781S.
2. Kannappan R, Gupta SC, Kim JH, Reuter S, Aggarwal BB(2011) Neuroprotection by spice-derived nutraceuticals: you are what you eat! Mol Neurobiol 44: 142–159.
3. Herbs at a Glance Garlic. US National Center for Complementary and Alternative Medicine D274.
4. Kyo E, Uda N, Kasuga S, Itakura Y(2001) Immunomodulatory effects of aged garlic extract. J Nutr 131: 1075S–1079S.
5. Morihara N, Hayama M, Fujii H(2011) Aged garlic extract scavenges superoxide radicals. Plant Foods Hum Nutr 66: 17–21.
6. Lawson LD, Gardner CD(2005) Composition, stability, and bioavailability of garlic products used in a clinical trial. J Agric Food Chem 53: 6254–6261.
7. Ryu K, Rosen RT(2003) Unique chemistry of aged garlic extract. ACS Symposium Series 859: 258– 270.
8. Amagase H(2006) Clarifying the real bioactive constituents of garlic. J Nutr 136: 716S–725S.
9. Mossine VV, Mawhinney TP(2010) 1-Amino-1-deoxy-D-fructose (‘‘fructosamine’’) and its derivatives. Adv Carbohydr Chem Biochem 64: 291–402.
10. Tarnawski M, Kulis-Orzechowska R, Szelepin B (2007) Stimulatory effect of N-(1-deoxy-beta-d-fructopyranos-1-yl)-l-proline on antibody production in mice. Int Immunopharmacol 7: 1577–1581.
11. Denisevitch T, Semyonovakobzar R, Glinsky V, Mosin V (1995) The influence of synthetic aminoglycoconjugates on the aggregation ability and metastatic potential of tumor cells. Experimental Oncology 17: 111–117.
12. Mossine VV, Chopra P, Mawhinney TP(2008) Interaction of tomato lycopene and ketosamine against rat prostate tumorigenesis. Cancer Res 68: 4384–4391.
13. Mossine VV, Glinsky VV, Mawhinney TP (2010) Antitumor effects of the early Maillard reaction products. In: Thomas MC, Forbes J (eds) The Maillard reaction: interface between aging, nutrition and metabolism. Royal Society of Chemistry, London 322: 170–179.
14. Gao FF, Zhang WY, Liu LM, Chang C, Han LK, et al.(2012) Detection and distribution of arginine derivatives in Panax quinquefolius L. and investigations of their antioxidant properties. LWT - Food Science and Technology 49: 34–41.
15. Matsuura Y, Zheng Y, Takaku T, Kameda K, Okuda H(1994) Isolation and physiological activities of a new amino acid derivative from Korean red ginseng. J Tradit Med 11: 256–263.
16. Ryu K, Ide N, Matsuura H, Itakura Y(2001) N alpha-(1-deoxy-D-fructos-1-yl)-L-arginine, an antioxidant compound identified in aged garlic extract. J Nutr 131: 972S–976S.
17. Ide N, Lau BH, Ryu K, Matsuura H, Itakura Y(1999) Antioxidant effects of fructosyl arginine, a Maillard reaction product in aged garlic extract. J Nutr Biochem 10: 372–376.
18. Matsutomo T, Stark TD, Hofmann T(2013) In vitro activity-guided identification of antioxidants in aged garlic extract. J Agric Food Chem 61: 3059–3067.
20. Cribbs DH, Berchtold NC, Perreau V, Coleman PD, Rogers J, et al.(2012) Extensive innate immune gene activation accompanies brain aging, increasing vulnerability to cognitive decline and
neurodegeneration: a microarray study. J Neuroinflammation 9: 179.
21. Griffiths MR, Gasque P, Neal JW (2009) The multiple roles of the innate immune system in the regulation of apoptosis and inflammation in the brain. J Neuropathol Exp Neurol 68: 217–226.
22. Amor S, Puentes F, Baker D, van der Valk P(2010) Inflammation in neurodegenerative diseases. Immunology 129: 154–169.
23. Saijo K, Glass CK(2011) Microglial cell origin and phenotypes in health and disease. Nat Rev Immunol 11: 775–787.
24. Garden GA, Moller T (2006) Microglia biology in health and disease. J Neuroimmune Pharmacol 1: 127–137.
25. Moss DW, Bates TE (2001) Activation of murine microglial cell lines by lipopolysaccharide and interferon-gamma causes NO-mediated decreases in mitochondrial and cellular function. Eur J Neurosci 13: 529–538.
26. Gu Z, Nakamura T, Lipton SA(2010) Redox reactions induced by nitrosative stress mediate protein misfolding and mitochondrial dysfunction in neurodegenerative diseases. Mol Neurobiol 41: 55–72.
27. Gu Z, Nakamura T, Yao D, Shi ZQ, Lipton SA (2005) Nitrosative and oxidative stress links dysfunctional ubiquitination to Parkinson’s disease. Cell Death Differ 12: 1202–1204.
28. Rojo LE, Fernandez JA, Maccioni AA, Jimenez JM, Maccioni RB (2008) Neuroinflammation: implications for the pathogenesis and molecular diagnosis of Alzheimer’s disease. Arch Med Res 39: 1– 16.
29. Blasko I, Stampfer-Kountchev M, Robatscher P, Veerhuis R, Eikelenboom P, et al.(2004) How chronic inflammation can affect the brain and support the development of Alzheimer’s disease in old age: the role of microglia and astrocytes. Aging Cell 3: 169–176.
30. Wilms H, Zecca L, Rosenstiel P, Sievers J, Deuschl G, et al.(2007) Inflammation in Parkinson’s diseases and other neurodegenerative diseases: cause and therapeutic implications. Curr Pharm Des 13: 1925–1928.
31. Liu B, Gao HM, Wang JY, Jeohn GH, Cooper CL, et al.(2002) Role of nitric oxide in inflammation-mediated neurodegeneration. Ann N Y Acad Sci 962: 318–331.
32. Lowy P, Borsook H (1956) Preparation of N-substituted 1-amino-1-deoxy-D-arabinohexuloses of arginine, histidine, and lysine. J Am Chem Soc 78: 3175–3176.
33. Blasi E, Barluzzi R, Bocchini V, Mazzolla R, Bistoni F(1990) Immortalization of murine microglial cells by a v-raf/v-myc carrying retrovirus. J Neuroimmunol 27: 229–237.
34. Bocchini V, Mazzolla R, Barluzzi R, Blasi E, Sick P, et al.(1992) An immortalized cell line expresses properties of activated microglial cells. J Neurosci Res 31: 616–621.
35. Shen S, Yu S, Binek J, Chalimoniuk M, Zhang X, et al.(2005) Distinct signaling pathways for induction of type II NOS by IFNgamma and LPS in BV-2 microglial cells. Neurochem Int 47: 298–307.
36. Jiang J, Chuang DY, Zong Y, Patel J, Brownstein K, et al.(2014) Sutherlandia frutescens Ethanol Extracts Inhibit Oxidative Stress and Inflammatory Responses in Neurons and Microglial Cells. PLoS One 9: e89748.
37. Karp NA, Feret R, Rubtsov DV, Lilley KS (2008) Comparison of DIGE and post-stained gel electrophoresis with both traditional and SameSpots analysis for quantitative proteomics. Proteomics 8: 948–960.
38. Kramer A, Green J, Pollard J Jr, Tugendreich S (2014) Causal analysis approaches in Ingenuity Pathway Analysis. Bioinformatics 30: 523–530.
39. Wang Z, Eickholt J, Cheng J (2010) MULTICOM: a multi-level combination approach to protein structure prediction and its assessments in CASP8. Bioinformatics 26: 882–888.
40. Kaneko YS, Nakashima A, Mori K, Nagatsu T, Nagatsu I, et al. (2012) Microglial activation in neuroinflammation: implications for the etiology of neurodegeneration. Neurodegener Dis 10: 100–103.
42. Sethy NK, Singh M, Kumar R, Ilavazhagan G, Bhargava K(2011) Upregulation of transcription factor NRF2-mediated oxidative stress response pathway in rat brain under short-term chronic hypobaric hypoxia. Funct Integr Genomics 11: 119–137.
43. Jung JS, Shin KO, Lee YM, Shin JA, Park EM, et al. (2013) Anti-inflammatory mechanism of exogenous C2 ceramide in lipopolysaccharide-stimulated microglia. Biochim Biophys Acta 1831: 1016– 1026.
44. Dillon SA, Lowe GM, Billington D, Rahman K(2002) Dietary supplementation with aged garlic extract reduces plasma and urine concentrations of 8-iso-prostaglandin F(2 alpha) in smoking and nonsmoking men and women. J Nutr 132: 168–171.
45. Morihara N, Sumioka I, Moriguchi T, Uda N, Kyo E(2002) Aged garlic extract enhances production of nitric oxide. Life Sci 71: 509–517.
46. Ide N, Lau BH(2001) Garlic compounds minimize intracellular oxidative stress and inhibit nuclear factor-kappa b activation. J Nutr 131: 1020S–1026S.
47. Sumi S, Tsuneyoshi T, Matsuo H, Yoshimatsu T(2001) Isolation and characterization of the genes up-regulated in isolated neurons by aged garlic extract (AGE). J Nutr 131: 1096S–1099S.
48. Dillon SA, Burmi RS, Lowe GM, Billington D, Rahman K(2003) Antioxidant properties of aged garlic extract: an in vitro study incorporating human low density lipoprotein. Life Sci 72: 1583–1594.
49. Maldonado PD, Alvarez-Idaboy JR, Aguilar-Gonzalez A, Lira-Rocha A, Jung-Cook H, et al.(2011) Role of allyl group in the hydroxyl and peroxyl radical scavenging activity of S-allylcysteine. J Phys Chem B 115: 13408–13417.
50. Geng Z, Rong Y, Lau BH(1997) S-allyl cysteine inhibits activation of nuclear factor kappa B in human T cells. Free Radic Biol Med 23: 345–350.
51. Lawal AO, Ellis EM (2011) The chemopreventive effects of aged garlic extract against cadmium-induced toxicity. Environ Toxicol Pharmacol 32: 266–274.
52. Kalayarasan S, Sriram N, Sureshkumar A, Sudhandiran G(2008) Chromium (VI)-induced oxidative stress and apoptosis is reduced by garlic and its derivative S-allylcysteine through the activation of Nrf2 in the hepatocytes of Wistar rats. J Appl Toxicol 28: 908–919.
53. Mossine VV, Mawhinney TP (2007) Nalpha-(1-deoxy-D-fructos-1-yl)-L-histidine (‘‘D-Fructose-L-histidine’’): a potent copper chelator from tomato powder. J Agric Food Chem 55: 10373–10381.
54. Asehnoune K, Strassheim D, Mitra S, Kim JY, Abraham E(2004) Involvement of reactive oxygen species in Toll-like receptor 4-dependent activation of NF-kappa B. J Immunol 172: 2522–2529.
55. Zhao L, Lee JY, Hwang DH(2011) Inhibition of pattern recognition receptor-mediated inflammation by bioactive phytochemicals. Nutr Rev 69: 310–320.
56. Guijarro-Munoz I, Compte M, Alvarez-Cienfuegos A, Alvarez-Vallina L, Sanz L (2014) Lipopolysaccharide activates Toll-like receptor 4 (TLR4)-mediated NF-kappaB signaling pathway and proinflammatory response in human pericytes. J Biol Chem 289: 2457–2468.
57. Nguyen T, Nioi P, Pickett CB(2009) The Nrf2-antioxidant response element signaling pathway and its activation by oxidative stress. J Biol Chem 284: 13291–13295.