FUNDAÇÃO GETULIO VARGAS
ESCOLA DE ADMINISTRAÇÃO DE EMPRESAS DE SÃO PAULO
CRISTIANO AUGUSTO BORGES FORTI
BANK DIVIDENDS AND SIGNALING TO INFORMATION-SENSITIVE DEPOSITORS.
CRISTIANO AUGUSTO BORGES FORTI
BANK DIVIDENDS AND SIGNALING TO INFORMATION-SENSITIVE DEPOSITORS.
Tese apresentada à Escola de Administração de Empresas de São Paulo da Fundação Getulio Vargas, como requisito para obtenção do título de Doutor em Administração de Empresas. Campo de conhecimento:
Mercados Financeiros e Finanças Corporativas Orientador:
Prof. Dr. Rafael Felipe Schiozer
Forti, Cristiano Augusto Borges.
Bank dividends and signaling to information-sensitive depositors/ Cristiano Augusto Borges Forti - 2012.
Orientador: Rafael Felipe Schiozer.
Tese (doutorado) - Escola de Administração de Empresas de São Paulo. Orientador: Rafael Felipe Schiozer.
Tese (doutorado) - Escola de Administração de Empresas de São Paulo.
1. Dividendos. 2. Bancos - Brasil. 3. Bancos - Finanças. 4. Investidores (Finanças). I. Schiozer, Rafael Felipe. II. Tese (doutorado) - Escola de Administração de
Empresas de São Paulo. III. Título.
CRISTIANO AUGUSTO BORGES FORTI
BANK DIVIDENDS AND SIGNALING TO INFORMATION-SENSITIVE DEPOSITORS.
Tese apresentada à Escola de Administração de Empresas de São Paulo da Fundação Getulio Vargas, como requisito para obtenção do título de Doutor em Administração de Empresas. Campo de conhecimento:
Mercados Financeiros e Finanças Corporativas
Data de aprovação: _____ / _____ / _____
Banca Examinadora:
Prof. Dr. Rafael Felipe Schiozer (Orientador - EAESP/FGV)
Prof. Dr. Hsia Hua Sheng (EAESP/FGV)
Prof. Dr. Antonio Gledson de Carvalho (EAESP/FGV)
Prof. Dr. Paulo Renato Soares Terra (EA/UFRGS)
Agradecimentos
Agradeço,
Ao meu orientador, Rafael Felipe Schiozer, por todas as ideias, oportunidades e ao suporte que me ofereceu ao longo do meu programa de doutorado. Com ele aprendi muito, academicamente e pessoalmente, e levarei comigo seus ensinamentos.
Aos meus amigos de intercâmbio na University of Illinois at Urbana-Champaign, Luiz Ricardo Kabbach de Castro, Rafael Almeida da Matta, Igor Felizatti da Cunha e Guilherme Kirch pelas nossas infindáveis, calorosas e ricas conversas e também pela atenção e amizade.
Aos Professores Heitor Almeida e Murillo Campello, por permitirem minha visita a University of Illinois e por seus conselhos e ensinamentos.
Aos professores da EAESP, pela contribuição à minha formação acadêmica. Em especial ao Professor Richard Saito por proporcionar uma disciplina tão desafiadora a seus alunos.
Aos funcionários da EAESP, por todo auxílio que me foi dado. A CAPES, que patrocinou o meu programa de doutorado.
Ao meu pai Ajair, a minha mãe Marina e a minha irmã Ludmila, pelo apoio incondicional que me deram ao longo da minha vida.
Agradeço especialmente minha esposa Daniella. Obrigado por me ajudar de várias maneiras na conclusão deste trabalho.
RESUMO
Esta tese investiga se a composição do endividamento dos bancos afeta sua política de dividendos. Identificou-se que investidores sensíveis a informações (investidores institucionais) são alvos de sinalização através de dividendos por parte dos bancos. Utilizando uma base de dados exclusiva de bancos brasileiros, foi possível identificar vários tipos de credores, especificamente, investidores institucionais, empresas não financeiras e pessoas físicas, que são alvos potenciais de sinalização por dividendos. Adicionalmente, a existência de vários bancos de capital fechado, controlados e geridos por um pequeno grupo de acionistas, em que a sinalização direcionada a acionistas é implausível, permite inferir que bancos que utilizam mais fundos de investidores sensíveis a informações (institucionais) pagam mais dividendos, controlando por diversas características. Durante a crise financeira, este comportamento foi ainda mais pronunciado. Esta relação reforça o papel dos dividendos como uma forma custosa e crível de comunicar sobre a qualidade dos ativos dos bancos. A hipótese de que os dividendos podem ser utilizados como uma forma de expropriação dos depositantes por parte dos acionistas é refutada, uma vez que, se fosse esse o caso, observar-se-ia esse maiores dividendos em bancos com depositantes menos sensíveis a informação. Além disso, foi verificada uma relação negativa entre o pagamento de dividendos e o custo de captação (juros pagos em certificados de depósito bancário) e uma relação positiva de dividendos com o tamanho e com os lucros passados, e que os bancos de capital fechado pagam mais dividendos do que os de capital aberto, uma descoberta que também se alinha com a ideia de que os depositantes seriam os alvos da sinalização por dividendos. Finalmente, encontrou-se também uma relação negativa entre dividendos e adequação de capital do bancos, o que indica que pressões regulatórias podem induzir os bancos a pagar menos dividendos e que o pagamento de dividendos é negativamente relacionado com o crescimento da carteira de crédito, o que é consistente com a ideia de que os bancos com maiores oportunidades de investimento retêm seus lucros para aumentar seu patrimônio líquido e sua capacidade de conceder crédito.
ABSTRACT
This study investigates whether the composition of bank debt affects payout policy. I identify that information-sensitive depositors (Institutional Investors) are targets of dividend signaling by banks. I use a unique database of Brazilian banks, for which I am able to identify several types of debtholders, namely Institutional Investors, nonfinancial firms and individuals, which are potential targets of dividend signaling. I also exploit the features of the Brazilian banking system, such as the existence of several closely held banks, owned and managed by a small group of shareholders, for which shareholder-targeted signaling is implausible, and find that banks that rely more on information-sensitive (institutional) depositors for funding pay larger dividends, controlling for other features. During the financial crisis, this behavior was even more pronounced. This relationship reinforces the role of dividends as a costly and credible signal of the quality of bank assets. I also find that payout is negatively related to the banks’ cost of funding (interest rates paid on certificates of deposits), that dividends have a positive relationship with size and past profitability and that closely held banks pay more dividends than publicly traded banks, a finding that is also in line with the idea that depositors are targets of dividend-signaling. Finally, I find a negative relationship between dividends and the capital adequacy ratio, which indicates that regulatory pressure may induce banks to pay less dividends and that payouts are negatively related to the growth of the loan portfolio, consistent with the idea of banks retaining earnings to increase equity and thus their lending capacity.
Keywords: payout policy, dividends, Brazilian banks, signaling.
LISTA DE TABELAS
Table 1 – Summary of factors influencing dividend payments 17
Table 2 – Compilation of variables cited in the background section 29 Table 3 – Evolution of the brazilian banking institutions by group 34 Table 4 – Evolution of the level of concentration in brazilian banking industry 34
Table 5 – Descriptive statistics 36
Table 6 – Description of the regression variables 45
Table 7 – Descriptive statistics of dependent variables 47
Table 8 – Descriptive statistics of independent variables 48
Table 9 – Descriptive statistics of payout by group 49
Table 10 – Descriptive statistics of occurrences of each form of payment 50
Table 11 – Factors that affect the payment of dividends 57
Table 12 – Factors that affect the payment of dividends with iv 63
Table 13 – Probit regression for high level of dividends 64
Table 14 – Factors that affect dividends with placebo test 66
CONTENTS
1. Introduction ... 10
2. Background ... 15
2.1. Dividend policy ... 15
2.2. Substitutes for dividends ... 20
2.3. Bank dividends and their differences. Theory and evidence. ... 22
2.4. Bank dividends in Brazil ... 25
2.5. Institutional Investors ... 26
2.6. Summary of used variables from previous studies ... 28
3. Data ... 31
3.1. Background on the Brazilian Financial System ... 31
3.2. Data sources and sample construction ... 35
3.3. Investigation Model ... 36
4. Results ... 47
4.1. Descriptive statistics and tests results ... 47
4.2. Main Model: regression results ... 55
4.3. Robustness checks ... 60
4.3.1. Model specification robustness tests ... 60
4.3.2. Check for alternative explanations ... 61
4.4. Placebo Tests ... 65
4.5. Further signaling evidence in closely held banks ... 67
4.6. Endogenous relationship between Payout and Institutional Investors ... 74
5. Conclusion ... 77
6. References ... 79
1. Introduction
Dividend policy varies widely among firms and industries, and its effect on firm value remains controversial for finance researchers. The banking industry is among the industries with the largest payout. Dickens, Casey and Newman (2002) show that in 2000, whereas 51% of industrial US firms have not registered dividend distribution, only 8% of banks have not. Despite this fact, banks have received little attention in studies on dividends and are generally excluded from the samples of studies on firm payout.
Miller and Modigliani (1961) suggest that dividends could be used by managers to convey information on future earnings. This notion of dividend signaling was then formally modeled by Bhattacharya (1979), Miller and Rock (1985), John and Williams (1985) and many others. The basic idea is that information asymmetry is mitigated when managers use dividends to communicate information on their firm’s prospects. Most of the previous empirical research on the signaling effect of dividends has used stock price responses to dividend changes, initiations and omissions to gauge the informational content of dividends. These tests do not distinguish shareholders from debtholders as the targets of signaling and assume that the information about asset value conveyed by the dividends to both types of claimholders are reflected in stock prices.
In banks, the potential expropriation of debtholders is more severe. Banks are typically leveraged, and bank debt contracts (deposits) are standardized, with little or no room for the imposition of indentures and specific covenants. On the other hand, deposits are generally demandable. Therefore, debtholders can discipline bank managers from expropriation and excessive risk-taking by withdrawing their funds from the bank. There is empirical evidence that market discipline is exerted by holders of subordinated debt (e.g., FLANNERY and SORESCU, 1996, and IANNOTTA, 2011) and uninsured depositors (PARK and PERISTIANI, 1998, MARTINEZ-PERIA and SCHMUCKLER, 2001), which show that excessive risk-taking is punished with higher required interest rates and slower deposit growth.
Signaling with dividends reduces equity and thus is very costly for banks because of regulatory capital adequacy requirements. Therefore, it is quite plausible that bank dividends are regarded as a credible signal about the quality of their assets and future prospects to shareholders and depositors. On the other hand, depositors may view excessive dividends as an expropriation mechanism and a tool to violate the preference for debt over equity if banks are in impending distress, as Acharya et al. (2009) note. As such, increasing dividends may appear as a mixed signal to debtholders, particularly when asset opaqueness and informational asymmetry are exacerbated and depositors are not able to discern whether a bank is in financial distress (for example, during a financial crisis).
managed by a small group of people (hereafter, closely held banks), and ii) minimum mandatory dividends for publicly traded banks, required by the Brazilian legal framework.
These two features of the Brazilian banking system allow us to pursue my identification strategy. First, closely held banks, if owned and managed by a small group of individuals (e.g., a family), have no need to signal future prospects to shareholders. Therefore, if any signaling is taking place in these banks, it is directed to debtholders. Second, whereas all banks are required by law to pay minimum dividends to their shareholders, closely held Brazilian banks are able to circumvent the legal minimum dividend requirements, using a simple maneuver that works as follows: shareholders decide, at the same meeting, to pay dividends and use them to increase capital (i.e., the money does not even leave the boundaries of the firm, even though financial statements will report a dividend payment). Consequently, minimum dividends are not in fact mandatory for closely held banks. This maneuver is virtually impossible for publicly traded banks because it requires the unanimous approval of shareholders.
Most studies on dividends using Brazilian banks use reported dividends as a measure of payout and neglect this maneuver that firms perform to circumvent minimum dividend requirements, resulting in severe measurement errors.
one bank to another. Wermers (2011) also finds evidence that Institutional Investors are more financially sophisticated and reactive to new information.
I find that, among closely held banks, those that rely on Institutional Investors for funding pay larger dividends. This behavior is more pronounced during financial crises, when these banks have a greater necessity to signal their solvency and ability to yield future cash flows. Because Institutional Investors are more reactive to new information, debtholder expropriation and the violation of the preference of debt over equity in these banks are implausible. Were the banks engaging in expropriation, larger dividends would be observed among banks that have less information-sensitive depositors. This result shows that dividends are indeed a credible signal to debtholders (depositors).
Moreover, the variables CD Interest rates, Institutional Investors and the interaction between Crisis and Institutional Investors have not been previously used in dividend models because these data are usually not publicly available. The controlling for the marginal cost of funding (interest rates paid on CDs) is a clear advantage of my study over previous studies. More importantly, the variable Institutional Investors enables the disentangling of two possible interpretations: dividends as a signal to debtholders versus dividends as a tool for debtholder expropriation.
The results are relevant for shareholders and depositors of financial institutions as well as for regulators. For example, I show that when informational asymmetry and risk aversion are more pronounced, as they were during the 2008 financial crisis, even though small Brazilian banks suffered massive losses of deposits (Oliveira et al., 2012) and suffered from a lack of funding, these banks maintained or even increased dividend payments, exactly when they most needed to retain cash. The notion of paying more dividends during financial crises also has a procyclical characteristic (i.e., banks end up increasing their leverage when they most need to deleverage).
2. Background
2.1. Dividend policy
In a seminal paper about dividend policy, Lintner (1956) develops a theoretical model of decisions on corporate dividends. He argues that managers have concerns about the stability of payments and the market’s recognition of this stability by increasing firms’ market value. According to his findings, most managers assume that investors set a premium for stocks that pay stable dividends. Moreover, Lintner (1956) finds that managers first determine the dividend policy and that other policies, such as investments, debt and cash holdings, are defined from a given amount of dividends. He also suggests the existence of a positive signaling effect of an increase in dividends, as the commitment to increase the long-term disbursements of a firm would be a credible signal that the firm has the resources and capacity to sustain this extra cash outflow.
Modigliani and Miller (1961) show that dividends would be irrelevant for determining the value of the firm in the absence of market imperfections. Since then, researchers have kept their focus on the various forms of market imperfections that would affect the payout policy, such as taxes, agency costs, clientele effect and information asymmetries. As noted by Black (1976), the answer to the simple question of why firms pay dividends is not at all obvious. Therefore, Black’s (1976) "Dividend Puzzle" remains unsolved by the financial literature.
firm has no suitable investment opportunities. Koch and Sun (2004) confirm the hypothesis that changes in dividends (either up or downwards) cause investors to revise their expectations about the persistence of past earnings changes. Sant and Cowan (1994) find that managers omit dividends when earnings become more volatile. They also find that dividend omissions precede increases in return variance, beta and the dispersion of analyst earnings forecasts.
Amihud and Murgia (1997) find that in Germany, where corporate dividends are taxed at a lower rate than capital gains and thus are not tax-disadvantaged as in the US, the informational content of dividends should be lower (or inexistent). However, they find that the stock price reaction to dividend news in Germany is similar to that found in the US. The US-centered view of dividends in the financial literature reflects the tax regime, which discourages dividends. Central to this view is the "dividend puzzle" (Black (1976)): if dividends are taxed at a higher rate than capital gains, why do companies pay such high cash dividends - approximately 50 percent of net income in the US? In Germany, until recently, the distribution of corporate earnings to shareholders has not imposed higher taxes on shareholders. For most investors, taxes on earnings allocated to dividends are lower than if earnings are retained.
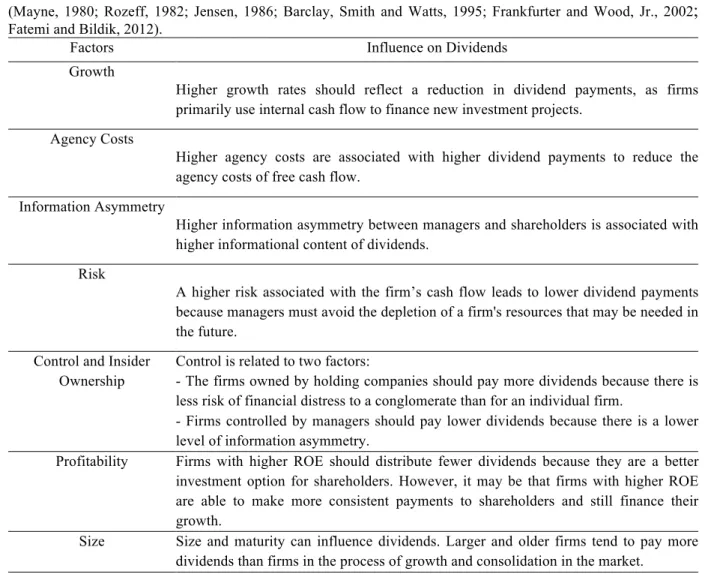
In standard empirical models, researchers investigate the factors that could influence corporate dividend behavior. Table 1 exhibits key factors of corporate dividend policy and their effect on the form of dividend payments.
Table 1 – Summary of factors influencing dividend payments
This table contains a summary of the factors influencing dividend payments that are most cited in the literature (Mayne, 1980; Rozeff, 1982; Jensen, 1986; Barclay, Smith and Watts, 1995; Frankfurter and Wood, Jr., 2002;
Fatemi and Bildik, 2012).
Factors Influence on Dividends
Growth
Higher growth rates should reflect a reduction in dividend payments, as firms primarily use internal cash flow to finance new investment projects.
Agency Costs
Higher agency costs are associated with higher dividend payments to reduce the agency costs of free cash flow.
Information Asymmetry
Higher information asymmetry between managers and shareholders is associated with higher informational content of dividends.
Risk
A higher risk associated with the firm’s cash flow leads to lower dividend payments because managers must avoid the depletion of a firm's resources that may be needed in the future.
Control and Insider Ownership
Control is related to two factors:
- The firms owned by holding companies should pay more dividends because there is less risk of financial distress to a conglomerate than for an individual firm.
- Firms controlled by managers should pay lower dividends because there is a lower level of information asymmetry.
Profitability Firms with higher ROE should distribute fewer dividends because they are a better investment option for shareholders. However, it may be that firms with higher ROE are able to make more consistent payments to shareholders and still finance their growth.
Size Size and maturity can influence dividends. Larger and older firms tend to pay more dividends than firms in the process of growth and consolidation in the market.
Source: Author
for use both in different time periods and different sectors of the economy. Rozeff (1982) finds five statistically significant variables: beta, the percentage of insider ownership, the growth rate of past earnings, the growth rate of earnings forecasts and the number of common shareholders. Using the same model, other authors, such as Dempsey and Laber (1992) and Dempsey et al. (1993), empirically verify the reliability of the five original variables using different time horizons.
Kania and Bacon (2005) also develop a model to explain the payout ratio of firms using the following variables: ROE, growth in sales, beta, liquidity, leverage, insider ownership, institutional ownership, Capex and EPS growth. They use data from publicly traded firms in the US in 2004 and find that all variables are statistically significant.
Given the diversity of models explaining payout policy, Frankfurter and Wood, Jr. (2002) make a compilation to investigate the conflict between several theoretical models that attempt to explain corporate dividends and empirical findings about them. The authors examine the methods and variables (factors) used by each model to reveal a model or a set of variables able to explain a firm’s behavior in paying cash dividends. Their findings do not support most of the theoretical predictions, and the authors argue that such contradictions reduce the empirical support for dividend theories. They also argue that dividends may contain information but that their use for signaling does not explain why firms pay dividends. The signaling effect is even more doubtful because of the ambiguity of signals (stability of cash flow versus absence of good investment opportunities).
increased (225% in nominal, and 23% in real terms) over the period 1978–2000. The authors attribute their findings to the increasing concentration of dividends over this period. Specifically, they find that in 2000, the largest 25 dividend payers paid 55% of all industrial dividends, and the largest 100 paid 82% of this total. They conclude that not only are dividends not disappearing, they are increasing and becoming more concentrated.
Renneboog and Trojanowski (2011) show that UK companies distributing funds to shareholders are usually larger, more profitable, and less levered. In addition, these companies grow more slowly and have fewer investment opportunities than their counterparts that do not distribute excess funds to shareholders. The authors also find that unlike in the US, in the UK, firms do not demonstrate a decreasing propensity to distribute cash to shareholders; despite an increase in share repurchases, dividends continue to constitute a substantial proportion of the total payout. They remark that both the US and the UK fit into the same market-based corporate governance system (with a large number of listed companies, an active market for corporate control, diffuse ownership, a common law system and strong shareholder protection) and thus investigate whether the phenomena of “decreasing propensity to pay” and “dividend substitution” are confined to the US and confirm their hypothesis.
Fatemi and Bildik (2012) find that the evolution of publicly traded firms’ characteristics worldwide toward smaller size, lower profitability and more investment opportunities explains a significant portion of the decline in dividend payers. They also find that the proportion of firms paying dividends declines significantly, providing further evidence that the evolution of the market has reduced the historical significance played by dividends. The authors use a 33-country sample and find that larger firms, with higher profitability and lower growth opportunities, have a greater propensity to pay dividends.
proportion of payers. Firms with low market capitalization, low-to-medium profitability, high investment outlays, and high rates of asset growth represent the lowest proportion of payers. Looking for countries, they find a significant decline in the average payout ratios of dividend payers.
Each country’s legal system exerts a significant influence on the dividend payout ratios of its corporate sector, leading to variations depending on whether the country’s legal system conforms to common or civil law. Interestingly, although the proportion of payers is lower in common law countries than in civil law countries, Fatemi and Bildik (2012) observe a sharp decline in the mean dividend payout ratios of firms in civil law countries and, further, that there is a pronounced increase in common law countries.
Finally, Fatemi and Bildik (2012) investigate the concentration of dividends at the global level. They find that dividends (and earnings) are highly concentrated among the largest firms, where 66% of the total amount of dividends paid in 2006 by their sample (9,121 firms across 33 countries) were paid by the 10 largest dividend payers. These findings are consistent with those of DeAngelo et al. (2004).
2.2. Substitutes for dividends
repurchases; and (4) the amount paid in dividends by firms, although high, is declining in relative terms since the mid-80s, whereas the value of buybacks has increased significantly. In addition, the value of repurchases maintains the total payout (repurchases + dividends) at relatively constant levels between 1985 and 2000. (5) Firms that reduce the amount repurchased through buyback programs experience a reduction in their share prices, but the reduction is significantly lower than that observed in those firms that cut dividends by the same amount. Grullon and Michaely (2004) show that repurchasing firms find a significant reduction in systematic risk and the cost of capital compared to non-repurchasing firms and that the reaction in stock prices is more relevant to firms that are more prone to overinvest. Their findings thus are consistent with both the signaling and agency cost theories.
John and Knyazeva (2006) also examine repurchases but do so in a context of corporate governance. Using data from US firms between 1992 and 2003, the main results are as follows: (1) Dividends are substitutes for low levels of corporate governance. Lower levels of internal and external governance are associated with higher dividends and a greater chance of repurchases. (2) A higher ROE is associated with larger dividends and buybacks. (3) Larger firms pay more dividends and repurchase more shares.
firms. These payments are legally limited to a fraction of the firm’s equity1 and taxable to shareholders but at a lower rate compared to the corporate tax rate.
The net tax burden is lower for interest on equity payments than for dividends, providing an incentive for firms to offer payouts through interest on equity up to the legal limit. Because there is also a minimum legal limit for dividends, and minimum dividends generally exceed the maximum interest on equity, firms continue to pay dividends as an addition to the tax advantages of interest on equity payments.
2.3. Bank dividends and their differences. Theory and evidence.
Mayne (1980) finds that banks linked to financial conglomerates pay higher dividends than independent banks. This larger payout would be justified by a lower risk of these institutions owned by a group of firms, which would reduce the risk of individual default. The author offers the caveat that banks owned by conglomerates are likely to transfer cash to their holding companies not only through dividends but also in the form of high management fees. These payments cannot be measured in available databases. Therefore, the actual payout may be even larger than reported for these institutions.
Boldin and Legget (1995) also investigate payout policy among US bank holding companies and find a positive relationship between dividends and bank ratings. They also find, consistent with Mayne (1980), that retained earnings represent a key source of capital for US banking holding companies.
1
Bessler and Nohel (1999) examine the effects of cutting dividends paid by US banks and conclude that dividend cuts by major banks induce a contagion effect that reduces the market value of other banks in the same segment. These findings are closely related to the informational asymmetry and signaling hypotheses and are consistent with some features of the models of bank runs of Diamond and Dybvig (1983): because bank assets are opaque, investors use information from similar banks to assess their quality.
Casey and Dickens (2000) start from the Rozeff (1982) model to develop a framework of dividend payout in banks. Due to the specific characteristics of financial institutions, the authors perform some adjustments, adding the variable capital (shareholders' equity divided by total assets) to control for the capitalization level of banks. Casey and Dickens (2000) find that leverage has a positive effect on dividends (i.e., banks with higher leverage pay larger dividends), which is consistent with the signaling effect. These findings were also previously found by Chang and Rhee (1990) and Jensen et al. (1992). However, Casey and Dickens (2000) add that the regulators set a minimum amount of capital (equity) for financial institutions and thus that banks with the highest leverage levels are forced to reduce their dividends to meet regulatory levels. It is thus an empirical issue to determine whether capital influences payout negatively or positively2.
First, Casey and Dickens (2000) apply the original Rozeff (1982) model to a dataset of banks and find that the determinants of bank dividends are different from those of nonfinancial firms, as three of the five variables of the Rozeff’s model are unimportant for bank dividends. Consequently, the Rozeff (1982) model cannot be generalized to banks. The findings of Casey and Dickens (2000), when using their own model for banks, differ when the
period of analysis changes. However, in one of the periods, the significant variables are
growth, number of shareholders and equity. The authors conclude that the main finding is the confirmation of the difference between banks and other industries.
Barclay, Smith and Watts (BSW) (1995) investigate corporate dividends and use Tobit regression instead of ordinary least squares (OLS) because of the high number of firms for which dividends are equal to zero. Dickens, Casey and Newman (2002) replicate the BSW model using an updated database and find all variables to be statistically significant and parameters to be virtually identical to those found by BSW (1995). Therefore, the explanatory factors of corporate dividends are investment opportunities, regulation system, size, and
signaling.
Once the validity of the model is confirmed, the authors are able to use a variation that is suitable for banks. These adaptations are a change in the dummy for the regulation system and the addition of three factors: inside ownership, past dividends and risk factors. Dickens, Casey and Newman (2002) use their model on a bank dataset, finding that banks’ dividend yield (the dependent variable) has a negative relationship with investment opportunities,
costs pay fewer dividends. However, the volatility of earnings shows no significance, although the signal is as expected.
Cornett et al. (2008) conduct a study on banks that have gone public, comparing pre- and post-issue dividends. They find that banks are more likely to pay dividends after the IPO; a typical characteristic of banks is to begin paying dividends soon after an IPO. In addition, they find that banks that launch dividend programs are more likely to be acquired. Cornett et al. (2008) assert that dividends may be a signal distinguishing strong banks from weak banks. Therefore, banks that pay dividends are perceived as healthier and become more attractive for an acquisition. The authors also argue that dividend payments may signal asset quality or the capacity to yield high free cash flow or even an interest in being acquired. The results indicate that a change in dividend policy has a higher signaling power for banks than for nonfinancial firms and is consistent with the finding of Dickens, Casey and Newman (2002) that the proportion of firms not paying dividends is much lower for banks than for industrial firms.
2.4. Bank dividends in Brazil
2005), the effects of interest on equity (Paiva and Lima, 2001) among others, and almost all studies exclude financial firms from their samples.
Martins and Novaes (2012) investigate Brazilian mandatory dividend rules, examining investment and dividend decisions of publicly traded firms, and they find that a significant fraction of these firms use loopholes in Brazil's mandatory dividend rules to avoid paying dividends, even though this maneuver lasts for only one year. The authors also find that the mandatory dividend rules are effective in explaining why the average dividend yield in Brazil is higher than in the US without making it harder for firms to invest.
Procianoy and Weber (2009) examine the determinants of bank dividends in Brazil and assess whether there are differences against the findings by Heineberg and Procianoy (2003) for nonfinancial firms. It is important to note that they failed to consider that reported dividends do not necessarily correspond to actual payout. As mentioned before, it is possible for a Brazilian firm to circumvent the legal obligation to distribute 25% of its annual income. As such, these studies may have incurred in serious measurement error.
2.5. Institutional Investors
Among authors who have studied the role of Institutional Investors as claimholders of the firms, Grinstein and Michaely (2005) define them as distinctive (relative to individual investors) in that they are likely to be better scrutinizers and to enjoy an informational advantage. Institutional Investors also have the benefit of a tax advantage (US Institutional Investors) on dividends relative to individuals and are subject to prudent-man rules.
that with enhanced monitoring, firms are more likely to pay out their free cash flow. Assuming that Institutional Investors are better able to monitor managers’ activities, these theories imply that larger institutional holdings will lead to higher payouts (holding all else constant).
Investigating equity holdings, Grinstein and Michaely (2005) examine the relationship between Institutional Investors’ holdings and payout policy in the US. They find clear evidence that Institutional Investors prefer dividend-paying firms even after controlling for size, risk and market-to-book ratio. They also find that firms that increase their dividends do not attract more institutional holdings and that despite a potentially larger tax advantage and/or prudent-man rule restrictions, pension funds and bank trusts do not show a preference for high dividends in terms of dividends scaled by earnings. Finally, they find that Institutional Investors’ ownership and concentration of ownership do not cause firms to increase payout.
(2011) state that these mechanisms are likely to make Institutional Investors more reactive than individual investors to bad news.
If these assumptions are true, Institutional Investors are more sensitive and reactive to bad news. First, they have portfolio managers that are responsible for the assets allocation and, at least, they respond for fails in their allocation. Second, they are more structured to monitor their investment portfolios. In short, they are information-sensitive.
2.6. Summary of used variables from previous studies
Table 2 – Compilation of variables cited in the background section
This table contains a compilation of name, type, comments (when necessary) and authors of each variable cited in the background section.
Name Type Comments Author
Changes in Dividend Payout
Dependent Lintner (1956)
Dividend Payout Dependent Rozeff(1982), Casey and
Dickens(2000), Kania and Bacon (2005); Mayne (1980)
Dividend Yield Dependent Barclay, Smith and Watts (1995),
Dickens, Casey and Newman (2002)
ROA Explanatory Aivazian, Booth and Cleary (2003);
Kania and Bacon (2005); John and Knyazeva(2006) Size Explanatory Some studies use the natural logarithm of Total
Assets, while others use natural logarithm of sales.
Moh´d, Perry and Rimbey(1995), Mayne (1980), Fatemi and Bildik (2012) Renneboog and Trojanowski (2011)
Past Dividends Explanatory Mick and Bacon (2003),
Lintner(1956), Dickens, Casey and Newman (2002),
Insiders Explanatory Volume or percentage of shares held by managers.
Rozeff(1982), Casey and Dickens(2000), Kania and Bacon (2005), Dickens, Casey and Newman (2002)
Institutional Ownership
Explanatory Indicates whether a conglomerate controls the firm. Some authors use a dummy variable, while others use the participation of institutional owners in relative terms in a continuous variable.
Kania and Bacon (2005), Mayne (1980)
Profit Growth Explanatory Rozeff(1982), Casey and
Dickens(2000), Kania and Bacon (2005), Mayne (1980)
Sales Growth Explanatory Kania and Bacon (2005)
Expected profit growth rate
Explanatory Rozeff(1982), Casey and
Dickens(2000), Barclay, Smith and Watts (1995), Dickens, Casey and Newman (2002)
Beta Explanatory Proxy for operational and financial risk of the firm.
Rozeff(1982), Casey and
Dickens(2000), Kania and Bacon (2005)
Number of Shareholders
Explanatory Spread of control and agency costs. Rozeff(1982), Casey and Dickens(2000)
Capital Explanatory Equity on Assets. Papers about banks use this variable as a proxy for the Banks Regulatory Control.
Casey and Dickens(2000), Mayne (1980), Barclay, Smith and Watts (1995), Dickens, Casey and Newman (2002)
Liquidity Explanatory Kania and Bacon (2005)
Leverage Explanatory Kania and Bacon (2005)
Capex Explanatory Kania and Bacon (2005)
Operational Profit (EBIT)
Explanatory Natural logarithm of Operational Profit Mayne (1980), Barclay, Smith and Watts (1995), Dickens, Casey and Newman (2002)
Market to Book Explanatory Proxy for Growth Opportunities Barclay, Smith and Watts (1995), Dickens, Casey and Newman (2002) Earnings
Volatility
Explanatory Standard deviation of past earnings Dickens, Casey and Newman (2002)
Most of the variables listed in Table 2 are control variables that allow us to pursue my
3. Data
3.1. Background on the Brazilian Financial System
Since the launch of the inflation stabilization plan (Plano Real) in 1994, the Brazilian financial system has experienced extensive restructuring. With the stabilization of inflation, banks struggled in their attempts to find new sources of profits. As Oliveira (2007) notes, one of Brazilian banks’ first actions was to increase non-interest revenues by charging service fees. Meanwhile, banks began trying to cut costs to reduce non-interest expenses. The other procedure was to increase interest revenues through credit operations. However, lending practices were still developing, and the risk assessment of credit operations was incipient in Brazilian banks at that time.
At the same time, the Mexican crisis of 1995 inhibited economic growth in Brazil, which, conjugated with poor quality risk assessment, led to an increase in loan losses. As a result, in the second half of 1995, two major banks (Banco Economico and Banco Nacional) faced distress, forcing the Central Bank of Brazil to intervene. Such interventions created uncertainties about the financial health of the Brazilian banking industry. Soon after, the government launched major restructuring programs to prevent a systemic crisis (Goldfajn et al., 2003).
At the same time, the Central Bank of Brazil launched the PROER (Program of Incentives for Restructuring and Strengthening the National Financial System). According to Goldfajn et al. (2003), PROER incorporated some innovative aspects into the restructuring framework for Brazil’s banking industry, in particular by requiring changes in institutional ownership and making managers and owners legally and administratively responsible for their actions. The Central Bank of Brazil began to intervene in banks, and a series of mergers and acquisitions took place, providing room for the increased participation of foreign banks in the Brazilian market.
Brazilian regulations demand that banks elicit to the Central Bank the specific controlling shareholder or block of shareholders and classifies banks operating in the country into three groups: (1) Privately owned banks, (2) Governmental banks and (3) Foreign banks3. To adjust the Central Bank of Brazil’s banking classification to my identification strategy, I further separate the group of privately owned banks according to their ownership structure into two subgroups: (a) Closely held with domestic control and (b) Publicly traded with domestic control.
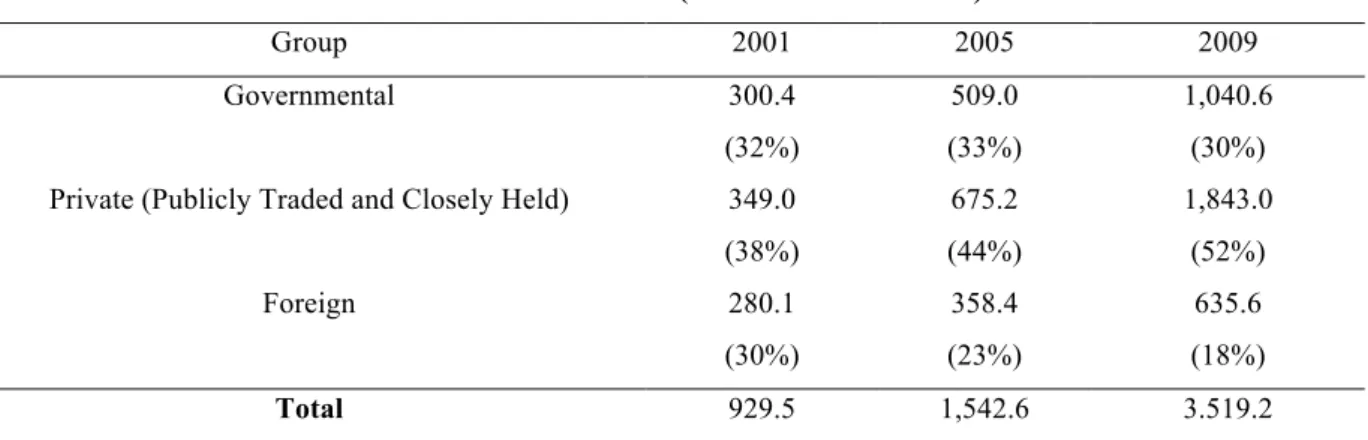
Banks controlled by either the federal government or states of the federation compose the group of governmental banks. Despite being few in number, they play an important role in the banking sector, as the two main governmental banks (Bank of Brazil and Caixa Economica Federal – Federal Saving Bank) are among the five largest banks operating in Brazil, representing almost 30% of all assets and 42% of all credit operations of the Brazilian banking system in 2009 (See Table 3).
The Central Bank of Brazil defines foreign banks as banks with full foreign capital or under foreign control. These banks are typically full subsidiaries of foreign financial
institutions and are subject to the same type of regulation of domestic banks. Table 3 (Panel
A and B) shows that since 2001, these banks have lost ground in the Brazilian banking market in terms of market share.
Brazil’s privately owned banks are controlled by domestic shareholders. The group of publicly traded banks comprises banks controlled by domestic shareholders with a minority share of stock traded on exchanges. The group of closely held banks is composed of banks also controlled by domestic shareholders, but their stocks are not traded on exchanges. In this group are virtually no minority shareholders, and whenever they exist, a control agreement between majority and minority shareholders is required by the Central Bank. This group constitute the majority of banks in the Brazilian banking industry. Typically, closely held banks have very concentrated ownership, with their shares belonging to one single shareholder or a small group of individuals (in many cases, a family) who also hold top management positions or are on the board of directors.
Another remarkable feature of the Brazilian banking system is its concentration. Historically, the country has had few big banks that have a large share of the total assets of the banking system. In 2001, the six largest banks accounted for 63% of total assets (see Table 4). In 2009, concentration increased due to mergers and acquisitions, and the top six banks
Table 3 – Evolution of the Brazilian banking institutions by group
This table exhibits the evolution of the Brazilian banking institutions by Group. Panel A exhibits the evolution of total assets by the Central Bank of Brazil’s group in BLR Billions. Panel B exhibits the evolution of credit by Central Bank of Brazil’s group in BLR Billions. Percentage of the total in brackets.
PANEL A – Total Assets (values in BLR Billions)
Group 2001 2005 2009
Governmental 300.4 509.0 1,040.6
(32%) (33%) (30%)
Private (Publicly Traded and Closely Held) 349.0 675.2 1,843.0
(38%) (44%) (52%)
Foreign 280.1 358.4 635.6
(30%) (23%) (18%)
Total 929.5 1,542.6 3.519.2
PANEL B – Total Loans (values in BLR Billions)
Group 2001 2005 2009
Governmental 57.7 127.3 371.4
(25%) (31%) (42%)
Private (Publicly Traded and Closely Held) 98.3 170.4 343.9
(43%) (42%) (39%)
Foreign 73.5 110.0 173.9
(32%) (27%) (19%)
Total 229.5 407.7 889.2
Source: Central Bank of Brazil
Table 4 – Evolution of the level of concentration in Brazilian banking industry This table exhibits the evolution of the level of concentration in Brazilian banking industry. Values in millions.
Year Total assets (BLR) Percentage of assets of 6 largest banks
2001 929.5 63%
2005 1,542.6 65%
2009 3,519.2 91%
3.2. Data sources and sample construction
This study uses two data sources. The first set of data is available to the public, provided by the Central Bank of Brazil. The data consist of annual observations of all banks in Brazil between 2001 and 2009. They include detailed balance sheet, income and earnings reports and selected regulatory indicators, such as the capital adequacy ratio for all Brazilian banks. From an initial sample of 204 banks, I exclude subsidiaries of other banks in the sample. I use this procedure to consider only the effective payout of banks to shareholders and avoid considering dividends being paid by one bank to another, which is more closely related to the concept of internal capital markets than to dividends.
A second database, containing private data provided by the Central Bank of Brazil, comprises daily balances of certificates of deposits in the hands of Institutional Investors, non-financial firms and individual investors, as well as the annual weighted average interest rates paid on certificate of deposits issued by each bank.
Through the consolidation of both databases, I remain with an unbalanced panel of 177 banks in 9 years and 1537 bank-years. Table 5 describes the number of cross-sectional
Table 5 – Descriptive statistics
This table exhibits descriptive statistics of the sample. For each year it presents the number of banks, of governmental banks, of publicly traded banks, of closely held banks, of foreign banks and number of banks belonging to conglomerates. The banks belonging to conglomerates, except the ones that are directly controlled by a nonfinancial firm were dropped from the final dataset.
Year # of Banks
# of Governmental
Banks
# of Publicly traded banks
# of Closely held banks
# of Foreign banks
# of Banks Belonging to Conglomerates
2001 185 17 4 92 72 8
2002 182 16 4 92 70 7
2003 178 15 4 91 68 7
2004 171 15 4 89 63 6
2005 169 15 4 89 61 6
2006 165 14 4 89 58 6
2007 165 14 10 85 56 6
2008 165 12 12 86 55 6
2009 159 9 12 85 53 4
Source: Author
3.3. Investigation Model
As mentioned before, the identification strategy exploits specific features found in Brazilian banks, such as the existence of many banks that do not have publicly traded shares and are owned and managed by a small group of people (closely held banks) and the existence of minimum mandatory dividends for publicly traded banks, required by the Brazilian legal framework.
First, closely held banks, owned and managed by a small group of individuals (e.g., a family), have little or no need to signal future prospects to shareholders. Therefore, if these banks are engaging in any signaling, it is directed to debtholders. Second, closely held Brazilian banks are able to easily circumvent the legal minimum dividend requirements, whereas all other banks are required by law to pay minimum dividends4. Consequently,
minimum dividends are not in fact mandatory for closely held banks. These combined features allow for the conclusion that dividends paid by closely held banks are not due to legal requirements or a signal to shareholders.
Because the main purpose of this study is to investigate whether the composition of bank debt affects payout policy, I make no further distinction between dividends, interest on equity and share repurchases. Consequently, hereafter I use the terms dividends and payout
interchangeably to refer to the sum of dividends, interest on equity and repurchases.
The entire new set of variables is winsorized at the 0.025 level to address the potential problem of extreme observations or measurement errors. From this point, it is assumed that all variables were treated and that outliers no longer interfere with test results.
To investigate whether the composition of bank debt affects payout policy, I first consider the most relevant control variables used by previous papers (Mayne, 1980; Rozeff, 1982; Barclay, Smith and Watts, 1995; Nissim and Ziv, 2001; Cornett et al., 2008; Renneboog and Trojanowski, 2011; Fatemi and Bildik, 2012). Details of the previous use of each variable by the related papers can be observed in Table 2. Then, other explanatory
variables are proposed as follows.
- Payout: This is the dependent variable and is calculated as the sum of dividends, repurchases and interest on equity divided by earnings. Alternatively, bank equity is used in the denominator. This variable represents the proportion of earnings (or equity) paid to shareholders. I add dividends and interest on equity because whether there is anything that influences the choice of firms for one of these options, the study conducted by Boulton et al. (2010) does not provide evidence
that such a selection affects the total cash flow to shareholders. As mentioned before, the actual payout may be different from the reported payout because of a maneuver that works as follows: shareholders determine at the same meeting to pay dividends and reinvest them to increase capital. The money does not even leave the firm, even though financial statements will report a dividend payment to shareholders. Specifically, I search for increases in capital in the Statement of Changes in Equity (SOCE) for each period when the bank made a payment of interest on equity. When there is a simultaneous increase in capital and dividend payments, the value of the increase in capital is subtracted from the reported payout to determine the actual payout. This maneuver is particularly useful for banks because they can use interest on equity as a tax shield (because interest in equity is considered a financial expense) without effectively paying out to shareholders.
dividends. Therefore, the finding of a positive signal is evidence supporting the signaling theory.
- Crisis Dummy: This is an indicator variable that assumes a value of 1 for the 2008 year and 0 otherwise. The year 2008 was selected as a crisis year based on a study by Aït-Sahalia et al. (2010), which states that the global crisis began in 2008, despite the sub-prime crisis, which started in 2007 but did not spread overseas. The 2008 crisis is exogenous to the Brazilian banking system because the Brazilian banks were not exposed to the financial products that sparked the crisis (Oliveira et al., 2012). Based on prudential theories, it is expected that in general, banks pay smaller dividends during crises to be better able to endure the turbulence of a financial turmoil. However, based on signaling theory, it is expected that during the crisis, informational asymmetry is exacerbated and banks face the need to signal their solvency and ability to generate future cash flows. - Crisis Dummy x Institutional Investors: This is an interaction variable between the
- Size: I measure size as the natural logarithm of assets. As in previous studies (Fatemi and Bildik, 2012; Renneboog and Trojanowski, 2011; Moh´d, Perry and Rimbey, 1995; Mayne, 1980), it is expected that larger banks have a higher propensity to pay dividends than small banks.
- Return on assets (ROA): This term controls for banks’ profitability. I expect that profitable banks pay more than others. A positive sign is expected (Aivazian, Booth and Cleary, 2003; Kania and Bacon, 2005; John and Knyazeva, 2006) - Capital adequacy ratio: The effect of capitalization on dividends is ambiguous. On
the one hand, capital-constrained banks may be influenced by the regulatory system to retain earnings and thus pay fewer dividends, causing capital to have a negative influence on bank dividends. Pereira and Saito (2010) find that banks in Brazil face pressure to increase capital as their capital adequacy ratio approaches the minimum regulatory requirement. Therefore, they are likely to retain earnings and follow the pecking order, using retained earnings as the primary financing source. On the other hand, low-capitalized banks face a greater necessity to signal the quality of their assets to the main providers of funding (depositors and other debtholders). Which effect dominates the other is thus an empirical question. I use the first lag of capital in my model.
their portfolio quality due to the regulation system model. Therefore, some banks may face the necessity of a reduction in the dividends level to adjust their capital adequacy. In dividend payout models for financial firms, capital level is widely used as an explanatory variable as well (Casey and Dickens, 2000; Mayne, 1980; Barclay, Smith and Watts, 1995; Dickens, Casey and Newman, 2002). I use the first lag of leverage in my model due to the influence of leverage on dividends. The expected sign of leverage is an empirical issue, as noted above, and thus cannot be defined in advance.
- Interest paid on certificates of deposit (CDs): Because CDs represent the primary source of funding for Brazilian banks, the interest rate paid on CDs is a proxy for financial constraints. As noted by Paravisini (2008), the optimal response of an unconstrained bank to an expansion in external financing without altering the cost of capital is to distribute it among investors as dividends or to expand lending (as long as loans have positive NPVs). The same underlying idea is behind the investment-cash flow literature in corporate finance. Because I control for lending expansion, I expect interest paid on CDs to be negatively related to payout. A negative signal also indicates that, ceteris paribus, a higher marginal cost of funding is associated with a lower propensity to pay dividends, which is consistent with the idea that dividends are costly.
dummies will provide the difference between each other. However, in some robustness checks, I use this variable in interactions with other variables.
- Governmental bank dummy: This indicator variable assumes a value of 1 for banks controlled by the government and 0 otherwise. I expect that governmental banks pay less than closely held banks because these banks may be perceived as enjoying an implicit guarantee from the government and thus as having less need to signal their quality.
- Subsidiaries of foreign banks dummy: This indicator variable assumes a value of 1 for banks that are subsidiaries of foreign banks and 0 otherwise. Because most of these banks are organized as full subsidiaries (i.e., have one single shareholder), they can also easily circumvent minimum dividend requirements.
interpretation can be made by analyzing the effect of information-sensitive depositors.
- Growth in loans: measures the growth rate of the loan portfolio. To increase the loan portfolio, banks need more equity and consequently pay fewer dividends. I thus expect a negative sign for this variable.
- Credit Risk measures the observable quality of a bank's assets. Banks with low portfolio quality should reduce their dividend payments to prevent liquidity problems. I use the ratio between loan loss reserves and total loans as the measure of loan risk. I expect a negative sign for this variable.
Equation (1) summarizes the previous discussion:
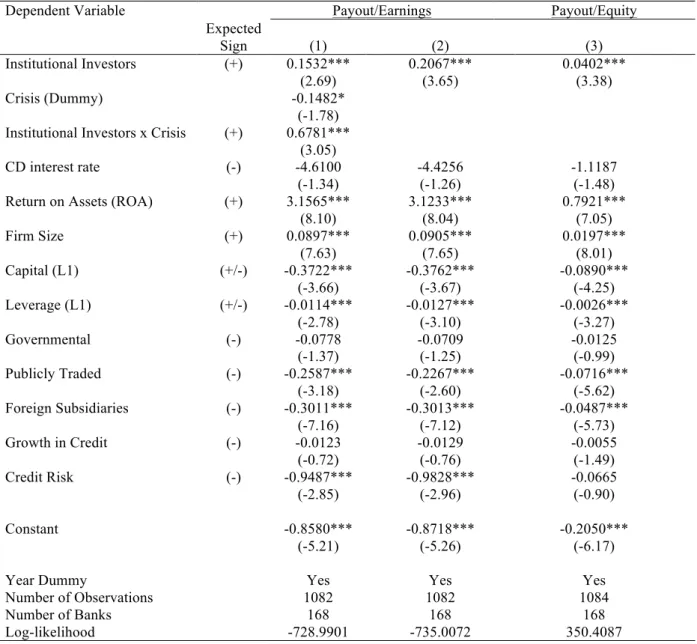
Payouti,t = α + Institutional Investorsi,t + Crisist + (Crisist x Institutional Investorsi,t) + CD Interest
Ratesi,t + ROAi,t + Sizei,t + Capitali,t-1 + Leveragei,t-1 + Governmentali,t + Publicly
Tradedi + Foreign banki,t + Credit Growthi,t + Credit Riski,t + dt + εi,t
(1)
Where i and t represent the firm and year, respectively, and α, d andε represent the intercept,
year dummies and error term, respectively. The list of variables created, their basic rationale, their formulas, as well as the expected signs for the model to be presented in the next section are exhibited in Table 6.
over previous studies. More importantly, the variable Institutional Investors allows us to disentangle two possible interpretations: dividends as a signal to debtholders versus dividends as a tool for debtholder expropriation.
An important characteristic of the sample, which interferes directly in the empirical methodology applied, lies in the fact that the value of the dividends is equal to zero in approximately 40% of the observations. For this reason, I use a censored Tobit panel model (I do not use bank fixed effects, as some variables refer to time-invariant characteristics of banks, such as government ownership). An alternative investigation about the use of OLS instead of Tobit can be observed in appendix 1.
Endogeneity problems can arise from selection bias, where the choice of the bank by Institutional Investors can be made using previous information such as the level of dividends or the profitability of the bank. To address this issue, I also run a Tobit model with instrumental variables. (I call them IVtobit models). They use instrumental variables for Institutional Investors aiming to clear the endogenous relationship between the level of Institutional Investors and the payout of each bank. The instruments are the past levels of Institutional Investors and the variable big bank (see Table 6). Tests of the validity of the
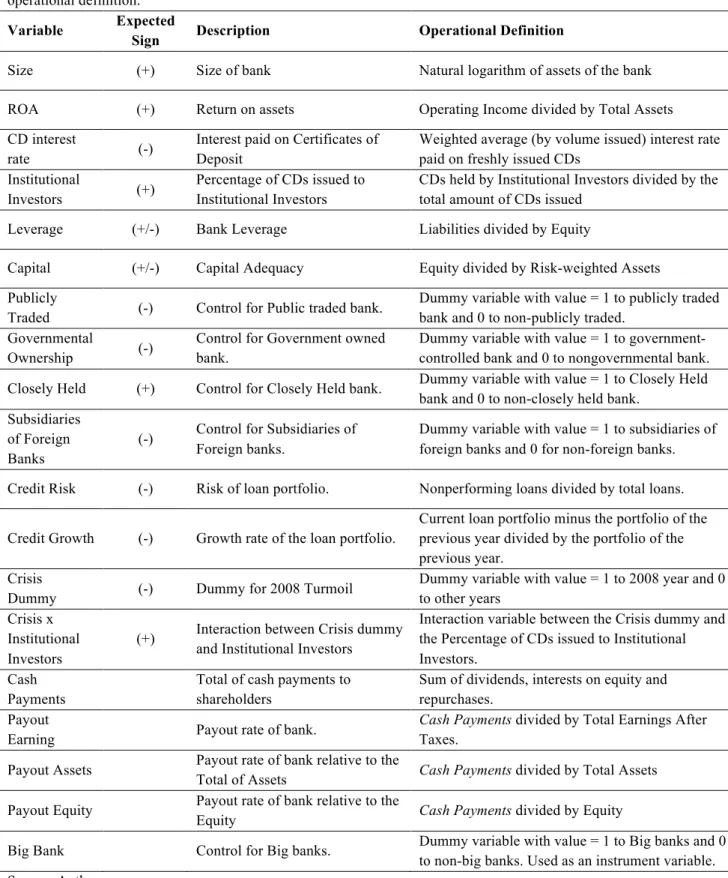
Table 6 – Description of the regression variables
This table describes the regression variables. The first column gives the name used in the econometric model and in other tables, the second exhibit the expected sign for the parameter, the third describes and the fourth shows the operational definition.
Variable Expected
Sign Description Operational Definition
Size (+) Size of bank Natural logarithm of assets of the bank
ROA (+) Return on assets Operating Income divided by Total Assets CD interest
rate (-)
Interest paid on Certificates of Deposit
Weighted average (by volume issued) interest rate paid on freshly issued CDs
Institutional
Investors (+)
Percentage of CDs issued to Institutional Investors
CDs held by Institutional Investors divided by the total amount of CDs issued
Leverage (+/-) Bank Leverage Liabilities divided by Equity
Capital (+/-) Capital Adequacy Equity divided by Risk-weighted Assets Publicly
Traded (-) Control for Public traded bank.
Dummy variable with value = 1 to publicly traded bank and 0 to non-publicly traded.
Governmental
Ownership (-)
Control for Government owned bank.
Dummy variable with value = 1 to government-controlled bank and 0 to nongovernmental bank.
Closely Held (+) Control for Closely Held bank. Dummy variable with value = 1 to Closely Held bank and 0 to non-closely held bank.
Subsidiaries of Foreign Banks
(-) Control for Subsidiaries of Foreign banks.
Dummy variable with value = 1 to subsidiaries of foreign banks and 0 for non-foreign banks.
Credit Risk (-) Risk of loan portfolio. Nonperforming loans divided by total loans.
Credit Growth (-) Growth rate of the loan portfolio.
Current loan portfolio minus the portfolio of the previous year divided by the portfolio of the previous year.
Crisis
Dummy (-) Dummy for 2008 Turmoil
Dummy variable with value = 1 to 2008 year and 0 to other years
Crisis x Institutional Investors
(+) Interaction between Crisis dummy and Institutional Investors
Interaction variable between the Crisis dummy and the Percentage of CDs issued to Institutional Investors.
Cash Payments
Total of cash payments to shareholders
Sum of dividends, interests on equity and repurchases.
Payout
Earning Payout rate of bank.
Cash Payments divided by Total Earnings After Taxes.
Payout Assets Payout rate of bank relative to the
Total of Assets Cash Payments divided by Total Assets
Payout Equity Payout rate of bank relative to the
Equity Cash Payments divided by Equity
Furthermore, substantial empirical robustness comes from the use of the crisis dummy because for Brazilian banks, the 2008 crisis is an exogenous shock. Taking these considerations together with the share of Institutional Investors’ holdings of any bank during the 2008 crisis produces a robust variable without any internal interference or selection bias5. This combination is stronger than any instrument. A further comprehensive set of robustness checks also help to ensure the interpretation of my findings.
4. Results
4.1. Descriptive statistics and tests results
Table 7, 8 and 9 present summary statistics of the total payout and explanatory
variables. Table 7, Panel A, presents the two dependent variables used in models to explain
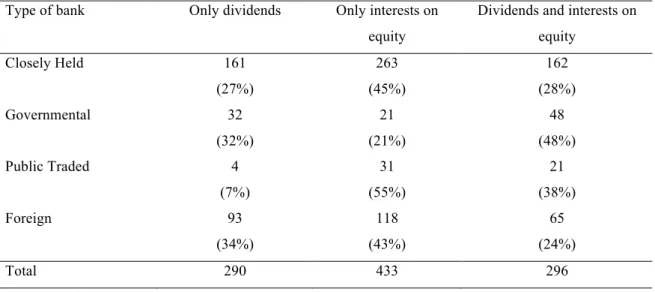
the dividend policy of banks (Total Payout/Earnings and Total Payout/Equity). Although these variables have different magnitudes, they exhibit remarkably similar behavior over time (see Figure 2). Panel B shows the amount of cash distributed by the banks between 2001 and 2009, and three main characteristics are observed: (1) There is a remarkable and roughly constant growth rate in the total payout. (2) The amounts of interest on equity and dividends are similar in magnitude. (3) Unlike in the US, the value of repurchases represents only 2.9% of the total payments to shareholders (see Figure 1, Panels 1 and 2).
Table 7 – Descriptive statistics of dependent variables
This table exhibits descriptive statistics of dependent variables. Panel A shows the mean value of the two dependent variables over the years. Panel B shows the payments’ magnitude of each form allowed by Brazilian Tax laws. The sample includes all banks in activity in Brazil between 2001 and 2009 except banks belonging to conglomerates.
Panel A Panel B
Year PAYOUT/
EQUITY PAYOUT/ EARNINGS Dividends BLR (M) Interests on Equity BLR (M) Repurchases BLR (M) Total Payments BLR (M)
2001 0.034 0.247 1,841 3,135 268 5,244
2002 0.064 0.306 8,019 3,584 230 11,833
2003 0.058 0.269 5,801 7,843 358 14,002
2004 0.041 0.220 5,549 7,120 157 12,826
2005 0.054 0.265 8,396 11,449 1,332 21,177
2006 0.045 0.218 5,487 11,083 68 16,638
2007 0.039 0.211 11,934 10,049 476 22,459
2008 0.048 0.318 12,745 12,918 1,354 27,017
2009 0.051 0.329 11,355 13,733 309 25,397
Total 71,127 80,912 4,553 156,592
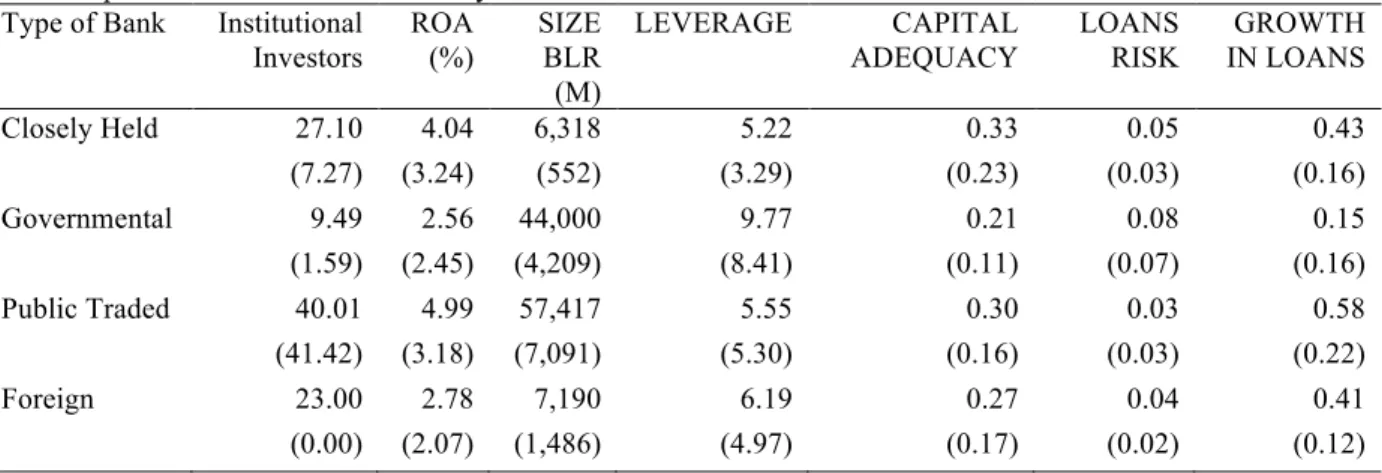
Table 8 shows descriptive statistics for the independent variables by bank group. Closely held and publicly traded banks rely more on Institutional Investors (27% and 40%, respectively), although the distribution in both is quite different because the median for the closely held banks is only 7.3% while the median for the publicly traded banks is almost the same as the mean, 41.4%. The governmental and foreign banks are remarkably less profitable than their counterparts: the ROA (Return on Assets) of the closely held and publicly traded banks are quite similar (4% and 5%, respectively), while the ROA of the governmental and foreign banks are only 2.5% and 2.8%, respectively. The governmental and publicly traded banks are larger than the closely held and foreign banks. Also, the governmental banks have almost double the leverage level of their counterparts and, consequently, a lower capital adequacy ratio. The loan portfolio of the governmental banks also grew more slowly than those of their peers during the sample period.
Table 8 – Descriptive statistics of independent variables
Descriptive statistics. This table exhibits the mean and median (in brackets) for the explanatory variables of the regressions. The column Institutional Investors shows the percentage of CDs issued to Institutional Investors, ROA shows the Return on Assets, Size here shows the magnitude of Total Assets in BLR (Millions), Leverage shows Liabilities divided by Equity, Capital Adequacy is Equity Divided by Risk-weighted Assets, Credit Risk shows the nonperforming loans divided by total loans, Credit Growth is the growth rate of the loan portfolio. The sample includes all banks in activity in Brazil between 2001 and 2009.
Type of Bank Institutional Investors ROA (%) SIZE BLR (M)
LEVERAGE CAPITAL
ADEQUACY
LOANS RISK
GROWTH IN LOANS
Closely Held 27.10 4.04 6,318 5.22 0.33 0.05 0.43
(7.27) (3.24) (552) (3.29) (0.23) (0.03) (0.16)
Governmental 9.49 2.56 44,000 9.77 0.21 0.08 0.15
(1.59) (2.45) (4,209) (8.41) (0.11) (0.07) (0.16)
Public Traded 40.01 4.99 57,417 5.55 0.30 0.03 0.58
(41.42) (3.18) (7,091) (5.30) (0.16) (0.03) (0.22)
Foreign 23.00 2.78 7,190 6.19 0.27 0.04 0.41
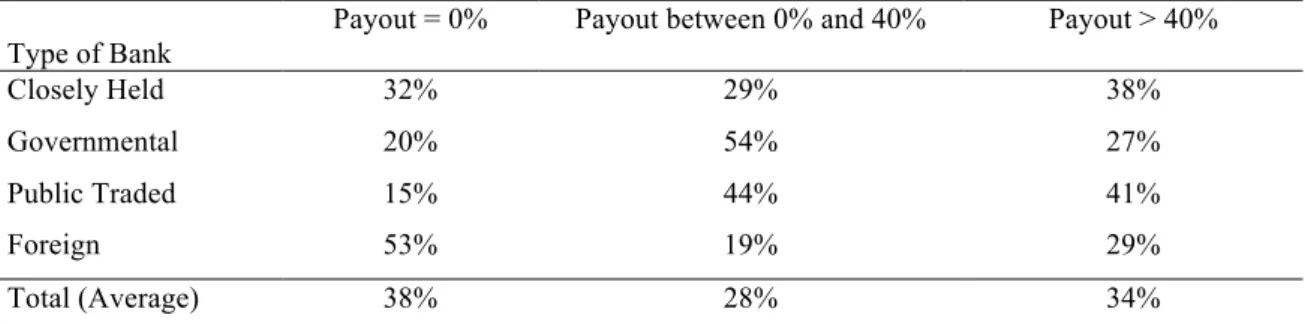
Table 9 shows descriptive statistics for the distribution of the payouts over the subgroup of banks. The foreign banks have a higher frequency of payouts (payout/earnings) equal to 0%, the governmental banks have a higher frequency of payouts between 0% and 40%, and the closely held and publicly traded banks have a higher frequency of payouts greater than 40% of their earnings.
Table 9 – Descriptive statistics of payout by group
Descriptive statistics. This table exhibits the percentage of payout (payout/earnings) for each sub group of banks in Brazil. The column “Payout = 0%“ shows the percentage of observations on the sample with payout equal to zero. Column “Payout between 0% and 40%“ shows the percentage of observations where the payout is higher than 0% and lower than 40%. Column “Payout> 40%” shows the percentage of observations where the payout is higher than 40%. The sample includes all banks in activity in Brazil between 2001 and 2009.
Type of Bank
Payout = 0% Payout between 0% and 40% Payout > 40%
Closely Held 32% 29% 38%
Governmental 20% 54% 27%
Public Traded 15% 44% 41%
Foreign 53% 19% 29%
Total (Average) 38% 28% 34%
Source: Author