Reliability of CBCT in the diagnosis
of dental asymmetry
Antônio Carlos de Oliveira Ruellas1, Leonardo Koerich2, Carolina Baratieri3, Claudia Trindade Mattos4, Matheus Alves Junior5, Daniel Brunetto5, Lindsey Eidson6
Objective: The aim of this study was to validate a method used to assess dental asymmetry, in relation to the
skel-etal midline, by means of CBCT. Methods: Ten patients who had CBCT scans taken were randomly selected for
this study. Five different observers repeated 10 landmarks (x, y and z variables for each) and 12 linear measurements within 10 days. Measurements were taken in both arches to evaluate symmetry of first molars, canines and dental midline in relation to the skeletal midline. Intraclass correlation coefficient (ICC) was carried out to assess intra- and interobserver reliability for landmarks and distances. Average mean difference was also assessed to check measurement errors between observers. Results: ICC landmarks was ≥ 0.9 for 27 (90%) and 25 (83%) variables for intra- and
in-terobserver, respectively. ICC for distances was ≥ 0.9 for 7 (58%) and 5 (42%), respectively. All ICC landmarks for distances were >0.75 for both intra- and interobserver. The mean difference between observers was ≤ 0.6 mm for all the distances. Conclusion: The method used to assess dental asymmetry by means of CBCT is valid. Measurements
of molars, canines and dental midline symmetry with the skeletal midline are reproducible and reliable when taken by means of CBCT and by different operators.
Keywords:Cone-beam computed tomography. Imaging. Three-dimensional diagnosis. Dental arch.
How to cite this article: Ruellas ACO, Koerich L, Baratieri C, Mattos CT, Alves Junior M, Brunetto D, Eidson L. Reliability of CBCT in the diagnosis of dental asymmetry. Dental Press J Orthod. 2014 Mar-Apr;19(2):90-5. doi: http:// dx.doi.org/10.1590/2176-9451.19.2.090-095.oar
» The authors report no commercial, proprietary or financial interest in the products or companies described in this article.
» Patients displayed in this article previously approved the use of their facial and in-traoral photographs.
Contact address: Antônio Carlos de Oliveira Ruellas
Rua Professor Rodolpho Paulo Rocco, 325 – Rio de Janeiro/RJ — Brazil. CEP: 21941-913 – E-mail: [email protected]
1 Phd in Dentistry and Adjunct Professor, Federal University of Rio de Janeiro
(UFRJ).
2 MSc in Orthodontics, UFRJ.
3 Phd in Orthodontics, UFRJ.
4 Phd in Orthodontics, UFRJ. Adjunct Professor, UFF.
5 Doctorate student in Orthodontics, UFRJ.
6 MSc in Orthodontics, University of North Carolina.
Submitted: September 15, 2012 - Revised and accepted: January 19, 2013
Objetivo: validar um método para avaliar assimetria dentária, em relação à linha média esquelética, usando TCFC.
Métodos: dez pacientes que realizaram TCFC foram selecionados aleatoriamente para esse estudo. Cinco diferentes observadores repetiram 10 pontos de referência (com variáveis x, y e z, para cada ponto) e 12 medidas lineares em um intervalo de 10 dias. As medições foram realizadas em ambas as arcadas, para avaliar a simetria de primeiros mo-lares, caninos e linha média dentária, em relação à linha média esquelética. Índice de correlação intraclasse (ICC) foi realizado para verificar a confiabilidade intraobservador e interobservadores para os pontos de referência e distâncias. A diferença média também foi avaliada, para checar os erros de mensuração entre os observadores. Resultados: ICC para os pontos de referência foram ≥ 0,9 para 27 (90%) e 25 (83%) das variáveis para intra- e interobservadores res-pectivamente. ICC para distâncias foi ≥ 0,9 para 7 (58%) e 5 (42%), resres-pectivamente. Todas as medidas de ICC para distâncias foram > 0,75 para intraobservador e interobservadores. A diferença média entre observadores foi ≤ 0,6mm para todas as distâncias. Conclusão: o método de verificação de assimetria dentária utilizando TCFC é válido. Medi-ções de molares, caninos e linha média dentária com a linha média esquelética são reproduzíveis e confiáveis quando feitas utilizando TCFC, mesmo que por diferentes operadores.
INTRODUCTION
Patients with malocclusion oten present one or more characteristics related to asymmetry, for instance, Class II or III subdivision, dental midlines that are not coincident with each other, and/or dental midlines that are not
coin-cident with the facial midline.1 Proper orthodontic
treat-ment planning requires a correct diagnosis. Dental arch rotation on the vertical axis, known as yaw, is oten omit-ted in classiications and diagnosis. This important piece of information can determine the need for asymmetric mechanics or extractions to correct a dental midline shit
or a unilateral Class II or III relationship, for example.2
Diferent methods can be used for diagnosis of pa-tient’s dental symmetry in relation to the skeletal midline
(midsagittal plane). Burstone1 has suggested, within a
few limitations, the use of posteroanterior radiography to evaluate maxillary and mandibular discrepancies and the upper and lower dental midlines in relation to the skel-etal midline. Another method suggests that the median
raphe is the patient’s skeletal midline.3 In this method,
the relationship between teeth and bone can be ana-lyzed by means of dental casts. Furthermore, the
meth-ods described by Moyer3 or Proit4 can help to identify
asymmetry by means of a ruler and a bow divider or a symmetric grid, respectively. More recently, advances in technology have allowed the transfer of plaster models to
a computer by using scanners.5 They have also enabled
three-dimensional models to be created on the basis of data obtained from Cone Beam Computed Tomography (CBCT), reproducing the patient’s teeth and
surround-ing bone structures.6 These models, however, are not
linked to the patient’s face anatomy; therefore, the advan-tages that a CBCT can provide, such as skeletal and dental diagnosis, are not used to their full potential. With a view to addressing such issue, some computer programs allow navigation in CBCT data through tomographic slices taken in the three planes of space and, with adjustment of the threshold, it is possible to visualize, at the same time,
the teeth, bone and sot tissues.7 Thus, the aim of this
study was to validate a method used to evaluate, by means of CBCT, dental asymmetry (molars, canine and dental midline) in relation to the skeletal midline.
MATERIAL AND METHODS
Sample size calculation was carried out (α = 0.05;
β = 0.2; ρ0 = 0.45; ρ1 = 0.90)8 and revealed that ten patients
would be enough for 10 observations (twice, 5 observers).
This study, approved by the Federal University of Rio de Janeiro Institutional Review Board, comprised ten patients who were being orthodontically treated and had CBCT taken. Patients were randomly selected. In selecting the sample, the following exclusion criteria were applied: absence of canines and incisors; presence of restorations at the evaluated sites; and syndromes, such as clet lip and palate, by which maxillary bone formation could be afected.
The CBCT equipment used was an i-CAT (Imag-ing Sciences, Hatield, PA), with a 13 x 17 cm ield of view, voxel dimension of 0.4 mm and exposure time of 20 seconds. The images were obtained at 120 kVp and 5 mA. All patients were in maximum intercuspa-tion during the scan.
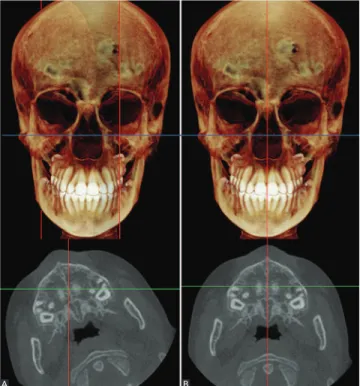
Ater the images were taken, one operator imported all DICOM (Digital Images and Communication in Medicine) iles into Dolphin 3D (Dolphin Imaging, ver-sion 11.0, Chatsworth, CA) sotware. For standardization purposes, the Frankfort Horizontal Plane was horizon-tally oriented for all patients. In addition, slice thickness was set to be equal to the voxel size. Patients’ data were saved and all the observers started taking the measure-ments at this point. Each observer had to orient the pa-tient’s head (turning to let or right, only) and had to try to match the skeletal midline with the sagittal plane (Fig 1),
Figure 1 - A) Example of a patient with the Frankfort Horizontal Plane hori-zontally oriented. B) After one operator reoriented the skeletal midline with the sagittal plane (red).
Figure 2 - Example of landmark positioning. After being identified in three different slices, the landmark was plotted in the axial view of the multiplanar reconstruction (lower left box).
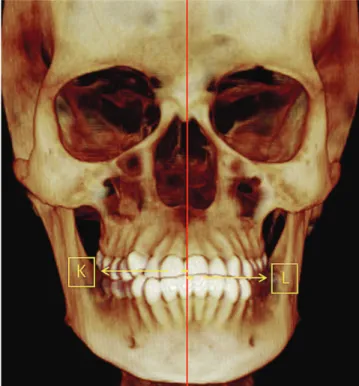
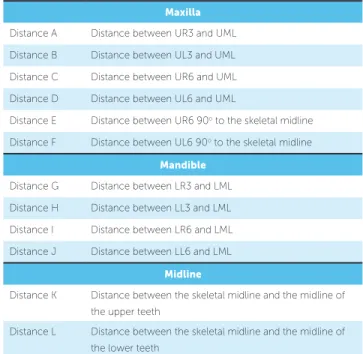
Figure 3 - Linear distances as shown in Table 2. Figure 4 - Linear distances as shown in Table 2.
using nasion, anterior nasal spine and posterior nasal spine as reference, before beginning the analyses.
Five diferent observers — all students of Ortho-dontics, with one to two years of experience working with CBCT — were asked to test the reproducibil-ity of 10 landmarks and 12 distances using the CBCT scans, as shown in Tables 1 and 2. Calibration was done
with two scans that were not included in the sample. Evaluations were carried out independently and re-peated within an interval of ten days. For more accu-racy in the following step, the size of the landmarks was set at 0.01 mm. All four views (sagittal, axial, coronal and the rendered image) were used as reference to locate the landmarks. However, landmarks were only plotted in the axial slices of the multiplanar reconstruction (Fig 2). Figure 3 and 4 show the distances between the land-marks used in the study.
Landmarks and distances were obtained by means of the Digitize/Measurement tool available in the 3D view of the sotware. Ater all landmarks were plotted, the next step was to measure the distance between them. The sot-ware did not allow automatic connection between two landmarks. For this reason, this step had to be taken man-ually. To calculate the distance between two landmarks, the observer only connected the landmarks of interest. Both landmarks and distances were exported to Microsot Excel (Microsot Corporation, Redmond, WA).
STATISTICAL ANALYSES
Landmark Anatomic region Coronal slice Axial slice Sagittal slice Maxilla
UR6 Right molar mesiobuccal cusp tip Middle-inferior-most point Middle point Middle-inferior-most point UR3 Right canine cusp tip Middle-inferior-most point Middle point Middle-inferior-most point
UML Skeletal midline at upper incisors incisal edge
Middle-inferior-most point between incisors
Middle point between
incisors Anterior-inferior-most point UL6 Left molar mesiobuccal cusp tip Middle-inferior-most point Middle point Middle-inferior-most point UL3 Left canine cusp tip Middle-inferior-most point Middle point Middle-inferior-most point
Mandible
LR6 Right molar mesiobuccal cusp tip Middle-superior-most point Middle point Middle-superior-most point LR3 Right canine cusp tip Middle-superior-most point Middle point Middle-superior-most point
LML
Skeletal midline at lower incisors incisal edge
Middle-superior-most point between incisors
Middle point between
incisors Anterior-superior-most point LL6 Left molar mesiobuccal cusp tip Middle-superior-most point Middle point Middle-superior-most point LL3 Left canine cusp tip Middle-superior-most point Middle point Middle-superior-most point Table 1 - Localization of the landmarks used in the study.
RESULTS
The reliability in deining the landmarks was esti-mated by ICC for each coordinate of each landmark. As a result, 30 variables (x, y and z for each landmark) were tested. The ICC was ≥ 0.9 for 27 (90%) of all in-traobserver assessments, and the lowest inin-traobserver co-eicient was 0.706. The ICC was ≥ 0.9 for 25 (83%) for all interobserver assessments, and the lowest interobserver coeicient was 0.591.
Table 3 shows the frequency of intraobserver and interobserver reliability estimated by ICC for the distances measured.
Table 4 shows the frequency of the mean diference for the distances measured by each observer. The mean dif-ference was calculated using paired t-tests performed be-tween every two observers for each distance. The results are summarized in Table 4 and illustrate that 10 (83%) measurements had a very small mean diference of less than 0.5 mm and no measurement had a mean diference greater than 1 mm.
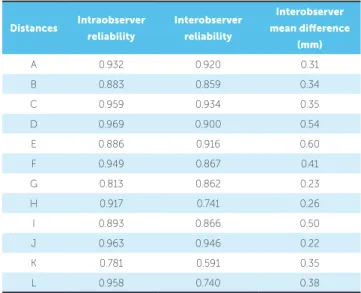
Table 5 lists the reliability estimated by ICC and the interobserver mean diference for each distance.
DISCUSSION
Only skeletal structures were used to deine the skeletal midline in this study. The references used were
Maxilla
Distance A Distance between UR3 and UML Distance B Distance between UL3 and UML Distance C Distance between UR6 and UML Distance D Distance between UL6 and UML
Distance E Distance between UR6 90o to the skeletal midline
Distance F Distance between UL6 90o to the skeletal midline
Mandible
Distance G Distance between LR3 and LML Distance H Distance between LL3 and LML Distance I Distance between LR6 and LML Distance J Distance between LL6 and LML
Midline
Distance K Distance between the skeletal midline and the midline of the upper teeth
Distance L Distance between the skeletal midline and the midline of the lower teeth
Table 2 - Distance between landmarks.
Values Intraobserver Interobserver
n (%) n (%)
ICC ≥ 0.90 7 58 5 42
0.75 < ICC < 0.90 5 42 4 33 0.45 < ICC ≤ 0.75 0 0 3 25
ICC ≤ 0.45 0 0 0 0
Total 12 100 12 100
Table 3 - Frequency of intra and interobserver reliability estimated by intra-class correlation coefficient (ICC) for the distances measured.
Values (mm) n (%)
≥ 2 0 0
1 < x < 2 0 0
0.5 < x ≤ 1 2 17
≤ 0.5 10 83
Total 12 100
Table 4 - Frequency of the mean difference among observers on the dis-tances measured.
Distances Intraobserver reliability
Interobserver reliability
Interobserver mean diference
(mm)
A 0.932 0.920 0.31
B 0.883 0.859 0.34
C 0.959 0.934 0.35
D 0.969 0.900 0.54
E 0.886 0.916 0.60
F 0.949 0.867 0.41
G 0.813 0.862 0.23
H 0.917 0.741 0.26
I 0.893 0.866 0.50
J 0.963 0.946 0.22
K 0.781 0.591 0.35
L 0.958 0.740 0.38
Table 5 - Reliability estimated by intraclass correlation coefficient (ICC) for each distance.
landmarks such as anterior and posterior nasal spine and
nasion. Diferently from other studies using CBCT,9,10
only the Frankfort Horizontal Plane was pre-orient-ed and each individual observer later establishpre-orient-ed the skeletal midline. The reason was that if the head was already oriented with the skeletal midline in the sagit-tal plane, it would increase the likelihood for bias and make it easier for each observer to deine the plane.
Head orientation does not inluence linear
measure-ments;11 as long as the same landmarks were obtained,
measurements should be the same.
Grauer et al7 demonstrated that landmarks are better
located when plotted in the stack of slices rather than in rendered images. This technique was employed by our study of which results corroborate the indings of
other researches that showed high values for intraclass9,10
and interclass9,12 correlation for landmarks identiied in
dental structures.
Creed et al6 showed that anteroposterior
measure-ments for molars can be reliably taken using either digital models or surface models made on the basis of
CBCT data. Asquith et al13 investigated dental casts and
3D digital study models and found that intraexaminer mean diferences for this variable were ≤0.05 mm and ≤0.32 mm, respectively. Our study had slightly higher mean diferences; however, it was interexaminer instead of intraexaminer. In addition, the values were not clini-cally signiicant (all of them ≤ 0.54 mm). The present research also conirmed that the same type of antero-posterior evaluation can be applied for the canines.
Mean diference between observers for distances from skeletal to dental midlines were ≤ 0.4 mm. The other transversal measurement, molars perpendicular line to the skeletal midline, showed good reliability between observers. Other techniques have been applied for this evaluation. However, conventional or 3D digital models can use only the palatal rugae as reference, which is
reli-able for growing patients.14 Nonetheless, using the raphe
as the skeletal midline may not be the best option, as it
has diferent shapes and curvatures.1 Nevertheless,
skel-etal midline and raphe have been associated in the past.15
With 3D surface models, one can obtain other struc-tures that would likely provide a reliable skeletal midline. However, the production of these models involves either hiring a specialized company, which implies in higher
costs,6 or computer expertise, which is extremely time
consuming.9,16 To our view, the process involved in any
of these options does not outweigh the beneits.
1. Burstone CJ. Diagnosis and treatment planning of patients with asymmetries. Semin Orthod. 1998;4(3):153-64.
2. Ackerman JL, Proit WR, Sarver DM, Ackerman MB, Kean MR. Pitch, roll, and yaw: describing the spatial orientation of dentofacial traits. Am J Orthod Dentofacial Orthop. 2007;131(3):305-10.
3. Moyers RE. Handbook of orthodontics. Chicago: Year Book Medical Publishers; 1988.
4. Proit WR, Fields HW, Sarver DM. Contemporary orthodontics. St. Louis: Mosby; 2007.
5. Boldt F, Weinzierl C, Hertrich K, Hirschfelder U. Comparison of the spatial landmark scatter of various 3D digitalization methods. J Orofac Orthop. 2009;70:247-63.
6. Creed B, Kau CH, English JD, Xia JJ, Lee RP. A comparison of the accuracy of linear measurements obtained from cone beam computerized tomography images and digital models. Semin Orthod. 2011;17:49-56.
7. Grauer D, Cevidanes LS, Proit WR. Working with DICOM craniofacial images. Am J Orthod Dentofacial Orthop. 2009;136(3):460-70. 8. Walter SD, Eliasziw M, Donner A. Sample size and optimal designs for
reliability studies. Stat Med. 1998;17(1):101-10.
9. Oliveira AE, Cevidanes LH, Phillips C, Motta A, Burke B, Tyndall D. Observer reliability of three-dimensional cephalometric landmark identiication on cone-beam computerized tomography. Oral Surg Oral Med Oral Pathol Oral Radiol Endod. 2009;107(2):256-65.
10. Sanders DA, Rigali PH, Neace WP, Uribe F, Nanda R. Skeletal and dental asymmetries in Class II subdivision malocclusions using cone-beam computed tomography. Am J Orthod Dentofacial Orthop. 2010;138(5):542.e1-20; discussion 542-3.
11. El-Beialy AR, Fayed MS, El-Bialy AM, Mostafa YA. Accuracy and reliability of cone-beam computed tomography measurements: inluence of head orientation. Am J Orthod Dentofacial Orthop. 2011;140(2):157-65. 12. Fuyamada M, Nawa H, Shibata M, Yoshida K, Kise Y, Katsumata A, et
al. Reproducibility of landmark identiication in the jaw and teeth on 3-dimensional cone-beam computed tomography images. Angle Orthod. 2011;81(5):843-9.
REFERENCES
13. Asquith J, Gillgrass T, Mossey P. Three-dimensional imaging of orthodontic models: a pilot study. Eur J Orthod. 2007;29(5):517-22. 14. Almeida MA, Phillips C, Kula K, Tulloch C. Stability of the palatal rugae as
landmarks for analysis of dental casts. Angle Orthod. 1995;65(1):43-8. 15. Harvold EP, Trugue M, Viloria JO. Estabilishing the median
plane in posteroanterior cephalograms. In: Salzmann JA, editor. Roentgenographic cephalometrics. Philadelphia: J. B. Lippincott; 1961. 16. Cevidanes LH, Oliveira AE, Grauer D, Styner M, Proit WR. Clinical
application of 3D imaging for assessment of treatment outcomes. Semin Orthod. 2011;17:72-80.
17. Ludlow JB, Davies-Ludlow LE, Brooks SL. Dosimetry of two extraoral direct digital imaging devices: NewTom cone beam CT and Orthophos Plus DS panoramic unit. Dentomaxillofac Radiol. 2003;32:229-34. 18. Schulze D, Heiland M, Thurmann H, Adam G. Radiation exposure during
midfacial imaging using 4- and 16-slice computed tomography, cone beam computed tomography systems and conventional radiography. Dentomaxillofac Radiol. 2004;33(2):83-6.
19. Mozzo P, Procacci C, Tacconi A, Martini PT, Andreis IA. A new volumetric CT machine for dental imaging based on the cone-beam technique: preliminary results. Eur Radiol. 1998;8(9):1558-64.
20. Kapila S, Conley RS, Harrell WE Jr. The current status of cone beam computed tomography imaging in orthodontics. Dentomaxillofac Radiol. 2011;40(1):24-34.
21. Cha JY, Mah J, Sinclair P. Incidental indings in the maxillofacial area with 3-dimensional cone-beam imaging. Am J Orthod Dentofacial Orthop. 2007;132(1):7-14.
22. Mah JK, Danforth RA, Bumann A, Hatcher D. Radiation absorbed in maxillofacial imaging with a new dental computed tomography device. Oral Surg Oral Med Oral Pathol Oral Radiol Endod. 2003;96(4):508-13. 23. Beyer JW, Lindauer SJ. Evaluation of dental midline position. Semin
Orthod. 1998;4(3):146-52.
24. Jerrold L, Lowenstein LJ. The midline: diagnosis and treatment. Am J Orthod Dentofacial Orthop. 1990;97(6):453-62.
is an important piece of data that can be obtained for cases of skeletal asymmetry, we do not recommend that CBCT scans be taken for this purpose only. In spite of being rec-ommended for very speciic cases, CBCT scans have lower
radiation doses,17,18 lower costs and good accuracy.19 For
this reason, the exam has been increasingly used, in
ad-dition to becoming more accepted.20 The radiation
dos-es involved in this type of exam are similar to those of a full-mouth series of radiographs. Furthermore, one single CBCT scan is able to provide data for airway, sinus and
TMJ analyses.21,22 On the other hand, another drawback is
the potential presence of artifacts in the areas of interest and the need for speciic sotware for evaluation.
Clinically determining dental midline shits using the sot tissue as reference can be misleading when there
are asymmetries in nose, chin or philtrum.23 The
pro-posed “imaginary plumb” method24 as a true vertical
line is afected by the patient and operator position as well as the parallax efect.
Anteroposterior dental asymmetry is oten pres-ent in subdivision malocclusions. It can be corrected by means of minor dental movements or extrac-tions depending on the degree of the discrepancy. It is necessary to diagnose in which arch and side the asymmetry is located to decide which mechanics will be applied. The evaluation on dental casts will use the raphe as the skeletal midline, but some degree of variation might occur between diferent operators due to the shape of the raphe. Therefore, evaluating den-tal asymmetry by means of CBCT images and hav-ing the skeletal midline as reference provides useful information for diagnosis.
CONCLUSION